ReSu mt4
- 指标
- 版本: 2.0
- 更新: 18 十一月 2023
- 激活: 7
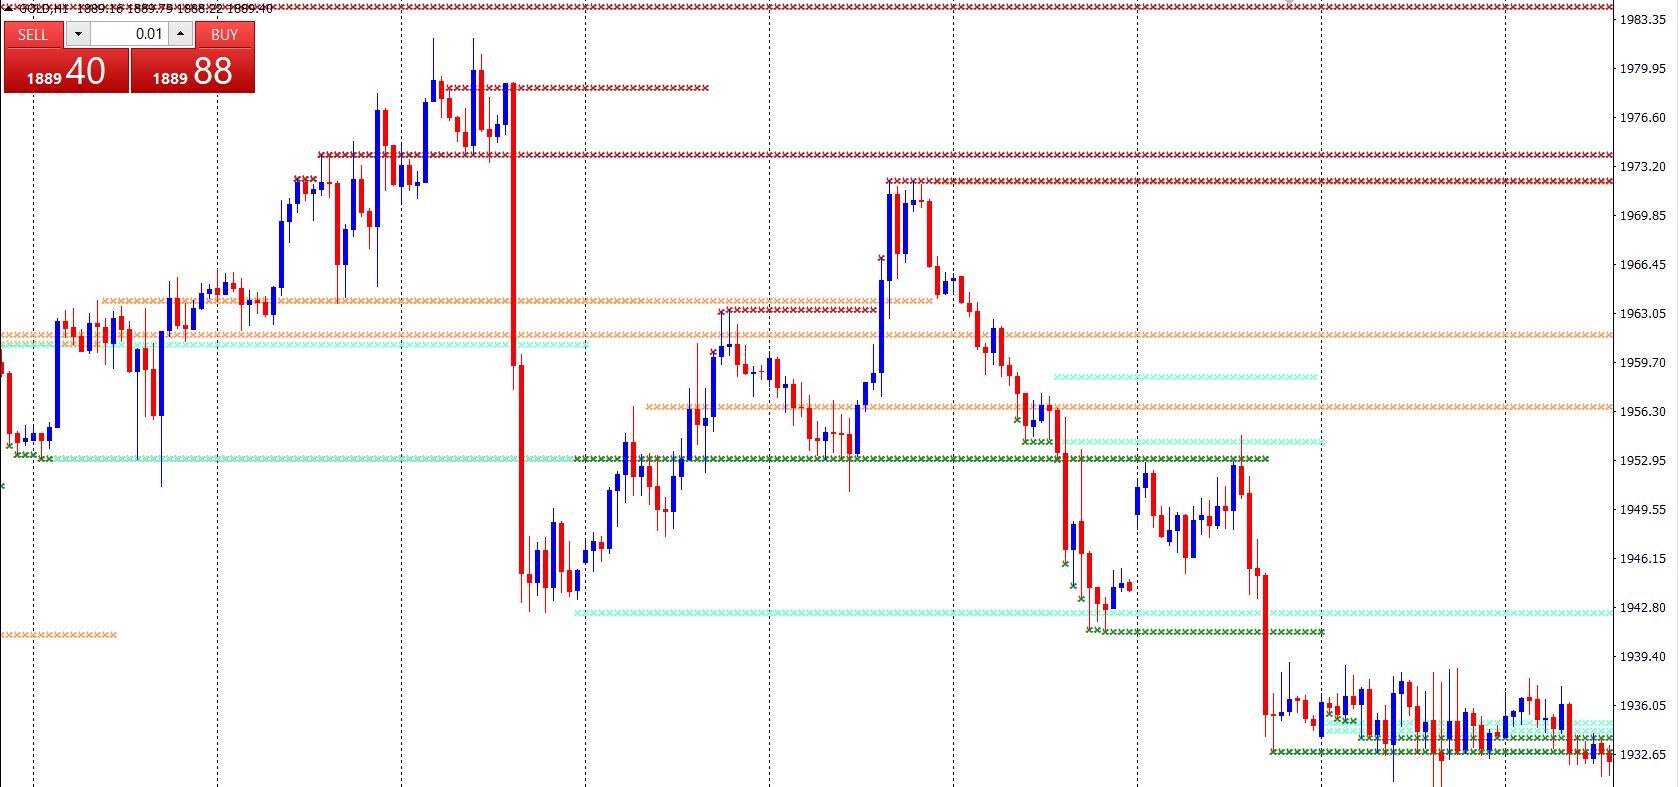
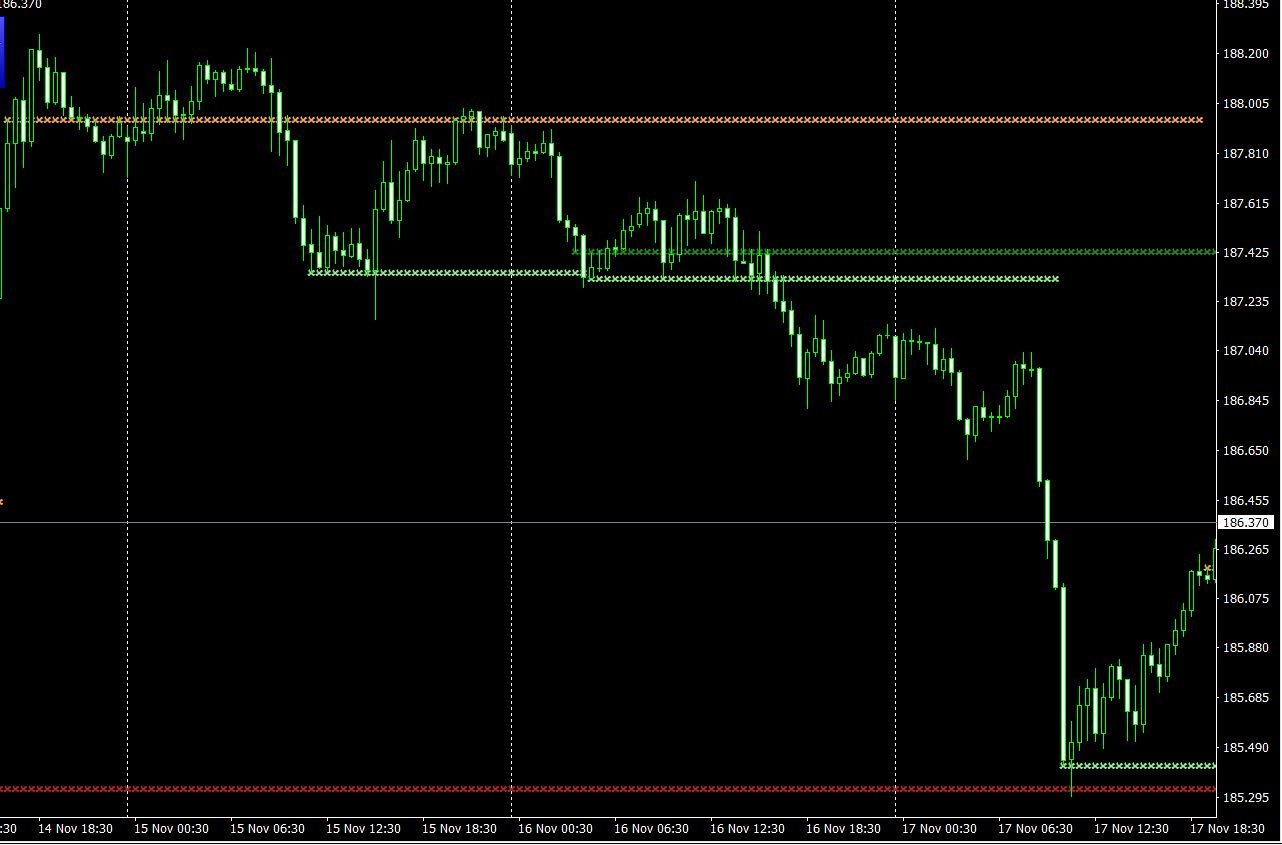
The Wamek Support and Resistant (WSR) Indicator is a remarkable tool that stands out in the world of technical analysis. It sets itself apart by cleverly combining price action and leading indicators to delineate support and resistance levels with a high degree of accuracy. Its unique feature is its adaptability; users can fine-tune the indicator by adjusting input parameters, enabling them to create customized support and resistance levels that suit their trading strategies. Notably, one of WSR's most attractive qualities is its non-repainting nature, meaning once it identifies a level as support or resistance, it maintains that classification.
To consider a price level as either support or resistance in real-time, WSR recommends waiting for a minimum of four price points to form around that level. This prudent approach ensures that the support or resistance is more robust and less prone to false signals. When such a level has been established, traders are advised to be patient and wait for price action to retest it.
The WSR Indicator's present offering is even more enticing, as it currently enjoys a substantial 40% discount. This limited-time opportunity invites traders to seize the advantage of this cutting-edge indicator at a reduced cost. Now is the opportune moment to leverage the distinct capabilities of the WSR Indicator and elevate your trading endeavors to new heights.
Now, let's delve deeper into how the Wamek Support and Resistant Indicator can significantly enhance your trading experience:
Reliability at its Core:
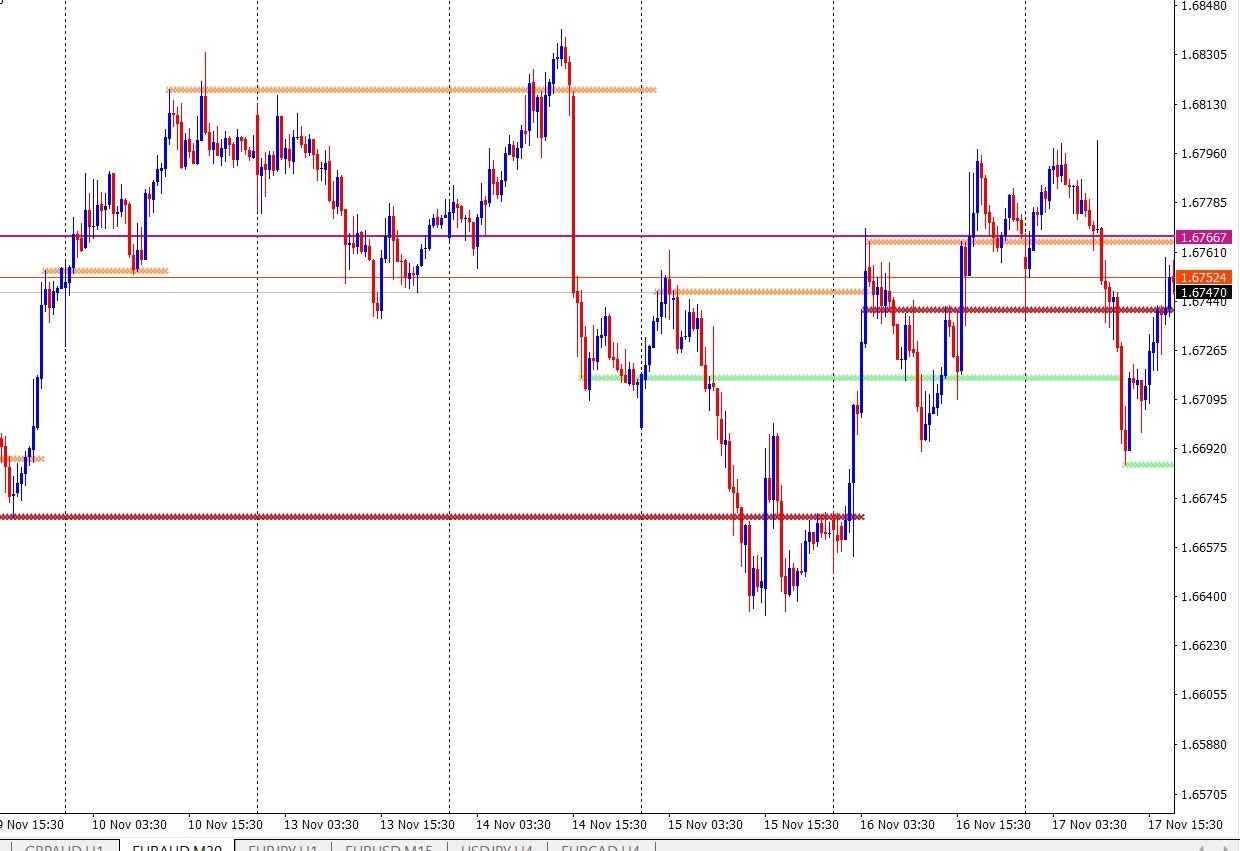
WSR instills confidence in traders by providing dependable support and resistance levels. The algorithm's ability to analyze both historical data and current price action enables it to generate levels that are more likely to hold up in the face of market volatility. This reliability is invaluable to traders looking to make informed decisions in a constantly changing market environment. It eliminates the need for guesswork and minimizes the risks associated with trading blind.
Tailored to Your Strategy:
What truly sets WSR apart is its adaptability. By adjusting the input parameters, traders can fine-tune the indicator to align with their specific trading strategies. Whether you're a day trader looking for short-term support and resistance levels or a swing trader with a longer time horizon, WSR can be customized to cater to your unique needs. This versatility empowers traders to refine their strategies and make more informed decisions.
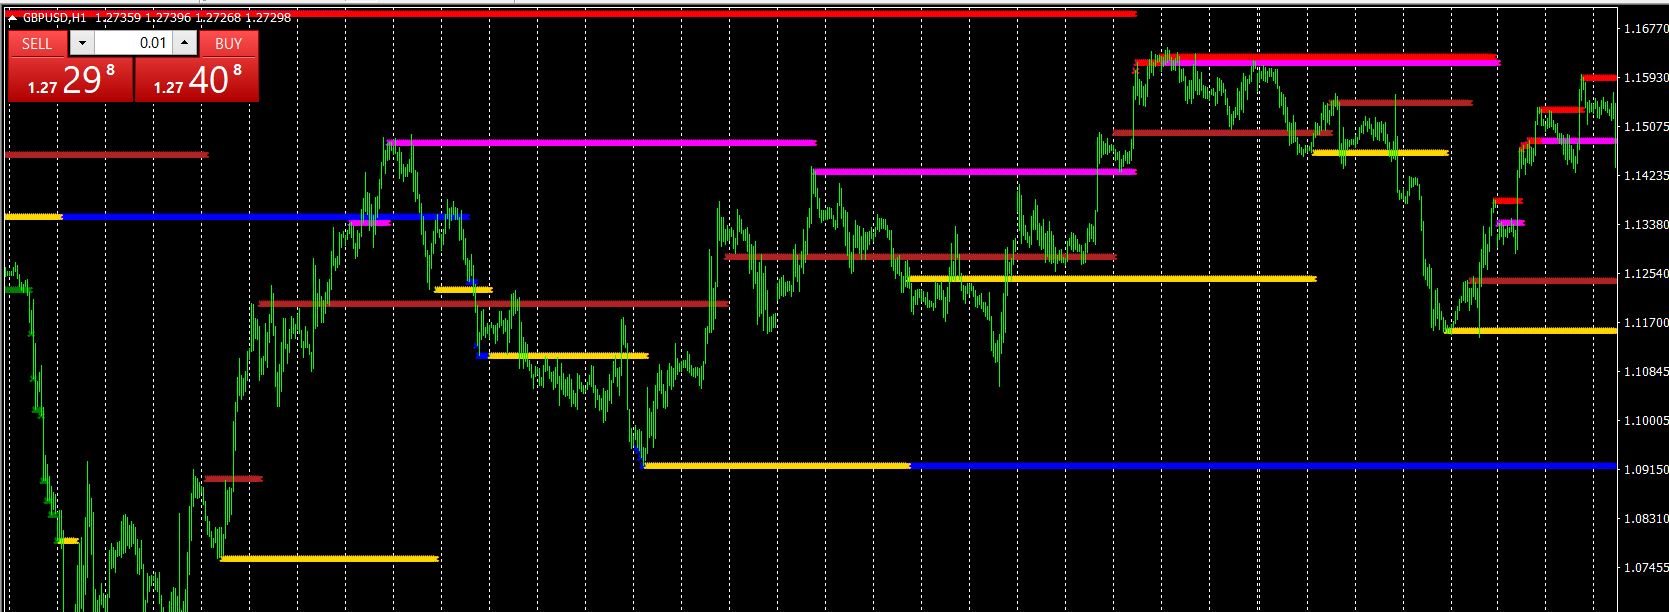
To cater to individual preferences, the WSR Indicator extends the privilege of altering color codes. This customization feature allows traders to align the indicator's visual representation with their personal aesthetics and preferences, fostering a more immersive and user-friendly experience.
Across Various Markets:
WSR's capabilities are not limited to a specific asset class. It is equally effective when applied to currencies, commodities, stocks, and cryptocurrencies. This versatility ensures that traders can utilize WSR across a wide range of financial markets, making it a valuable tool for those with diverse investment portfolios. Whether you're trading the highly liquid forex market or the volatile world of cryptocurrencies, WSR can help you identify key support and resistance levels to inform your trading decisions.
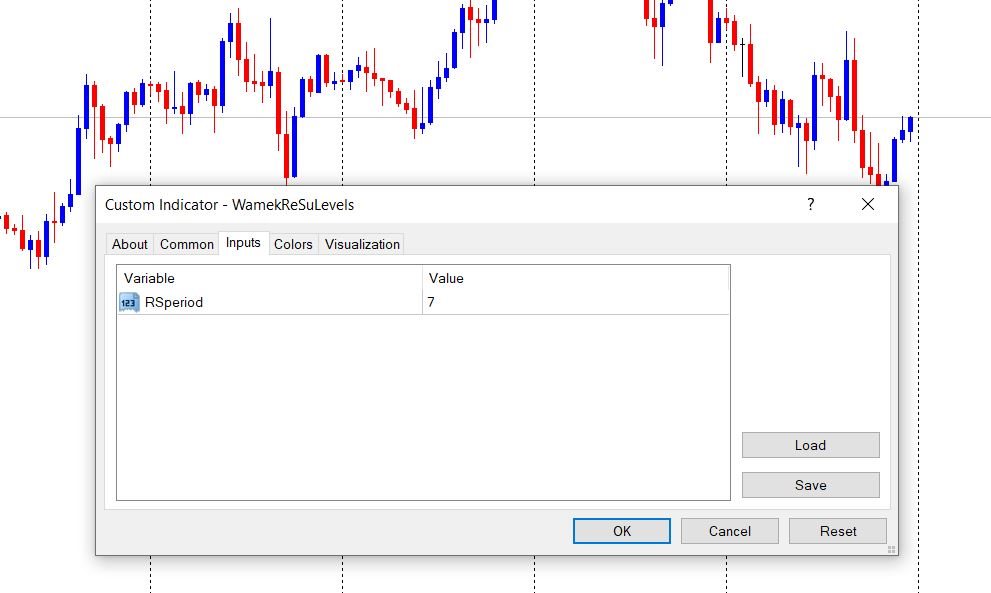
Default Setting:
The default setting of WSR's input parameter is RSperiod=7. This setting can serve as a good starting point for many traders, providing a balanced approach to identifying support and resistance levels. However, it's essential to remember that customization is the key to unlocking the full potential of this indicator. Traders should experiment with different input values to fine-tune WSR to their specific trading goals and timeframes.
In conclusion, the Wamek Support and Resistant Indicator is a versatile and powerful tool that can significantly enhance your trading experience. Its ability to combine price action and leading indicators to identify support and resistance levels, along with its flexibility in adapting to various trading strategies and asset classes, makes it an asset for traders seeking reliable and customized insights into the market. Whether you're a novice or an experienced trader, WSR has the potential to be a game-changer in your trading toolkit.