Pivot Alignment Atlas

Pivot Alignment Atlas – BOS / FVG / Order Block Indicator

Quick Start Guide

  1. Add the indicator to your chart.

  2. Enable MTF Panel and turn on Setup Alerts.

  3. Optional: Use the Time Filter to scan only your preferred session hours.

  4. Monitor key signals: BOS/ChoCH labels, FVG/OB zones, and Setup markers.

  5. Execute trades when a recommended setup appears (marker + structure + zone confluence).

Market Structure • Smart Money Concepts • FVG & Order Block Setup Tool

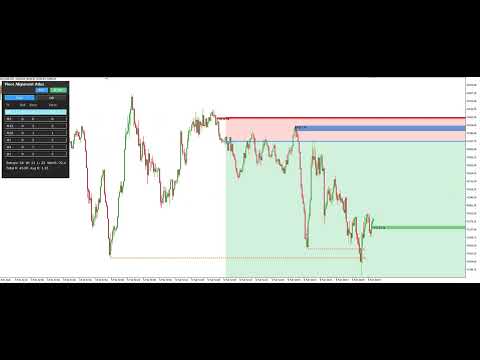
Pivt Alignment Atlas is a professional Smart Money Concepts (SMC) and Market Structure indicator for MetaTrader 5.

It automatically detects and visualizes:

  • Fair Value Gaps (FVG)

  • Order Blocks (OB)

  • Break of Structure (BOS)

  • Change of Character (CHoCH)

The tool aligns price action structure with imbalance zones and generates structured trade setup proposals based on confluence logic.

Important: All setups are analytical suggestions only and do not represent automated trading signals. Proper confirmation and risk management remain essential.

Market Structure & Smart Money Detection

  • Automatic BOS and CHoCH recognition based on price movement

  • FVG detection using 3-candle imbalance logic

  • Order Block identification from structural pivots

  • Clean visualization of structural shifts and liquidity zones

  • Designed for price action and supply & demand traders

Multi-Timeframe (MTF) Panel

  • Counts active FVGs and Order Blocks across multiple timeframes

  • Displays higher timeframe imbalance context

  • Supports Dark Mode and Light Mode

  • Clear structural overview for multi-timeframe alignment

Setup Generation Engine (Confluence-Based)

Based on:

  • Market bias

  • BOS confirmation

  • CHoCH shifts

  • FVG / Order Block confluence

The indicator generates structured trade setup proposals directly on the chart.

Integrated statistics panel tracks:

  • Total setups

  • Win rate (%)

  • Risk / Reward performance

Alerts System (Zone & Setup Alerts)

  • Alerts when FVG or Order Block zones are hit

  • Multi-timeframe zone alerts supported

  • Alerts when a new setup is generated

  • Popup, sound and push notification support

Custom Time Filter

  • Define a custom trading time window

  • Visualize zones only within your selected session

  • Ideal for London, New York, or custom session traders

  • Keeps charts clean outside active trading hours

Built For

  • Smart Money Concepts traders

  • Market structure traders

  • Supply & demand traders

  • Multi-timeframe confluence strategies

  • Traders who want structured setup generation instead of isolated signals


推荐产品
SMC Venom 模型 BPR 指標是針對在智慧貨幣 (SMC) 概念內工作的交易者的專業工具。它會自動辨識價格圖表上的兩種關鍵模式: FVG (公平價值缺口)是三根蠟燭的組合,其中第一根和第三根蠟燭之間存在缺口。它在水平之間形成一個沒有成交量支撐的區域,這通常會導致價格調整。 BPR (平衡價格區間)是兩種 FVG 模式的組合,形成一個「橋樑」 - 當價格以低成交量活動移動時,突破並返回到水平的區域,從而在蠟燭之間產生間隙。 這些模式可協助交易者透過分析圖表上的交易量和價格動態(大型市場參與者和普通參與者之間的互動)來識別關鍵的支撐/阻力位、突破區域和切入點。 此指標以矩形和箭頭的形式可視化模式,也支援靈活的警報設定。 主要特點: 模式顯示模式:選擇顯示 BPR 模式(看漲和看跌)或 FVG 模式(看漲和看跌)。 可以隱藏所有圖表分析模式。 以條數過濾:BPR 結構中 FVG 之間的最小/最大距離。 訊號的附加視覺化: 箭頭有 9 種類型可供選擇(標準、細、分形等)或手動輸入 Wingdings 代碼,其表格可以選擇性地顯示在圖表上。 設定顏色、尺寸及其縮放時相對於價格的動態
Fibaction
Abdelkhalek Orabi
Indicator Name: Fibaction – price action candle Detector Description: Fibo Signal Boxes is a powerful Smart Money Concept (SMC)-inspired indicator that auto-detects price action candles. bullish hammers and shooting stars, then draws precise Fibonacci entry zones and multiple take-profit levels directly on the chart. as for the SL personally i use 40 pips rules  Key Features: Detects bullish hammer and shooting star reversal candles. Automatically draws Fibonacci entry and TP boxes. as
Blahtech Market Profile MT5
Blahtech Limited
5 (10)
Was: $249  Now: $99   Market Profile defines a number of day types that can help the trader to determine market behaviour. A key feature is the Value Area, representing the range of price action where 70% of trading took place. Understanding the Value Area can give traders valuable insight into market direction and establish the higher odds trade. It is an excellent addition to any system you may be using. Inspired by Jim Dalton’s book “Mind Over Markets”, this indicator is designed to suit the
The new update makes this indicator a complete tool for studying, analyzing and operating probabilistic patterns. It includes: On-chart Multi-asset percentage monitor. Configurable martingales. Twenty-one pre-configured patterns, including Mhi patterns and C3. An advanced pattern editor to store up to 5 custom patterns. Backtest mode to test results with loss reports. Trend filter. Hit operational filter. Martingale Cycles option. Various types of strategies and alerts. Confluence between patter
Volume Profile V6
Andrey Kolesnik
4.67 (3)
市场的成交量曲线指标+一个智能振荡器. 它适用于几乎所有工具-货币对,股票,期货,加密货币,实际交易量和报价。 您可以设置配置文件范围的自动定义,例如,一周或一个月等。,并通过移动边界(两条垂直线红色和蓝色)手动设置范围。 示为直方图。 此级别直方图的宽度有条件地意味着在其上进行的交易数量。 使用"模式水平线颜色"参数,您可以设置自动显示价格可能会击退的最重要交易量水平,而最大颜色参数则分别显示整个设定范围内最大交易量的水平。     智能振荡器显示超买和超卖区域,它分析来自多个指标的信息,并根据处理的数据,以适当的颜色为超买和超卖区域着色。     在Volume every day中,您可以使用Range period参数设置构建配置文件的时间范围,并使用Range count参数设置这些范围的配置文件数量。 例如,Range period=1day,Range count=10表示配置文件将基于一天的周期,即最后十天。 重要的是,切换图表的时间框架不会影响配置文件的构建,这也是该指标的一个额外优势。      该指标非常简单易用,同时尽可能提供信息。 有了这个指标,做市商将
KT Renko Patterns MT5
KEENBASE SOFTWARE SOLUTIONS
KT Renko Patterns 会逐砖扫描整个 Renko 图表,寻找那些在各种金融市场中被交易者频繁使用的著名图表形态。 与基于时间的图表相比,Renko 图由于其简洁清晰的特性,更容易识别图表形态,尤其适合基于形态的交易策略。 KT Renko Patterns 包含多种常见的 Renko 图形模式,其中许多都在 Prashant Shah 所著的《用 Renko 图表实现盈利交易》一书中有详细说明。 基于 KT Renko Patterns 指标开发的 100% 自动交易EA已发布,点击这里了解 - KT Renko Patterns EA 。 特点 可交易多达八种清晰明确的 Renko 图形模式,无任何模糊。 每种模式都配有止损位和斐波那契目标位,确保交易策略客观明确。 KT Renko Patterns 实时监测每种模式的准确率,并将关键统计信息显示在图表上。 当 Renko 砖块发生反转时会自动标记并提醒,有助于在行情突变时提前计划退出。 已识别的图形不会重绘或重新绘制,信号稳定可靠。 包含的图形模式 W-M 形态 强势旗形 AB=CD 形态 三顶/三底 双顶
Donchian Breakout And Rsi
Mattia Impicciatore
5 (1)
概述 本指标是经典 Donchian 通道 的增强版,增加了多种实用的交易功能。 除了标准的三条线(最高、最低和中线),系统能够检测 突破 ,并在图表上用箭头进行可视化标记,同时只显示 与当前趋势方向相反的那条线 ,让图表更加简洁。 功能包括: 可视化信号 :突破时在图表上绘制彩色箭头 自动通知 :弹窗、Push 推送和 Email 邮件 RSI 过滤 :根据市场相对强弱验证信号 个性化设置 :颜色、线条粗细、箭头符号、RSI 阈值等 工作原理 Donchian 通道计算: 上轨线 :最近 N 根已收盘 K 线的最高价 下轨线 :最近 N 根已收盘 K 线的最低价 中线 :最高价和最低价的平均值 看涨突破 :收盘价高于上轨线 看跌突破 :收盘价低于下轨线 指标会: 绘制三条 Donchian 通道线 仅在 方向变化后的首次突破 绘制箭头 隐藏顺应趋势方向的那条线(上涨趋势: 只显示红色下轨线;下跌趋势: 只显示绿色上轨线) 可选用 RSI 过滤突破信号,减少虚假突破 支持实时发送通知 参数说明 Donchian 通道设置 indPeriod :计算通道高低点的已收盘 K 线数量 Lin
FREE
Harmonic Pattern Structure Harmonic Pattern Structure is a professional MetaTrader 5 indicator that automatically detects classic harmonic patterns using strict Fibonacci ratio validation and XABCD price structure. Designed for traders who value precision, clean visuals, and structured analysis, the indicator highlights potential reversal zones based on price geometry, supporting consistent and objective decision-making. SUPPORTED HARMONIC PATTERNS Gartley (222) Butterfly Bat Crab Shark Cy
No Demand No Supply MT5
Trade The Volume Waves Single Member P.C.
No Demand No Supply   This indicator identifies   No Demand –No Supply candles to your chart and plots volume bars colored according to the signal. It can be applied to all timeframes or to a specific one only. It can also be used as regular volume indicator  with exceptional future of WEIGHTED VOLUME. Furthermore is has an alert notification, sound and email when a signals occurs. The indicator does not repaint but the alert will come on two candles back due to the definition of No Demand No Su
PZ Mean Reversion MT5
PZ TRADING SLU
3 (2)
采用专业和量化方法进行均值回归交易的独特指标。它利用了价格以可预测和可衡量的方式转移并返回均值这一事实,这允许明确的进入和退出规则大大优于非量化交易策略。 [ Installation Guide | Update Guide | Troubleshooting | FAQ | All Products ] 清晰的交易信号 非常容易交易 可定制的颜色和尺寸 实现性能统计 优于大多数交易策略 显示合适的止损和止盈水平 它实现了电子邮件/声音/视觉警报 这个怎么运作 该指标从更高的时间范围测量完全可定制的移动平均线的标准偏差,并使用趋势跟踪方法精确地找到交易。交易是通过深入当前图表的价格行为发现的,并在价格返回到平均价格区间时关闭,根据您选择的更高时间范围计算。由于其编码方式,该指标将远离高波动性和强劲趋势市场,并且仅在可预测的情况下进行交易,在可接受的波动性与方向性比率范围内,回归均值是可行的。 指标剖析 绿线是更高时间范围内的移动平均线(也就是平均值) 虚线区域是移动平均线周围的典型价格区间 蓝线是看涨交易的突破价格 红线是看跌交易的突破价格 交易是针对均值进行的,并在典型的价格
可以说,这是您可以为MetaTrader平台找到的最完整的谐波价格形成自动识别指标。它检测19种不同的模式,像您一样认真对待斐波那契投影,显示潜在的反转区域(PRZ),并找到合适的止损和获利水平。 [ 安装指南 | 更新指南 | 故障排除 | 常见问题 | 所有产品 ] 它检测19种不同的谐波价格形态 它绘制了主要,衍生和互补的斐波那契投影(PRZ) 它评估过去的价格走势并显示每个过去的形态 该指标分析其自身的质量和性能 它显示合适的止损和获利水平 它使用突破来表明合适的交易 它在图表上绘制所有样式比率 它实现了电子邮件/声音/视觉警报 受斯科特·M·卡尼(Scott M. Carney)的书的启发,该指标旨在满足最纯粹和最熟练的交易者的需求。但是,它采取了一种使交易更容易的方式:在向交易发出信号之前,它会等待Donchian朝正确方向突破,从而使交易信号非常可靠。 斐波那契投影与向量无关 它实现了电子邮件/声音/推送警报 它绘制了ABCD投影 重要提示: 为了符合 Scott M. Carney先生 的商标申诉,某些图案名称已重命名为不言自明的替代方式, Scott M.
Your Trend Friend
Luigi Nunes Labigalini
5 (1)
The trend is your friend! Look at the color of the indicator and trade on that direction. It does not  repaint. After each candle is closed, that's the color of the trend. You can focus on shorter faster trends or major trends, just test what's most suitable for the symbol and timeframe you trade. Simply change the "Length" parameter and the indicator will automatically adapt. You can also change the color, thickness and style of the lines. Download and give it a try! There are big movements w
Overview Heiken Ashi CE Filtered MT5 is a technical indicator for the MetaTrader 5 platform. It integrates smoothed candlestick charting with a dynamic exit strategy and a customizable trend filter to deliver clear buy and sell signals. The indicator is designed to improve trend detection and signal reliability by reducing market noise. If you want to see more high-quality products or order the development/conversion of your own products, visit my partners' website: 4xDev Get 10% OFF on manual
Delta Profile Volume
Teresinha Moraes Correia
指标技术说明 – Delta Profile for MetaTrader 5 Delta Profile 是为 MetaTrader 5 开发的一款指标,用于在指定的 K 线区间内对成交量流进行详细分析。它能够在不同的价格水平上对正向成交量(与上涨相关)和负向成交量(与下跌相关)的不平衡进行结构化和可视化展示。最终,用户可以清晰地识别图表中成交最为集中的区域,以及真实的市场不平衡形成的位置。 以下是该指标的主要技术特征与参数说明。 核心概念 指标会识别 价格水平 ,并将其分类为正向成交量、负向成交量,以及净 Delta(正负成交量的差值)。 每个价格水平会在图表中以 水平条形 显示,帮助用户直观观察市场活跃区和不平衡区域。 用户可自由控制 分析的 K 线数量 、 价格精度(小数位数) 、 显示的最大水平数量 以及 可视化样式 。 主要功能 价格水平映射 :根据设定的精度对价格进行四舍五入,并累计对应 K 线的成交量。 净 Delta 计算 :显示正负成交量的差值,提供每个价格区间的客观数值。 最强 Delta 水平突出显示 :自动识别 Delta 绝对值最大的价格水平,并用特殊颜色标
该指标建立当前报价,可以与历史报价进行比较,并在此基础上进行价格走势预测。指示器有一个文本字段,用于快速导航到所需日期。 选项: 符号 - 选择指标将显示的符号; SymbolPeriod - 选择指标从中获取数据的时段; IndicatorColor - 指示器颜色; HorisontalShift - 由指标绘制的报价移动指定的柱数; Inverse - true 反转引号,false - 原始视图; ChartVerticalShiftStep - 图表垂直移动(键盘上的向上/向下箭头); 接下来是文本字段的设置,您可以在其中输入日期,您可以通过按“回车”立即跳转到该日期。 接下来是文本字段的设置,您可以在其中输入日期,您可以通过按“回车”立即跳转到该日期。
Visual Range Directional Force Indicator
AL MOOSAWI ABDULLAH JAFFER BAQER
Range Directional Force Indicator – Designed for You to Optimize! The Range Directional Force Indicator is a cutting-edge tool designed to empower traders by visualizing market dynamics and directional strength. Built to offer insights into market trends and reversals, this indicator is an invaluable asset for traders seeking precision in their strategies. However, it is important to note that this indicator is not optimized, leaving room for you to tailor it to your unique trading preferences.
Price Magnet — Price Density and Attraction Levels Indicator Price Magnet is a professional analytical tool designed to identify key support and resistance levels based on statistical Price Density. The indicator analyzes a specified historical period and detects price levels where the market spent the most time. These zones act as “magnets,” attracting price action or forming a structural base for potential reversals. Unlike traditional Volume Profile tools, Price Magnet focuses on price-time d
Max Min Delta Indicator - Market Volume Imbalance Analysis Gain Deeper Insights into Market Volume Imbalance with Delta Analysis What is the Max Min Delta Indicator? The Max Min Delta Indicator is a powerful market volume analysis tool that visually represents maximum and minimum delta values using a histogram. It helps traders identify market strength, weakness, absorption, and aggressive buying/selling activity with precision. Key Features Histogram Visualization: Displays Max Delta (Green) an
KT Double Top Bottom MT5
KEENBASE SOFTWARE SOLUTIONS
1 (1)
The double top bottom pattern is arguably one of the technical analysis's most popular chart patterns. These patterns are used to capitalize on recurring patterns and identify trend reversal patterns, thereby creating well-placed entry and exit levels. The KT Double Top Bottom is based on these patterns and fine-tunes the trade signal development process for traders. Features It's based on one of the most reliable trading patterns and brings some fine-tuning and automation to the process. Also
Best SAR MT5
Ashkan Hazegh Nikrou
4.33 (3)
描述 :  我们很高兴推出基于外汇市场 (PSAR) 中专业和流行指标之一的新免费指标 该指标是对原始抛物线 SAR 指标的新修改,在专业 SAR 指标中,您可以看到点和价格图表之间的交叉,这交叉不是信号,而是谈论运动结束的可能性,您可以从新的蓝点开始买入,并在第一个蓝点之前设置止损,最后您可以在点交叉价格图表时退出。 如何打开买入或卖出信号? 通过第一个蓝点打开买入交易并通过第一个红点打开卖出交易 正确的止损在哪里? 安全止损可以在第一个点上,(在第一个蓝点的买入情况下和在第一个红点的卖出情况下) 正确的止盈在哪里? 止盈可以根据止损距离和RR进行调整,所以我的建议是2 RR,是止损的2倍 如果我们盈利但仍未达到 tp,那么退出点在哪里? 第一个退出警报可以在点和价格图表之间交叉。 该指标何时释放警报? 一旦新的点出现在新的方向,指标就会释放警报 我们如何根据这个指标构建 EA 以及它的成本是多少? 我们已准备好通过一些强大的完整功能基于此免费指标构建指标,例如基于点的追踪止损和基于权益百分比的资金管理,您可以通过填写下表来订购 https://www.mql
FREE
PipFinite Exit EDGE MT5
Karlo Wilson Vendiola
4.87 (31)
Did You Have A Profitable Trade But Suddenly Reversed? In a solid strategy, exiting a trade is equally important as entering. Exit EDGE helps maximize your current trade profit and avoid turning winning trades to losers. Never Miss An Exit Signal Again Monitor all pairs and timeframes in just 1 chart www.mql5.com/en/blogs/post/726558 How To Trade You can close your open trades as soon as you receive a signal Close your Buy orders if you receive an Exit Buy Signal. Close your Sell orders if
Noize Absorption Index
Ekaterina Saltykova
Noize Absorption Index - is the manual trading system that measures the difference of pressure between bears forces and bulls forces. Green line - is a noize free index that showing curent situation. Zero value of index shows totally choppy/flat market.Values above zero level shows how powerfull bullish wave is and values below zero measures bearish forces.Up arrow appears on bearish market when it's ready to reverse, dn arrow appears on weak bullish market, as a result of reverse expectation.
CvdDeltaVolumes
Parasbhai N Patel
Delta + CVD & CVD Candles Order-flow indicator combining Delta (Ask–Bid), Cumulative Volume Delta (CVD), and a unique CVD-based synthetic candle system. Shows buy/sell pressure, volume aggressiveness, and momentum shifts with optional Delta histogram, CVD line, and CVD+Delta combined candles. Useful for scalping, intraday trading, divergence detection, and understanding buyer/seller dominance. Overview The Delta + CVD & CVD Candles Indicator combines multiple order-flow tools into one clean
Haven FVG Indicator
Maksim Tarutin
5 (8)
Haven FVG   指标是一款市场分析工具,可在图表上突出显示低效区域(公平价值缺口,FVG),为交易者提供关键水平,以便进行价格分析和交易决策。 其他产品 ->  点击这里 主要特点: 自定义颜色设置: 多头 FVG 颜色   (Bullish FVG Color)。 空头 FVG 颜色   (Bearish FVG Color)。 灵活的 FVG 可视化: FVG 搜索的最大蜡烛数量。 FVG 区域可额外延伸指定数量的 K 线。 可选启用 FVG 填充。 中线(Middle Line): 可选择线条颜色和样式(例如虚线)。 可调整线条厚度,以提高精确度。 通用设置: 将 FVG 扩展到当前 K 线。 排除历史 FVG,并填充突出当前数据。 一种简单而有效的方法,可分析图表上的低效区域,并做出明智的交易决策。
FREE
Value Chart Candlesticks
Flavio Javier Jarabeck
4.69 (13)
The idea of a Value Chart indicator was presented in the very good book I read back in 2020 , " Dynamic Trading Indicators: Winning with Value Charts and Price Action Profile ", from the authors Mark Helweg and David Stendahl. The idea is simple and the result is pure genius: Present candlestick Price analysis in a detrended way! HOW TO READ THIS INDICATOR Look for Overbought and Oversold levels. Of course, you will need to test the settings a lot to find the "correct" one for your approach. It
FREE
Mirror Chart MT5
Andrej Hermann
5 (1)
The Mirror Chart MT5 is a overlay indicator specifically designed to project a second financial instrument directly onto the main chart window. This tool is invaluable for traders who rely on correlation analysis, as it visualizes the price movements of two different instruments in real time. Unlike traditional overlays, this indicator utilizes intelligent, dynamic centering and scaling logic. It continuously analyzes the visible price range in the current window for both symbols and calculates
FREE
Advanced Fibonacci
Marius Ovidiu Sunzuiana
Fibonacci Advanced Indicator – Precision Meets Intelligence The Fibonacci Advanced Indicator is a cutting-edge technical analysis tool designed for traders who demand more than conventional retracement levels. Built on the foundational principles of Fibonacci mathematics, this indicator transcends tradition by integrating dynamic market behavior , multi-timeframe analysis , and adaptive algorithms to deliver high-probability trading zones with surgical accuracy. 1. Multiple Fibonacci Levels
Free automatic Fibonacci is an indicator that automatically plots a Fibonacci retracement based on the number of bars you select on the BarsToScan setting in the indicator. The Fibonacci is automatically updated in real time as new highest and lowest values appears amongst the selected bars. You can select which level values to be displayed in the indicator settings. You can also select the color of the levels thus enabling the trader to be able to attach the indicator several times with differe
FREE
PZ Penta O MT5
PZ TRADING SLU
3.5 (4)
The Penta-O is a 6-point retracement harmonacci pattern which usually precedes big market movements. Penta-O patterns can expand and repaint quite a bit. To make things easier this indicator implements a twist: it waits for a donchian breakout in the right direction before signaling the trade. The end result is an otherwise repainting indicator with a very reliable trading signal. The donchian breakout period is entered as an input. [ Installation Guide | Update Guide | Troubleshooting | FAQ | A
FREE
该产品的买家也购买
ARICoins
Temirlan Kdyrkhan
ARICoin is a powerful trading companion designed to generate high-probability entry signals with dynamic TP/SL/DP levels based on volatility. Built-in performance tracking shows win/loss stats, PP1/PP2 hits, and success rates all updated live. Key Features: Buy/Sell signals with adaptive volatility bands Real-time TP/SL/DP levels based on ATR Built-in MA Filter with optional ATR/StdDev volatility Performance stats panel (Success, Profit/Loss, PP1/PP2) Alerts via popup, sound, push, or email Cust
AriX
Temirlan Kdyrkhan
1 (4)
AriX Indicator for MT5 A powerful trend-following and signal-evaluation tool AriX is a custom MT5 indicator that combines Moving Averages and ATR-based risk/reward logic to generate clear buy/sell signals. It visualizes dynamic SL/TP levels, evaluates past trade outcomes, and displays win/loss statistics in a clean on-chart panel. Key features include: Buy/Sell signals based on MA crossovers ATR-based SL/TP1/TP2/TP3 levels with visual lines and labels Signal outcome tracking with real-time stat
购买此指标即可免费获得我的专业交易管理器。 首先,值得强调的是,这个交易系统是一个非重绘、非重画和非滞后的指标,这使得它非常适合手动和机器人交易。 在线课程,手册和下载预设。 “智能趋势交易系统 MT5”是专为新手和经验丰富的交易者量身定制的综合交易解决方案。它结合了超过 10 个优质指标,具有 7 多个强大的交易策略,使其成为适用于各种市场条件的多功能选择。 趋势跟随策略:提供精确的入场和止损管理,以有效地跟随趋势。 反转策略:识别潜在的趋势反转,使交易者能够利用区域市场的机会。 剃头策略:专为快速准确的日内交易和短期交易而设计。 稳定性:所有指标都不会重绘、不会重画和不会滞后,确保可靠的信号。 定制:支持自定义策略,以满足个人交易偏好。超过 7 种策略和组合可帮助您找到最佳策略。 信号清晰度:提供箭头信号,以指示清晰的入场和退出点。 实时警报:通过交易进出警报使交易者保持了解。 深入分析:提供更高时间框架的趋势分析和实时交易监控。 自适应颜色编码:利用蜡烛颜色编码来显示成交量、趋势和反转蜡烛信号。通过蜡烛颜色分析市场方向。 “智能趋势交易系统 MT5”赋予交易者必要的工具,以便在
Divergence Bomber
Ihor Otkydach
4.89 (83)
购买该指标的每位用户将额外免费获得以下内容: 原创工具“Bomber Utility”,该工具会自动跟踪每一笔交易,设置止损和止盈点,并根据策略规则自动平仓; 适用于不同交易品种的指标设置文件(Set 文件); 三种不同风险模式下的 Bomber Utility 设置文件:“最低风险”、“平衡风险” 和 “观望策略”; 一套详细的 视频操作手册,帮助您快速完成安装、配置并开始使用本交易系统。 注意: 要获取以上所有赠品,请通过 MQL5 的私人消息系统联系卖家。 我为您介绍原创的自定义指标 “Divergence Bomber”(背离轰炸机),它是一套基于 MACD 背离交易策略 的“全功能”交易系统。 该技术指标的主要任务是识别 价格与 MACD 指标之间的背离,并发出交易信号(包括推送通知),指示未来价格可能的运动方向。平均而言,这些信号的准确率超过 98%。有关该指标如何工作的详细说明,请观看本页面上的视频演示。 该系统使用 止损订单 和 动态回撤平仓机制 来管理交易。 Divergence Bomber 指标的主要特点: 支持交易的品种: AUDCAD、AUDCHF、AUDSG
FX Trend MT5 NG
Daniel Stein
5 (4)
FX Trend NG:新一代多市场趋势智能分析工具 概述 FX Trend NG 是一款专业的多时间周期趋势分析与市场监控工具,帮助您在几秒钟内全面了解市场结构。 无需在多个图表之间来回切换,您可以立即看到哪些品种处于趋势中、哪里动能正在减弱,以及哪些时间周期之间存在强烈共振。 限时发布优惠 – 仅需 $30(6个月) 或 $80 终身授权 即可拥有 FX Trend NG 。 已经是 Stein Investments 客户? -> 发送消息 以获取专属客户群访问权限。 需要帮助或安装指导? -> 请访问 Stein Investments 官方页面 。 1. FX Trend NG 的核心优势 三状态趋势逻辑 —— 不只是 Buy 或 Sell • 大多数指标仅显示两种状态:Buy 或 Sell。 • FX Trend NG 增加第三种状态: Fade 。 • Fade 表示趋势强度正在减弱,在完全反转之前提前发出信号。 这种结构化逻辑让您看到趋势变化过程,而不仅仅是简单方向信号。 多时间周期分析(M1 至 MN1) • 从短线交易到中长线交易全面覆盖。 • 快速识别趋势
Market Flow Pro
Gabriele Sabatino
4 (1)
Market Flow Pro Market Flow Pro is an intelligent trading advisor for the MetaTrader 5 platform, designed for automatic trading on financial markets using algorithmic analysis and strict risk management. -Key features: - Fully automatic trading 24/5 - Adaptive trend and momentum entry algorithm -  Built-in risk management - Flexible lot settings (fixed/auto-calculation) - Support for major currency pairs and indices - Optimised for operation on various timeframes  How it works Market
Entry In The Zone and SMC Multi Timeframe is a real-time market analysis tool developed based on Smart Money Concepts (SMC). It is designed to analyze market structure, price direction, reversal points, and key zones across multiple timeframes in a systematic way. The system displays Points of Interest (POI) and real-time No Repaint signals, with instant alerts when price reaches key zones or when signals occur within those zones. It functions as both an Indicator and a Signal System (2-in-1), c
Grabber System MT5
Ihor Otkydach
4.82 (22)
向您介绍一款优秀的技术指标——Grabber,它是一套即开即用的“全包式”交易策略。 在一个代码中集成了强大的市场技术分析工具、交易信号(箭头)、提醒功能和推送通知。 每位购买该指标的用户还可免费获得以下内容: Grabber辅助工具:用于自动管理已开仓位 视频操作指南:逐步教学如何安装、设置和使用该指标进行交易 原创Set文件:可快速自动配置,帮助实现最佳交易效果 忘掉其他策略吧!只有Grabber能够真正激励你在交易中攀登新高峰! Grabber策略的主要特点: 交易周期:从M5到H4 适用资产:任意,但我推荐我亲自测试过的品种(GBPUSD、GBPCAD、GBPCHF、AUDCAD、AUDUSD、AUDSGD、AUDCHF、NZDUSD、NZDCAD、EURCAD、EURUSD、EURAUD、EURGBP、EURCHF、USDCAD、USDSGD) 交易时间:全天候 24/7 交易效果:我分享自己的真实交易结果,并在此教学如何操作: https://www.mql5.com/ru/market/product/134563?source=Site+Market+MT5+Indic
Quantum TrendPulse
Bogdan Ion Puscasu
5 (22)
介绍 Quantum TrendPulse   ,这是一款终极交易工具,它将 SuperTrend   、   RSI 和 Stochastic 的强大功能整合到一个综合指标中,以最大限度地发挥您的交易潜力。该指标专为追求精准和效率的交易者而设计,可帮助您自信地识别市场趋势、动量变化以及最佳进入和退出点。 主要特点: 超级趋势整合: 轻松跟随当前的市场趋势并乘上盈利浪潮。 RSI 精度: 检测超买和超卖水平,非常适合把握市场逆转时机,可用作 SuperTrend 的过滤器 随机精度: 利用随机振荡在波动的市场中寻找隐藏的机会, 用作超级趋势的过滤器 多时间范围分析: 从 M5 到 H1 或 H4,在不同时间范围内关注市场动态。 可定制的警报: 当您的自定义交易条件得到满足时收到通知,这样您就不会错过任何交易。 无论您是新手还是经验丰富的交易员,   Quantum TrendPulse 都能为您提供所需的优势,帮助您增强策略并自信地进行交易。借助这一强大的指标,将洞察力转化为利润 — 掌控您的交易! ***购买 Quantum TrendPulse,即可免费获得 Quantum Tr
RFI levels PRO MT5
Roman Podpora
3.67 (3)
该指标能够准确显示反转点和价格回落区域。     行业领军人物 。您能洞察新趋势的形成,并以最高的精准度做出决策,掌控每一笔交易。 VERSION MT4     -    与……结合时,展现其最大潜力     趋势线专业版   指标 该指标显示的内容: 新趋势开始时的反转结构和反转水平及其激活。 显示屏   获利了结   和   止损   风险回报比最低的水平     RR 1:2       。 具有智能减值逻辑的止损。 显示指定指标中两种趋势类型的反转形态。 指标: 根据     趋势线     (全球趋势变化) 潮流专业版     (趋势快速变化) 简单有效   扫描器   实时趋势(新增)。 多时间框架工具筛选。 展示   利润   在 LOGIC AI 信号之后。 以下列出今日走势积极的金融工具。(RB键) 能够为终端启用通知(警报)功能,并向移动设备推送通知。 逻辑人工智能     — 利用人工智能寻找最佳切入点。 只有在启用 MTF(多时间框架分析)模式时,该功能才可用。 兼容性。 当与趋势线指标结合使用时,该指标能发挥其最大潜力。 这     RFI LEVELS
Atomic Analyst MT5
Issam Kassas
4.1 (29)
首先值得强调的是,该交易指标是非重绘、非延迟的指标,这使其成为手动和机器人交易的理想选择。 用户手册:设置、输入和策略。 Atomic Analyst是一种PA价格行动指标,利用价格的力量和动量来寻找市场上更好的机会。配备了高级过滤器,可帮助去除噪音和假信号,并提高交易潜力。使用多层复杂的指标,Atomic Analyst扫描图表,并将复杂的数学计算转化为任何初学者都能理解并用来做出一致交易决策的简单信号和颜色。 “Atomic Analyst”是专为新手和经验丰富的交易者量身定制的综合交易解决方案。它将高级指标和一流功能融合为一体的交易策略,使其成为所有类型交易者的多功能选择。 日内交易和剥头皮策略:专为快速准确的日内交易和短期交易而设计。 日内和摆动交易策略:可用作追求价格大幅波动的日内和摆动交易者的可靠工具。 多货币和市场:凭借其可靠的精度,在不同的工具和市场上运作。 多个时间框架:可在多个时间框架上使用,性能良好。 稳定性:所有指标均不重绘、不重绘和不滞后,确保可靠的信号。 信号清晰度:提供箭头信号,用于清晰的入场和出场点。 实时警报:通过交易入场、SL和TP警报通知交易者
Azimuth Pro
Ottaviano De Cicco
5 (4)
上市促销 Azimuth Pro 前100位买家特惠价 299 美元。最终价格为 499 美元。 散户与机构入场的区别不在于指标,而在于位置。 大多数交易者在任意价格水平入场,追逐动量或对滞后信号做出反应。机构投资者等待价格到达供需真正转换的结构性水平。 Azimuth Pro 自动映射这些水平:波段锚定VWAP、多时间框架结构线,以及仅在高概率位置出现的ABC形态。 Azimuth Pro 专为需要结构分析和智能自动化的专业交易者打造。 Azimuth 以外科手术般的精度映射市场结构,而Azimuth Pro增加了智能层:自动检测您的交易风格、智能配置的移动平均线,以及经过20年数据回测优化的参数。结果是专业级分析自动适应您的交易品种和时间框架。 这是我们Merkava Labs每天为自己和客户使用的指标。 PRO版本的独特之处 智能配置 Pro版本理解您的交易环境。将它放在EURUSD M15上,它知道您在做日内交易。放在BTCUSD H4上,它会调整为波段交易。无需手动调整。 自适应移动平均线 标准EMA有效。但ATR自适应StepMA(响应波动率)和动
Entry Points Pro for MT5
Yury Orlov
4.48 (138)
这款指标用于 MT5,可提供准确的入场交易信号,且无重绘。 它可应用在任何金融资产:外汇、加密货币、贵金属、股票、指数。 它将提供极其精准的评估,并告诉您何时开仓和平仓的最佳时机。 观看 视频 (6:22),其中包含一个仅处理单一信号的示例,该信号即可值回指标购价! 大多数交易者在 Entry Points Pro 指标的帮助下,在第一个交易周内即改善了他们的交易结果。 订阅我们的 Telegram 群 ! Entry Points Pro 指标的益处。 入场信号无重绘 如果信号出现,并得到确认,则它不会再消失;不像是重绘指标,它会导致重大的财产损失,因为它们可以在显示信号后再将其删除。 无差错开仓 指标算法可令您找到入场交易(买入或卖出资产)的理想时机,从而提高每位交易者的成功率。 Entry Points Pro 可操作任何资产 它允许您在 MT5 平台上交易任何经纪商的加密货币、股票、贵金属、指数、大宗商品和货币。 提供任何方向的信号 Entry Points Pro 指标提供针对任意价格走势的入场交易信号 - 上涨、下跌或横盘(横向)。 最大盈利潜力 离场信号
FX Power MT5 NG
Daniel Stein
5 (31)
FX Power:分析货币强度,助您做出更明智的交易决策 概述 FX Power 是一款专业工具,帮助您全面了解主要货币和黄金在任何市场条件下的真实强度。通过识别强势货币用于买入,弱势货币用于卖出, FX Power 简化了交易决策,并帮助您发现高概率的交易机会。不论您是想跟随趋势还是通过极端的 Delta 值预测反转,这款工具都能完美适应您的交易风格。别再盲目交易——用 FX Power 让您的交易更加智慧。 1. 为什么 FX Power 对交易者极具价值 实时货币和黄金强度分析 • FX Power 实时计算并显示主要货币和黄金的相对强度,助您全面了解市场动态。 • 监控领先或落后资产,轻松识别值得交易的货币对。 全面的多时间框架视图 • 跟踪短期、中期和长期时间框架的货币和黄金强度,以便将您的交易策略与市场趋势保持一致。 • 无论是快进快出的短线交易还是更长期的投资策略, FX Power 都能为您提供所需的信息。 Delta 动态分析用于趋势和反转 • 极端 Delta 值常常预示反转机会,而平缓的 Delta 变化则确认趋势延续。 • 使用 Delta 分析,轻
Trend indicator AI mt5
Ramil Minniakhmetov
5 (15)
趋势人工智能指标是一个伟大的工具,将加强交易者的市场分析结合趋势识别与可操作的进入点和逆转警报。 该指标使用户能够自信和精确地驾驭外汇市场的复杂性 除了主要信号,趋势Ai指标识别在回调或回调期间出现的次要入口点,使交易者能够利用既定趋势内的价格修正。 重要优势: *MT4及MT5工程 *明确买入或卖出信号 ·不重绘 *适用于所有资产 小心我不卖EA或设置电报它骗局. 所有设置免费在这里的博客。  重要! 购买后立即与我联系,以获得指示和奖金! 真实的操作监控以及我的其他产品可以在这里找到: https://www.mql5.com/en/users/mechanic/seller&nbsp ; 设置和输入: 建议为所有资源设置默认设置。 第...
Trend Lines PRO MT5
Roman Podpora
5 (1)
趋势线专业版 -     有助于了解市场真正转变的方向。该指标显示了真正的趋势反转点以及主要参与者重新入场的点位。 你看     BOS线路   无需复杂设置或不必要的干扰,即可在高时间框架内显示趋势变化和关键水平。信号不会重绘,并在K线收盘后仍保留在图表上。 MT4 版本   - 与 RFI LEVELS PRO 指示器结合使用时,可发挥其最大潜力 该指标显示的内容: 真正的转变   趋势线(BOS线) 一旦信号出现,它就始终有效!这与会重绘的指标有着重要的区别,后者可能会发出信号后又改变信号,从而导致资金损失。现在,您可以更精准、更准确地进入市场。此外,还有一个功能:在箭头出现后,K线会着色,直到达到目标价位(止盈)或出现反转信号为止。 重复条目   以及主要玩家的充值 为了提高寻找入场点时的视觉清晰度,我们创建了一个模块,该模块首先显示买入/卖出区域,并在该区域内寻找最佳入场点。此外,我们还加入了智能逻辑来管理止损位,该逻辑会随着时间的推移逐步降低止损位的大小,从而降低入场时的初始风险( 移动止损位 )。 信号强度水平     (BOS) 该指标采用三个显著性等级来衡量趋势变化
RelicusRoad Pro MT5
Relicus LLC
5 (24)
RelicusRoad Pro: 量化市场操作系统 终身访问限时 70% 折扣 - 加入 2,000+ 交易员社区 为什么大多数交易者即使拥有“完美”指标也会失败? 因为他们在真空中交易 单一概念 。没有背景的信号是赌博。要持续获胜,您需要 共振 (CONFLUENCE) 。 RelicusRoad Pro 不是一个简单的箭头指标。它是一个完整的 量化市场生态系统 。它描绘价格运行的“公允价值之路”,区分市场噪音和真实的结构性突破。 停止猜测。开始用机构级“路”逻辑进行交易。 核心引擎:“Road” (路) 算法 系统的核心是 Road Algo ,一个实时适应市场条件的动态波动率通道。它投射出 安全线 (平衡) 和价格可能反转的 扩展水平 。 Simple Road: 典型市场的标准结构映射。 Smooth Road: 针对震荡盘整的降噪计算。 Breakout Road: 专为识别波动率扩张和爆发性走势而调整。 1. 算法动量与确认 我们的“剥头皮箭头”不只是简单的交叉。它们利用 高阶多项式逻辑 过滤噪音,确保信号与主周期一致。我们检测动量、价格行为和 Road 结构汇聚的精确入场
Candle Smart Range
Gianny Alexander Lugo Sanchez
Candle Smart Range (CSR) MetaTrader 5 指标 Candle Smart Range 是一款用于自动识别多时段价格区间的技术指标。该工具基于蜡烛形态以及价格与先前高低点的交互来分析市场结构。 主要功能: 区间检测: 自动识别脉冲行情前的盘整区域。 虚假突破识别: 根据蜡烛收盘标准,标记价格突破先前水平但收于区间内的情况。 多时段分析: 在单个图表上显示多达 19 个不同时段的数据,包括自定义周期。 内部可视化(缩放): 无需切换图表即可查看高级别蜡烛或区间内部的价格走势。 时间过滤器: 可设置在特定时间段(如主要市场交易时段)运行。 历史回顾模式: 逐步浏览历史数据,分析指标在不同市场条件下的表现。 警报系统: 针对蜡烛收盘和新区间检测的可配置通知。 界面: 包含用于管理视觉负载的屏幕按钮和可调配色方案。 免责声明: 本工具仅用于视觉分析,不保证财务结果。历史表现不代表未来收益。
ARIPoint
Temirlan Kdyrkhan
ARIPoint is a powerful trading companion designed to generate high-probability entry signals with dynamic TP/SL/DP levels based on volatility. Built-in performance tracking shows win/loss stats, PP1/PP2 hits, and success rates all updated live. Key Features: Buy/Sell signals with adaptive volatility bands Real-time TP/SL/DP levels based on ATR Built-in MA Filter with optional ATR/StdDev volatility Performance stats panel (Success, Profit/Loss, PP1/PP2) Alerts via popup, sound, push, or email Cu
介绍     Quantum Breakout PRO   ,突破性的 MQL5 指标,正在改变您交易突破区域的方式!由拥有超过13年交易经验的资深交易员团队开发,     量子突破 PRO     旨在通过其创新和动态的突破区域策略将您的交易之旅推向新的高度。 量子突破指标将为您提供带有 5 个利润目标区域的突破区域的信号箭头,以及基于突破框的止损建议。 它既适合新手交易者,也适合专业交易者。 量子 EA 通道:       点击这里 重要的!购买后请私信我领取安装手册。 建议: 时间范围:M15 货币对:GBPJPY、EURJPY、USDJPY、NZDUSD、XAUUSD 账户类型:ECN、Raw 或 Razor,点差极低 经纪商时间:GMT +3 经纪商:IC Markets、Pepperstone with Raw 和 Razor 的点差最低 规格: 不重漆! 最多 5 个建议利润目标区域 建议止损水平 可定制的盒子。您可以设置自己的 Box Time Start 和 Box Time End。 接触 如果您有任何疑问或需要帮助,请通过私人消息与我联系。
Mirage Trading System — False Breakout (Fakey) Pattern Detector for MetaTrader 5 MANUAL   ,   MQL5 Channel LIVE SIGNALS : CLICK HERE Buy any indicator and get a FREE bonus indicator Phantom trading System, SMC retest Trading system, GOLD SCALP System! Send me a private message for details. Overview   Mirage Trading System detects the Fakey pattern (false breakout reversal) on completed bars and draws entry, stop loss, and take profit levels on the chart. Detection is non-repainting: signal valu
CGE Trading Suite
Carl Gustav Johan Ekstrom
5 (1)
CGE Trading Suite delivers the analytical edge typically reserved for professional trading desks. The platform integrates a full suite of analytical tools into one seamless workflow: dynamic grid mapping, liquidity behavior analysis, ECM, trend lines, MIDAS, trade cycles, and directional channel projections. Together, these provide a unified view of market structure and momentum. Directional clarity is further enhanced by the capital flow index, which measures currency basket strength to identif
TPSproTREND PrO MT5
Roman Podpora
4.74 (19)
TPSproTrend PRO 能够识别市场真正改变方向的时刻,并在行情开始时形成入场点。 你应该在价格刚刚开始波动时入场,而不是在波动已经发生之后。 指标   它不会重新绘制信号,并自动显示入场点、止损点和止盈点,使交易清晰、直观、有条理。 俄语说明 -   MT4 版本 主要优势 信号不重绘。 所有信号均为固定值。 如果出现箭头 -     它不会再改变也不会消失了。 您可以基于稳定的数据做出交易决策,而无需承担虚假信号的风险。 现成的买卖入场点 该指标会自动确定最佳交易时机,并在图表上用箭头显示出来。 无需猜测或主观分析——只有清晰的信号。 自动止损和止盈区域 信号发出后,您立即会看到: 入口点 风险限制区(止损) 止盈区 这允许   在达成交易前评估交易条款   并遵守风险管理规定。 自适应止损(移动止损) 该指标采用智能交易支持逻辑,随着时间的推移……     降低止损规模,从而降低初始风险。 支持更高时间框架(MTF) TPSproTrend PRO 显示: 来自更高时间框架的关键 MIN/MAX 修正 实际趋势变化 修正编号显示了运动的结构 交易很有帮助   顺应大
Matrix Arrow Indicator MT5
Juvenille Emperor Limited
5 (18)
矩阵箭头指标 MT5   是一种独特的 10 合 1 趋势,遵循   100% 非重绘多时间框架指标 ,可用于所有符号/工具: 外汇 、 商品 、 加密货币 、 指数 、 股票 。 Matrix Arrow Indicator MT5 将在其早期阶段确定当前趋势,从多达 10 个标准指标中收集信息和数据,它们是: 平均定向运动指数 (ADX) 商品渠道指数 (CCI) 经典 Heiken Ashi 蜡烛 移动平均线 移动平均收敛散度 (MACD) 相对活力指数 (RVI) 相对强弱指数 (RSI) 抛物线SAR 随机振荡器 威廉姆斯的百分比范围 当所有指标给出有效的买入或卖出信号时,相应的箭头将打印在图表上,在下一根蜡烛/柱线开盘时,指示强劲的上升趋势/下降趋势。用户可以选择使用哪些指标,并可以单独调整每个指标的参数。 Matrix Arrow Indicator MT5 仅从选定的指标中收集信息,并仅根据其数据打印箭头。   Matrix Arrow Indicator MT5   还可以为所有新信号发送终端、推送通知或电子邮件警报。无论您是黄牛、日内交易者还是波段交易者, Mat
Trend Forecaster
Alexey Minkov
5 (7)
The Trend Forecaster indicator utilizes a unique proprietary algorithm to determine entry points for a breakout trading strategy. The indicator identifies price clusters, analyzes price movement near levels, and provides a signal when the price breaks through a level. The Trend Forecaster indicator is suitable for all financial assets, including currencies (Forex), metals, stocks, indices, and cryptocurrencies. You can also adjust the indicator to work on any time frames, although it is recommen
Bill Williams Advanced
Siarhei Vashchylka
5 (10)
Bill Williams Advanced is designed for automatic chart analysis using Bill Williams' "Profitunity" system. The indicator analyzes four timeframes at once. Manual (Be sure to read before purchasing) Advantages 1. Analyzes the chart using Bill Williams' "Profitunity" system. Signals are displayed in a table in the corner of the screen and on the price chart. 2. Finds all known AO and AC signals, as well as zone signals. Equipped with a trend filter based on the Alligator. 3. Finds "Divergence Bar
“ Dynamic Scalper System MT5 ”指标专为在趋势波内进行剥头皮交易而设计。 已在主要货币对和黄金上进行测试,并可与其他交易工具兼容。 提供顺势短线建仓信号,并提供额外的价格变动支持。 指标原理: 大箭头决定趋势方向。 在趋势波内,我们采用一种生成小箭头形式的剥头皮交易信号的算法。 红色箭头代表看涨方向,蓝色箭头代表看跌方向。 敏感的价格变动线会沿着趋势方向绘制,并与小箭头信号协同作用。 信号运作方式如下:当线在适当时刻出现时,将形成入场信号;在出现线时,持仓;线完成后,平仓。 建议的操作时间范围为M1 - H4。 箭头在当前K线上方形成,如果下一根K线已开仓,则不会重新绘制上一根K线上方的箭头。 输入参数 Trend Wave Period - 趋势方向(大箭头)的周期,改变趋势波的时间间隔。值 1 表示趋势方向的最长持续时间,参数值越大,持续时间越短。 Scalper Arrows Period - 信号箭头(小箭头)的计算周期,改变入场信号的生成频率。值 3 表示最频繁的生成频率,参数值越大,箭头频率越低,准确度越高。 这些参数可以根据不同
Advanced Currency Strength28 MT5
Bernhard Schweigert
5 (3)
任何新手或专家交易者的最佳解决方案! 这个指标是一个独特的、高质量的、可负担得起的交易工具,因为我们纳入了一些专有的功能和一个新的公式。只需一个图表,你就可以读出28个外汇对的货币强度!想象一下,你的交易将如何得到改善,因为你的交易是在你的手中进行的。想象一下,你的交易将如何改善,因为你能够准确地确定新趋势或剥头皮机会的触发点? 用户手册:点击这里  https://www.mql5.com/en/blogs/post/697384 这是第一本,原版的! 不要买一个毫无价值的崇拜者的克隆品。 特别的 子窗口中的箭头显示强劲的货币势头GAP将指导你的交易! 当基础货币或报价货币处于超卖/超买区域(外盘斐波那契水平)时,在个人图表的主窗口中出现警告信号。 当货币力量从外围区间回落时,回撤/反转警报。 十字星模式的特别警报 可选择多个时间框架,以快速查看趋势! 货币强度线在所有的时间框架中都非常平稳,当使用较高的时间框架来识别总体趋势,然后使用较短的时间框架来确定精确的入口时,效果非常好。你可以根据自己的意愿选择任何时间框架。每个时间框架都由其自身进行了优化。 建立在新的基础算法
Gold Sniper Scalper Pro
Ich Khiem Nguyen
3.78 (9)
Gold Sniper Scalper Pro — False Breakout Detector with Gold-Specific Filters for MetaTrader 5 MANUAL   ,   MQL5 Channel Buy any indicator and get a FREE bonus indicator Phantom trading System, SMC retest Trading system, Mirage Trading  System! Send me a private message for details. Overview   Gold Sniper Scalper Pro detects the Fakey pattern (false breakout reversal) on completed bars and applies three additional validation layers designed for XAUUSD characteristics: a 7-timeframe trend consens
MetaBands M5
Vahidreza Heidar Gholami
4.5 (2)
MetaBands使用强大且独特的算法绘制通道并检测趋势,以便为交易者提供进出交易的潜在点。它是一个通道指标和强大的趋势指标。它包括不同类型的通道,可以通过使用输入参数简单地合并以创建新通道。MetaBands使用所有类型的警报通知用户市场事件。 功能 支持大多数通道算法 强大的趋势检测算法 能够合并不同类型的通道 多时间帧和多货币(信号矩阵) 所有类型的警报功能(声音、屏幕闪烁、推送通知、电子邮件、弹出窗口、箭头) 它永远不会重绘 趋势检测 MetaBands使用在通道内振荡的蓝色线来检测趋势。当该线遇到通道的上界时,表明开始下跌趋势,当它遇到下界时,表明开始上涨趋势。如果蓝线接近中线,则市场处于整理期。 该指标使用独特的方法来检测趋势。一开始可能看起来有些复杂,但如果您观看视频教程,您就会意识到它是多么强大且易于使用。 入场和出场信号 当趋势变化或价格穿过上下通道时,MetaBands会立即通过不同的方法提醒交易者,这些方法可以在指标设置中启用。 信号矩阵 要监视来自不同时间框架的多个符号并在一个地方查看信号,请单击右上角按钮或按键盘上的M键以打开信号矩阵。该矩阵可以快速概览
作者的更多信息
FVG Metrics
Kim Raphael Reitz
5 (1)
FVG Indicator (Current Timeframe Zones + MTF Count Panel) This indicator detects and draws Fair Value Gap (FVG) zones on the current chart timeframe only . It also includes a multi-timeframe panel that shows how many active (unmitigated) FVG zones exist on selected timeframes. What it does Draws bullish and bearish FVG zones from the chart timeframe you are viewing Tracks zone status (active or mitigated) Displays an MTF panel with counts for multiple timeframes Current timeframe zones only Th
FREE
筛选:
无评论
回复评论