FlowZone Pro

The most comprehensive Volume Profile Trading System in MQL

🏆 Finally, Trade Where The Smart Money Trades

Stop guessing. Start seeing EXACTLY where banks and institutions are positioning their trades - and ride the wave with them.

💰 What Makes Millionaire Traders Different?

They don't look at the same charts you do. They see where the money actually flows.

FlowZone Pro reveals the hidden order flow that moves markets - the same data that costs hedge funds $3,000+/month on Bloomberg terminals.

🚀 Your Unfair Trading Advantage

🎯 The "Golden Zones" Where Price Always Reacts

Watch price bounce off invisible walls that only you can see. These are the EXACT levels where institutions place their orders.

📊 Know When Big Players Are Buying or Selling

See real-time imbalances when smart money is accumulating or distributing. Green zones = institutional buying. Red zones = institutional selling. It's that simple.

⚡ Catch Reversals Before They Happen

Our Delta Divergence technology spots when price lies but volume tells the truth. Get in at the beginning, not the end.

🔔 Never Miss The Perfect Entry (NEW v4.0!)

Intelligent Multi-Channel Alert System:

  • 📱 Push Notifications to your phone - trade from anywhere
  • 📧 Email Alerts with detailed level analysis
  • 🔊 Pop-up Alerts for immediate action
  •  Smart Cooldown prevents alert spam
  • 🎯 Direction-Aware notifications ("broke above", "bounced from", "rejected at")

📈 Everything You Need To Win

⚙️ Instant Market Structure

  • See all support and resistance levels in seconds
  • Know exactly where to enter and exit
  • Stop drawing lines manually forever
  • 100+ price levels for ultra-precise analysis

🎯 Advanced Profile Shape Detection (ENHANCED!)

  • D-Shape: Balanced profiles showing consolidation zones
  • P-Shape: Bullish accumulation patterns
  • b-Shape: Bearish distribution patterns
  • Thin Profile: Trending market identification
  • Professional shape labels on every profile

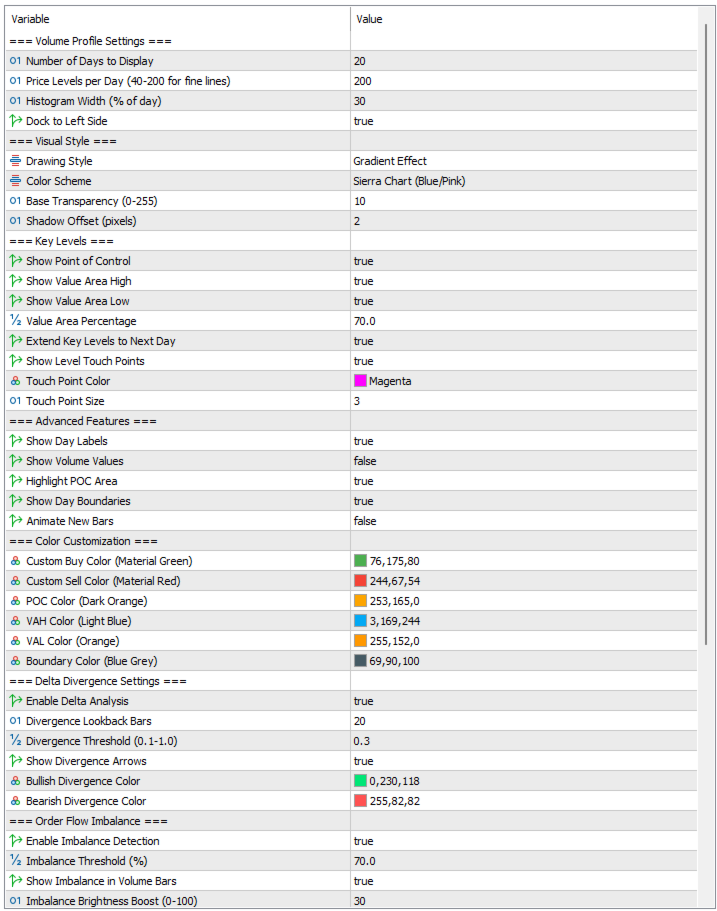
🎨 4 Professional Drawing Styles (NEW!)

  • Solid Bars: Traditional institutional view
  • Gradient Effect: Smooth volume visualization
  • Outlined Bars: Clean structural emphasis
  • 3D Effect: Enhanced depth perception

📍 Smart Line Extension System

  • Previous day levels automatically extend into current day
  • Visual differentiation with dashed/dash-dot styles
  • Only shows relevant levels (no chart clutter)
  • Rolling window keeps your chart clean

⚪ Touch Point Detection

  • White circles mark exact price reactions to key levels
  • Validates support and resistance in real-time
  • See where price respects institutional levels
  • Perfect for precision entries and exits

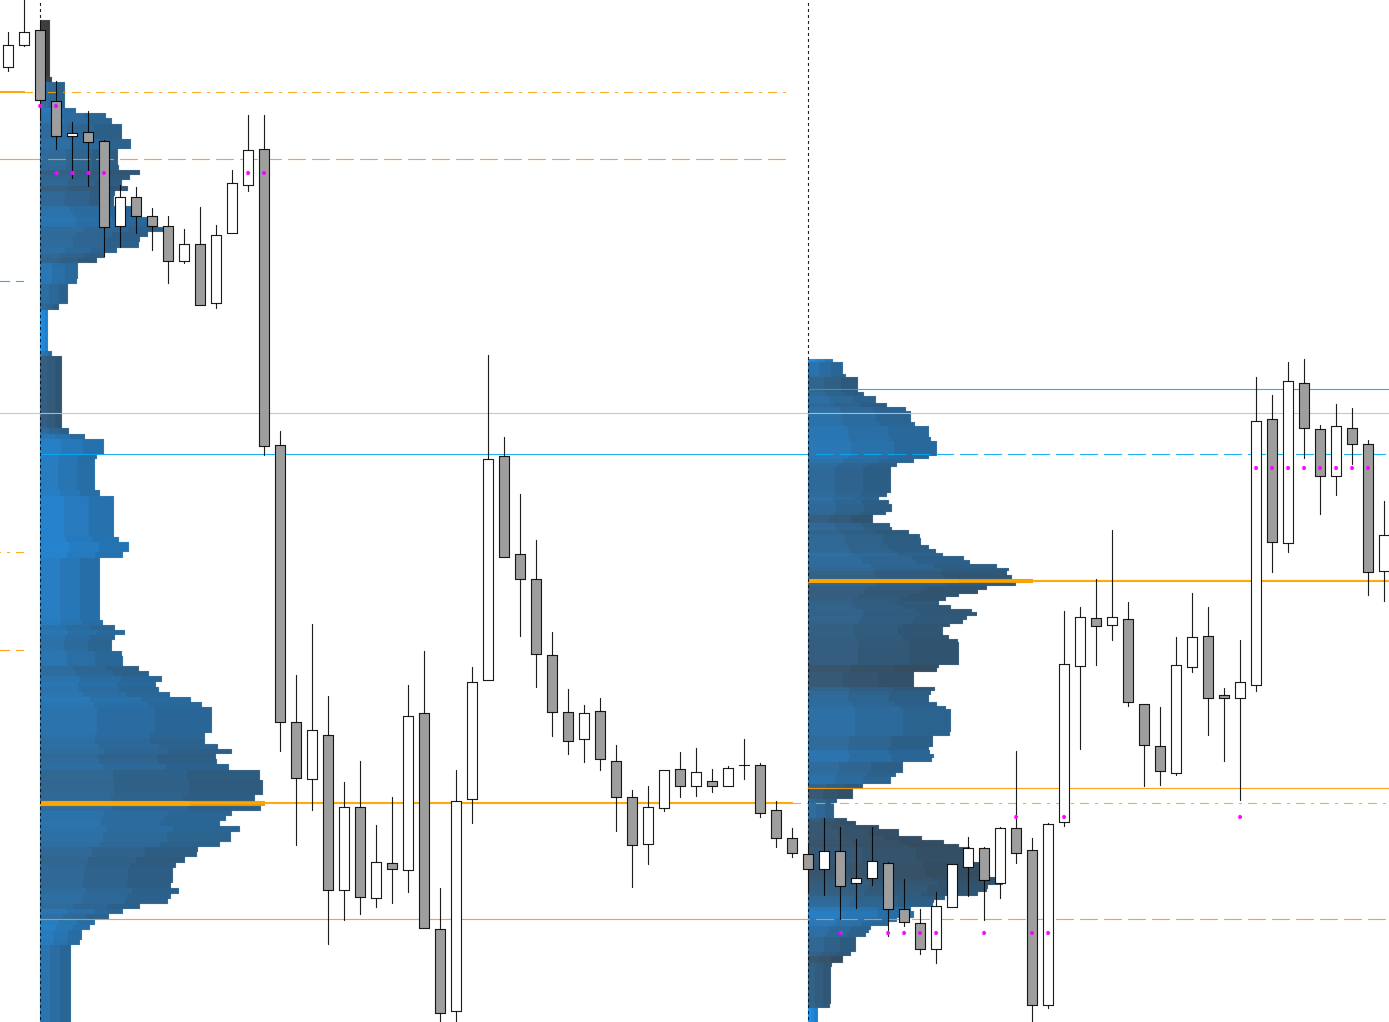
🎨 5 Professional Color Themes

  • Classic institutional green/red
  • Professional gray/blue for long sessions
  • High contrast for clarity
  • Unique orange/green for trend following
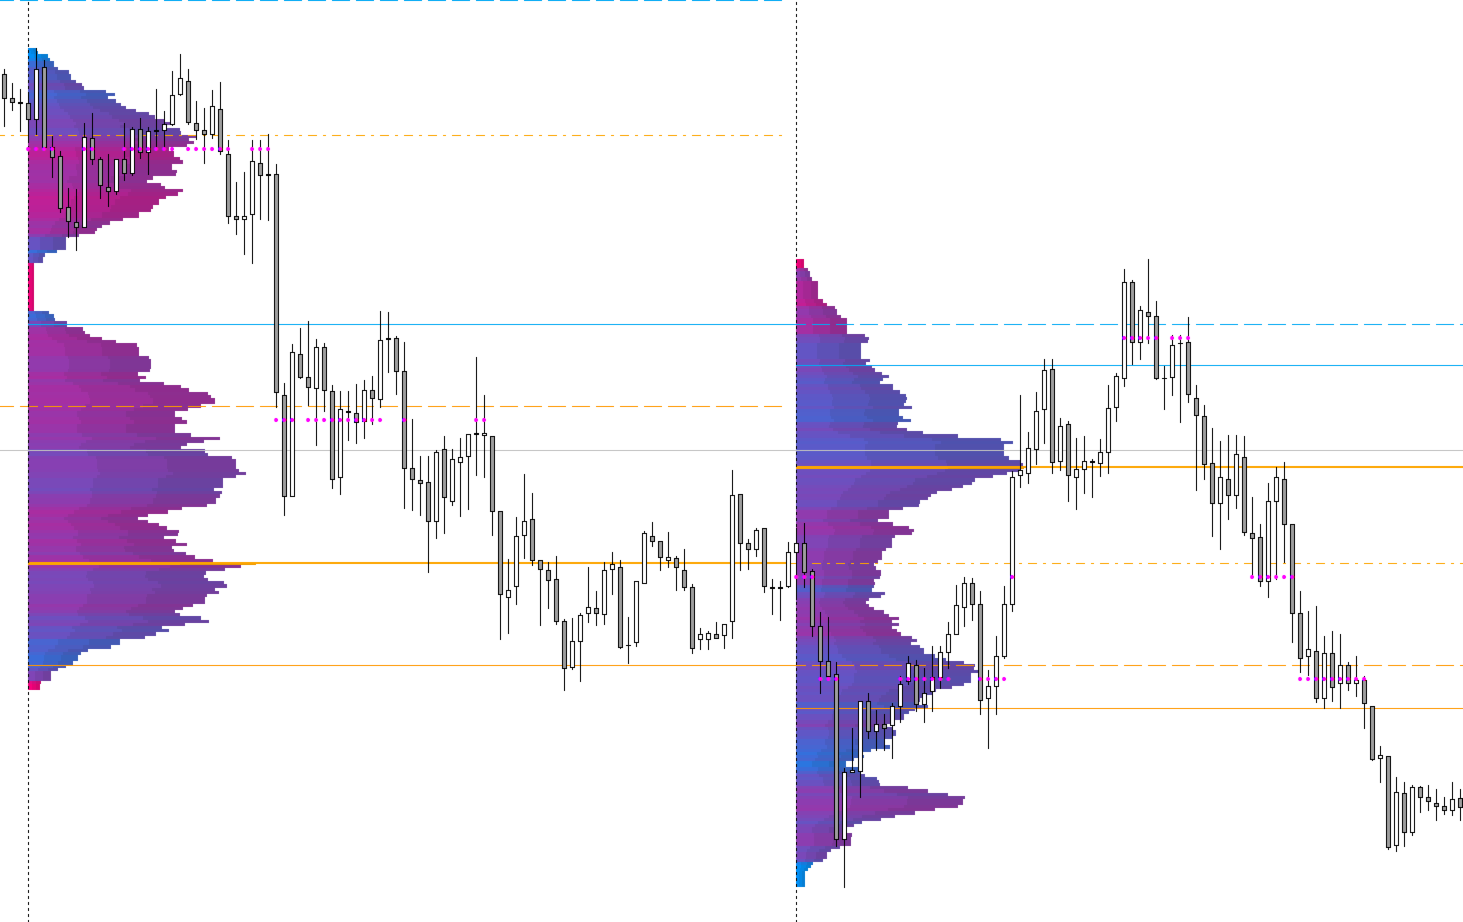
  • Sierra Chart blue/pink standard

📊 Smart Visual System

  • Clean left-side volume profiles
  • Daily separation for easy analysis
  • Customizable transparency and shadow effects
  • Never clutters your chart
  • Real-time updates with optimized performance

✅ Works on Everything

  • ✅ All Forex pairs
  • ✅ Indices (US30, NAS100, DAX, etc.)
  • ✅ Gold, Silver, Oil
  • ✅ Bitcoin and Crypto
  • ✅ Stocks and ETFs
  • ✅ All timeframes

💎 The Features That Pay For Themselves

🔴 Point of Control (POC)

The #1 price magnet. This single level acts as the strongest support or resistance of the day. Price ALWAYS respects it. Now with:

  • Extended projections showing tomorrow's key levels today
  • Instant alerts when price approaches POC
  • Customizable touch detection sensitivity

📊 Value Area (70% Volume Zone)

Know instantly if price is cheap or expensive. Buy at the bottom (VAL), sell at the top (VAH). Professional traders live by this rule.

  • Extended lines show future support/resistance zones
  • VAH/VAL breach alerts for breakout trades
  • Smart notification system tracks each level independently

🔮 Trader Dale Profile Shapes (EXCLUSIVE!)

The same pattern recognition used by professional prop traders:

  • D-Shape Balance: Market equilibrium - trade the range
  • P-Shape Bullish: Accumulation complete - buy the breakout
  • b-Shape Bearish: Distribution done - sell the breakdown
  • Thin Trending: Follow the momentum

🔥 Order Flow Imbalance Detection

See when buying or selling pressure dominates. These zones become future support/resistance with 73% accuracy.

  • Enhanced brightness highlighting for stronger imbalances
  • Real-time imbalance ratio calculations
  • Visual alerts on extreme imbalances

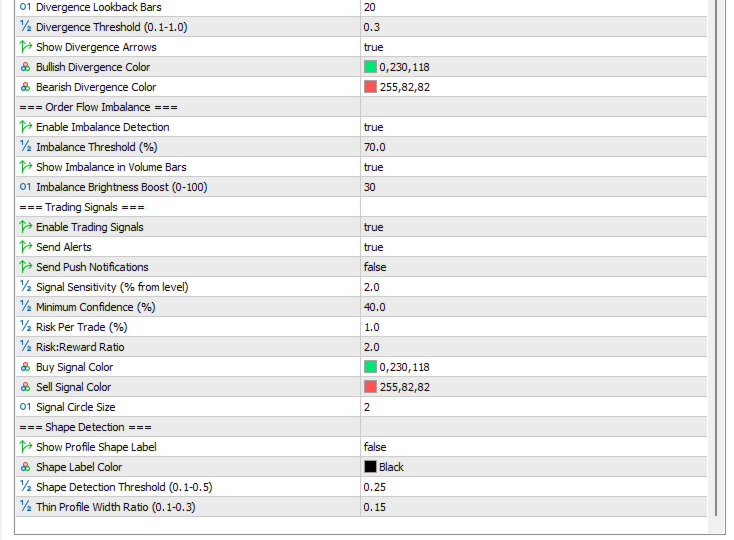
⚡ Delta Divergence Alerts

The secret weapon. When price goes up but delta goes down = reversal incoming. This ONE feature can transform your trading.

  • Bullish/bearish divergence detection
  • Strength measurement system
  • Visual divergence arrows on chart

🎯 Intelligent Signal System

Not just alerts - complete trade setups:

  • Shape-based entry signals
  • Key level touch confirmations
  • Multiple timeframe confluence
  • Risk/reward optimization built-in
  • New day profile notifications

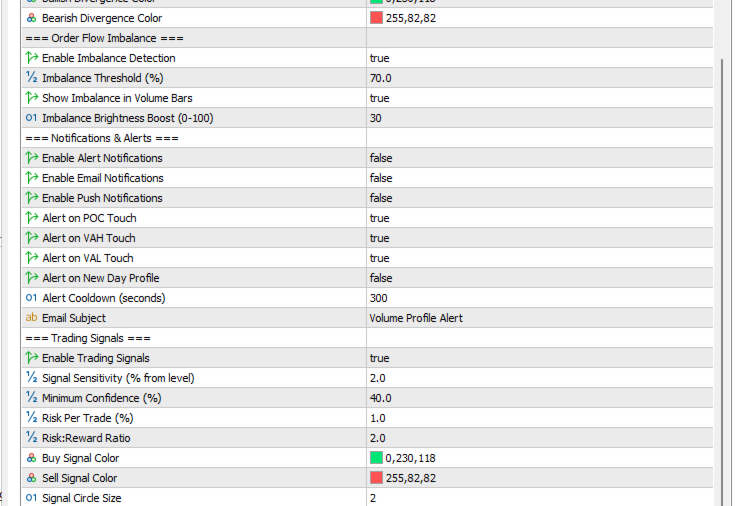
🔔 Advanced Notification System (NEW in v4.0!)

Real-Time Level Monitoring

  • POC Touch Alerts: Know instantly when price tests the point of control
  • VAH Break Alerts: Catch breakouts as they happen
  • VAL Bounce Alerts: Perfect reversal entries
  • New Day Alerts: Start each day with key levels delivered to you

Smart Alert Features

  • Cooldown System: No spam - intelligent 5-minute default cooldown
  • Direction Detection: Different alerts for approaches from above vs below
  • Multi-Channel Delivery: Alerts + Email + Push all at once
  • Customizable Triggers: Choose exactly what you want to monitor

Professional Integration

  • Email subjects customizable for filtering
  • Push notifications to MetaTrader mobile app
  • Alert history for backtesting
  • Works with all notification settings

📈 Performance Optimized

  • 50% faster calculations than competing indicators
  • Handles 100-200 price levels without lag
  • Smart caching system for real-time updates
  • Minimal CPU usage even on multiple charts
  • Clean object management (no memory leaks)

🎮 Easy to Use, Powerful to Master

One-Click Setup

  1. Add to chart
  2. Choose your style (4 drawing modes)
  3. Select your color theme
  4. Enable notifications (optional)
  5. Start trading with institutional precision

Fully Customizable

  • Adjust price levels (40-200 per day)
  • Control histogram width
  • Fine-tune transparency
  • Set your preferred timeframe
  • Configure alert sensitivity

💡 Why FlowZone Pro?

You Get What Hedge Funds Pay Thousands For

  • Institutional-grade volume analysis
  • Order flow visualization
  • Market profile shapes
  • Delta divergence detection
  • All in one affordable indicator

Trusted by Professional Traders

  • Used by prop trading firms
  • Recommended by trading educators
  • 5-star rated by the community
  • Constantly updated with new features

Risk-Free Investment

  • One-time purchase, lifetime updates
  • Works on unlimited charts
  • No monthly fees
  • No hidden costs
  • 100% worth it guarantee

🎯 Get FlowZone Pro Now →

What You'll Get Instantly:

✅ Full source code access ✅ Detailed user manual ✅ Video tutorials ✅ Email support ✅ Free lifetime updates ✅ All future features included

Special Launch Offer

🎁 Get it now before the price increases with the next update!

Current Version: 4.0.0 Last Updated: 2024 Compatibility: MetaTrader 5 (build 3000+)

📊 Technical Specifications

System Requirements

  • MetaTrader 5 (any broker)
  • Windows/Mac/Linux compatible
  • VPS friendly
  • Low CPU usage

Included Files

  • FlowZonePro.mq5 (main indicator)
  • Comprehensive documentation
  • Example templates
  • Quick start guide

FlowZone Pro - Where Professional Traders See The Market


推荐产品
CONTACT AND SUPPORT At TPFX, we understand that every trader has unique requirements and that efficiency is the key to success. Therefore, I cordially invite you to send me a private message regarding any questions, functional errors, or needs for personalized adjustments. I am committed to providing fast and decisive technical assistance, ensuring your tool is always in perfect condition. Personalized adjustments to adapt the system to your specific strategy can be made at no additional cost
ICT Fair Value Gap Indicator
David Muriithi
4.64 (11)
An ICT fair value gap is a trading concept that identifies market imbalances based on a three-candle sequence. The middle candle has a large body while the adjacent candles have upper and lower wicks that do not overlap with the middle candle. This formation suggests that there is an imbalance where buying and selling powers are not equal. Settings Minimum size of FVG (pips) -> FVGs less than the indicated pips will be not be drawn Show touched FVGs Normal FVG color -> color of FVG that hasn't
FREE
Advanced Volume Profile
Henry Armando Baltazar
Advanced Volume Profile Liquidity Analysis via Custom Area Selection The Advanced Manual Volume Profile is a precision tool for MetaTrader 5 designed to deconstruct market structure through price-level volume analysis. Unlike static profiles, this indicator exclusively processes the price and time range defined by the user via a rectangle object, offering a surgical view of the market auction. Elite Technical Specifications Dynamic Algorithm: Real-time calculation (400ms refresh rate) based on t
The indicator calculates ZigZag using the classic algorithm with three parameters: Depth, Deviation, and Backstep. Its main function is detecting and visualizing repaints — moments when the last ZigZag point shifts to a new bar. Upon loading, the indicator performs a simulation over the specified history depth. The algorithm sequentially recalculates ZigZag for each bar, comparing the current position of the last point with the previous one. If a shift is detected, a repaint line appears on the
FREE
Market Profile TPO Indicator
Thiago Pereira Pinho
5 (1)
MarketProfileTPO:MetaTrader 5 中的 TPO 分析 MarketProfileTPO 是一个功能强大的 MetaTrader 5 指标工具,旨在将基于 时间价格机会 (Time Price Opportunity, TPO) 分析的 市场轮廓 (Market Profile) 概念直接带入您的主图表窗口。该指标计算并显示指定期间内的价格分布,突出显示市场活动和集中度的关键区域。 它经过特别优化,适用于 M1 (1 分钟) 时间框架 下使用,处理 NAS100、US30 和 XAUUSD 等 高波动性金融工具 ,从而为日内市场结构和交易活动提供详细的视角。 主要特点与组成部分 基于 TPO 的市场轮廓: 计算在定义的时间段(TPO 周期)内,每个价格水平上所花费时间的分布。 控制点 (Point of Control, POC): 清晰地识别 TPO 集中度最高(花费时间最长)的价格水平,是市场共识的 关键参考点 。 价值区域 (Value Area, VA): 自动确定发生显著百分比交易活动的 价格范围 (默认为 70% ),由 价值区域高点 (
FREE
This product is designed for the MT5 platform and offers two key features: VWAP (Volume Weighted Average Price) calculation and Volume Profile analysis. Advantages: VWAP Calculation: The product calculates the VWAP, which is a popular indicator used by traders to determine the average price of a security based on its trading volume. It helps identify potential buying or selling opportunities by comparing the current price to the average price weighted by volume. Volume Profile Analysis: The prod
Volume Profile Pro Signals  精确的量价分析与自动信号生成相结合。 功能概述 Volume Profile Pro Signals 构建实时、数据驱动的量价分布图,揭示价格被接受或拒绝的市场区域。它高亮显示 POC、VAH、VAL,并精准识别 HVN/LVN 区域。在此基础上生成实时的 VAH/VAL 突破信号,并根据 ATR 波动性绘制智能 SL/TP 水平。 所有设置 —— 从剖面分辨率到提醒方式 —— 均可调整以适配你的交易风格,无论是快速抢短线还是多日持仓的波段交易。 核心亮点 按价位的成交量洞察:在 MT5 图表上直观绘制 Point of Control 和 Value Area。 突破提醒:当价格收盘超过 VAH 或跌破 VAL 时即时发出信号。 自适应风险水平:基于 ATR 自动计算的止损与止盈。 智能过滤:EMA 趋势过滤器与可选的 POC 斜率确认减少误报。 HVN/LVN 识别:区分高活跃与低量区,提供更明确的交易背景。 多时间框架兼容:可在多个图表和时间框架上高效运行。 使用场景 指标持续更新市场的动态剖面,无需手动绘制或单独查看
Market Profile Osw MT5
William Oswaldo Mayorga Urduy
用户手册:Market Profile Osw Market Profile Osw 是一款先进的拍卖分析工具,能够可视化特定周期内的成交量和价格分布。与传统的 K 线图不同,该系统揭示了交易活动最集中的区域,从而根据实际市场参与情况识别心理支撑位和阻力位。 1. 参数指南(输入菜单) 常规设置 Show Market Profile: 启用或禁用图表上的轮廓显示。 Volume Type: 可选择通过价格变化计数(Tick)或实际交易量(仅限特定经纪商和资产)来衡量活动。 Look Back Bars: 定义指标将回溯多少根 K 线来构建当前轮廓。 Profile Right Side: 确定轮廓是贴近价格轴绘制(右侧)还是在分析周期的起始处绘制(左侧)。 Seconds Refresh: 指标更新数据并重新绘制轮廓的等待时间。 美学与颜色 Market Profile Lines Color: 相关性较低的一般交易区域颜色。 70% Value Area Algorithm Lines Color: 突出显示价值区域(Value Area)的颜色,该区域集中了 70% 的交易
Volume Profile Advance
Israr Hussain Shah
Daily & Composite Volume Profile   This is a professional-grade market profile tool designed for MetaTrader 5. It utilizes a   Dual-Profile System   to visualize supply, demand, and liquidity concentrations. Key Features Left Side: Daily Session Profiles Automatically identifies the start and end of every trading day. Generates a unique Volume Profile for each individual day. Allows you to see how value migrated from yesterday to today (e.g., Is today's volume higher or lower than yesterday?).
AvgVolumes
Marco Montemari
5 (1)
This indicator is based on Volumes standard indicator, calculates the average of Volumes based on the last N bars set by users, and if the value of the volume is bigger then a set % respect the average a different color will be used. The indicator is shown in a separate indicator window. This version has now a limitation in setting the % about the threshold. If you are interested to set threshold consider to buy the PRO version ( https://www.mql5.com/en/market/product/35925 ) If you want to use
FREE
Volume Profile Delta
Juan Eduardo Verdala
Volume Profile Delta — Indicator for MetaTrader 5 Volume Profile Delta is an indicator that displays the difference between buying volume and selling volume recorded on each bar, represented as a histogram at the bottom of the chart. What this indicator does On each bar it calculates the difference between the volume associated with upward movements and the volume associated with downward movements. The result is shown as a bar in the lower histogram, making it possible to observe whether buying
FREE
Color Histogram Volume Set
Ricardo Almeida Branco
Do you use volume in your reading of the market? Certainly many traders use it, and do not imagine operating without it. The Color Histogram Volume Set indicator allows the user to choose the value that he considers interesting to monitor. When you pass this you will have visual confirmation and if you want you will also have the audible alert that is given by the indicator. Of course, there are other ways to try to find a high volume, such as assessing whether the volume is above av
MR Volume Profile 5
Sergey Khramchenkov
The "MR Volume Profile 5" indicator is a charting tool that displays trading volume at different price levels rather than time intervals. A key concept in volume profile is the point of control (POC)—the price level with the highest volume traded during the session or time range. While tools like VWAP or OBV provide volume trends, the "MR Volume Profile 5" indicator offers granular detail about where the most market activity occurs at specific price levels. This makes it a more precise tool for
Range profile
Mikhail Nazarenko
The indicator automatically calculates the level and   real volume       Point of control, and also displays the market profile for an array of candles, within the boundaries of a rectangle. If your strategy is based on taking profit on a rebound from price accumulations,   the Range profile indicator will become the main tool in scalping trading. Point of control is calculated based on the total volume for each tick or minute candles, depending on the settings and trading timeframe. In the abse
VP hidden
Emr Aljnaby
4.33 (12)
The indicator works to convert normal volume into levels and determine financial liquidity control points. It is very similar in function to Fixed Volume Profile. But it is considered more accurate and easier to use than the one found on Trading View because it calculates the full trading volumes in each candle and in all the brokers present in MetaTrade, unlike what is found in Trading View, as it only measures the broker’s displayed prices. To follow us on social media platforms: telegram
FREE
Blahtech Supply Demand MT5
Blahtech Limited
4.54 (13)
Was: $299  Now: $99  Supply Demand uses previous price action to identify potential imbalances between buyers and sellers. The key is to identify the better odds zones, not just the untouched ones. Blahtech Supply Demand indicator delivers functionality previously unavailable on any trading platform. This 4-in-1 indicator not only highlights the higher probability zones using a multi-criteria strength engine, but also combines it with multi-timeframe trend analysis, previously confirmed swings a
Volume-to-Price Movement Oscillator (VP Oscillator) for MT5 The VP Oscillator highlights the balance (or imbalance) between trading volume and price movement, helping traders spot hidden accumulation, distribution, or weakening trends. How It Works: Calculates each bar’s price range (High–Low) and tick volume. Normalizes both values over a set period (default: 14). Plots the absolute difference between them ×100 — showing how closely price action aligns with trading activity. Interpretation: Hig
FREE
Market Marker MT5
Evgeny Shevtsov
3.8 (5)
The indicator displays peak levels of activity formed by the maximum volume, tracks the correlation of the candles on all timeframes (from the highest to the lowest one). Each volume level is a kind of key trading activity. The most important cluster is inside a month, week, day, hour, etc. Indicator operation features A volume level receives Demand status if the nearest volume level located to the left and above has been broken upwards. A volume level receives Supply status if the nearest volu
VWAP Indicator MT5
Kyra Nickaline Watson-gordon
Description : VWAP (Volume-Weighted Average Price) is the ratio of the value traded to total volume traded over a particular time horizon. It is a measure of the average price at which pair is traded over the trading horizon. Read More. All Symbols and All Timeframes are supported. Indicator Inputs :     VWAP Mode : Mode of VWAP Calculation. Options can be selected : Single,Session,Daily,Weekly,Monthly     Volumes : Real Volumes,Tick Volumes     Price Type : Used price for calculating. O
Fair Value Gap Zone
Mattia Impicciatore
总体描述 Fair Gap Value 指标在 MetaTrader 5 图表上识别并突出显示“公平价值缺口”(fair value gaps)。当一根 K 线的最低价与隔一根中间 K 线后的另一根 K 线的最高价之间形成价格空白时,就产生了公平价值缺口。该指标使用彩色矩形(多头和空头)标注这些区域,为基于价格行为的交易策略提供直观支持。 主要功能 多头缺口检测 :用绿色矩形高亮当前 K 线最低价与两根前序 K 线最高价之间的缺口。 空头缺口检测 :用红色矩形高亮当前 K 线最高价与两根前序 K 线最低价之间的反向缺口。 动态延展 :可将矩形向右延伸指定数量的 K 线。 透明度控制 :可配置矩形的不透明度,以免遮挡底部图表。 显示开关 :支持单独开启或关闭多头/空头缺口的绘制。 历史扫描限制 :可选设置扫描的最大 K 线数量,以提升大数据量图表的性能。 自动清理 :切换周期或首次加载时,会自动删除并重绘所有已有缺口。 输入参数 LookbackBars :用于计算缺口的回溯 K 线数量(默认 3)。 MaxBars :最大扫描 K 线数量(0 = 不限;默认 0)。 ShowBullG
FREE
Buyer Seller Arrows
Oleksandr Sheyko
Buyer Seller Arrows – 自信交易的利器! 发现一个革命性的工具,用于在所有时间框架(从 M1 到 MN1)中直观分析买方与卖方的力量。该指标通过 彩色百分比和箭头 为你提供 即时的市场动态概览 。 主要功能: 绿色向上箭头 = 买方占优 红色向下箭头 = 卖方占优 百分比强度 显示在每个时间框架 (M1, M5, M15, M30, H1, H4, D1, W1, MN1) 颜色编码 让你快速识别趋势(鲜绿色与鲜红色) 工作原理: 跟踪 买卖压力之间的平衡 使用 EMA 与 SMA 计算市场强度 实时显示 趋势主导情况 帮助识别 理想的进场与出场点位 为什么交易者喜欢它: 极其直观 – 无需复杂图表,只看市场力量 快速决策 – 适合剥头皮交易与波段交易 完全可定制 – 根据你的交易风格调整参数 优秀的辅助工具 – 与其他指标结合确认信号
Premium https://www.mql5.com/en/market/product/167272 BITCOIN DAILY TOP BOTTOM ENGINE (V1) This is not a simple indicator. This is a professional-grade market observation and decision engine designed for serious Bitcoin traders who demand clarity, structure, and precision. The Bitcoin Daily Top Bottom Engine is built to identify high-probability daily extremes using adaptive range logic, sweep behavior analysis, and market condition filtering. Instead of reacting late, this engine prepares y
FREE
该指标建立当前报价,可以与历史报价进行比较,并在此基础上进行价格走势预测。指示器有一个文本字段,用于快速导航到所需日期。 选项: 符号 - 选择指标将显示的符号; SymbolPeriod - 选择指标从中获取数据的时段; IndicatorColor - 指示器颜色; HorisontalShift - 由指标绘制的报价移动指定的柱数; Inverse - true 反转引号,false - 原始视图; ChartVerticalShiftStep - 图表垂直移动(键盘上的向上/向下箭头); 接下来是文本字段的设置,您可以在其中输入日期,您可以通过按“回车”立即跳转到该日期。 接下来是文本字段的设置,您可以在其中输入日期,您可以通过按“回车”立即跳转到该日期。
Delta volume ft Ema
Nhat Vy Vu
5 (4)
The Volume Delta Indicator is a technical analysis tool that combines volume analysis with price action to identify potential trading opportunities. This indicator analyzes the difference between buying and selling pressure through candle structure analysis. Key Features Volume Delta Calculation : Measures buy/sell volume difference using candle structure analysis EMA Smoothing : Applies exponential moving average to smooth volume data Breakout Detection : Identifies price breakouts with volume
FREE
Bookmap pro
Ahmed Mohammed Bakr Bakr
FREE Bookmap Volume Heatmap Indicator Overview The   Bookmap Volume Heatmap   is a custom MetaTrader 5 (MQL5) indicator that creates a visual heatmap of trading volume distribution across price levels, similar to professional trading platforms like Bookmap. It provides traders with a clear visualization of where significant trading activity has occurred within a specified price range. Key Features 1.   Volume Distribution Visualization Creates color-coded rectangles on the chart representing vol
FREE
Overview Market Volume Profile Modes is a powerful MT5 volume distribution indicator that integrates multiple Volume Profile variants. Users can switch between different analysis modes through a simple menu selection. This indicator helps traders identify key price levels, support and resistance zones, and market volume distribution. Core Concepts • POC (Point of Control): The price level with the highest volume concentration, representing the market's accepted "fair value" area • VAH (Value A
FREE
Vwap Bands Auto
Ricardo Almeida Branco
The Vwap Bands Auto indicator seeks to automatically map the maximum market frequency ( automatic update of the outermost band ) and has two intermediate bands that also adjust to daily volatility. Another tool from White Trader that combines price and volume, in addition to mapping the daily amplitude. The external band is updated automatically when the daily maximum or minimum breaks the current frequency, and can be an input signal, seeking a return to the daily vwap. Thus, in addition t
Breakout Boxes with Volume Pressure This indicator automates the identification of key consolidation zones (Supply and Demand) based on Market Pivots and Volatility (ATR). Unlike standard support/resistance tools, this indicator provides a unique   Volume Pressure Analysis   inside every box, giving you insight into the battle between Buyers and Sellers before a breakout occurs. Key Features Automated Supply & Demand Zones:   Automatically detects significant Pivot Highs and Lows to draw dyna
BoxChart MT5
Evgeny Shevtsov
5 (7)
The market is unfair if only because 10% of participants manage 90% of funds. An ordinary trader has slim changes to stand against these "vultures". This problem can be solved. You just need to be among these 10%, learn to predict their intentions and move with them. Volume is the only preemptive factor that faultlessly works on any timeframe and symbol. First, the volume appears and is accumulated, and only then the price moves. The price moves from one volume to another. Areas of volume accumu
Blahtech Market Profile MT5
Blahtech Limited
5 (10)
Was: $249  Now: $99   Market Profile defines a number of day types that can help the trader to determine market behaviour. A key feature is the Value Area, representing the range of price action where 70% of trading took place. Understanding the Value Area can give traders valuable insight into market direction and establish the higher odds trade. It is an excellent addition to any system you may be using. Inspired by Jim Dalton’s book “Mind Over Markets”, this indicator is designed to suit the
该产品的买家也购买
ARIPoint
Temirlan Kdyrkhan
ARIPoint is a powerful trading companion designed to generate high-probability entry signals with dynamic TP/SL/DP levels based on volatility. Built-in performance tracking shows win/loss stats, PP1/PP2 hits, and success rates all updated live. Key Features: Buy/Sell signals with adaptive volatility bands Real-time TP/SL/DP levels based on ATR Built-in MA Filter with optional ATR/StdDev volatility Performance stats panel (Success, Profit/Loss, PP1/PP2) Alerts via popup, sound, push, or email Cu
Divergence Bomber
Ihor Otkydach
4.9 (88)
购买该指标的每位用户将额外免费获得以下内容: 原创工具“Bomber Utility”,该工具会自动跟踪每一笔交易,设置止损和止盈点,并根据策略规则自动平仓; 适用于不同交易品种的指标设置文件(Set 文件); 三种不同风险模式下的 Bomber Utility 设置文件:“最低风险”、“平衡风险” 和 “观望策略”; 一套详细的 视频操作手册,帮助您快速完成安装、配置并开始使用本交易系统。 注意: 要获取以上所有赠品,请通过 MQL5 的私人消息系统联系卖家。 我为您介绍原创的自定义指标 “Divergence Bomber”(背离轰炸机),它是一套基于 MACD 背离交易策略 的“全功能”交易系统。 该技术指标的主要任务是识别 价格与 MACD 指标之间的背离,并发出交易信号(包括推送通知),指示未来价格可能的运动方向。平均而言,这些信号的准确率超过 98%。有关该指标如何工作的详细说明,请观看本页面上的视频演示。 该系统使用 止损订单 和 动态回撤平仓机制 来管理交易。 Divergence Bomber 指标的主要特点: 支持交易的品种: AUDCAD、AUDCHF、AUDSG
SignalTech MT5
Yue Wang
5 (21)
SignalTech MT5 is a fully rule based trading system for EURUSD, USDCHF, USDJPY, AUDUSD, NZDUSD, EURJPY, AUDJPY, NZDJPY, CADJPY.  All the winning trades with chart setups are published on the comments page. 2025-12 1174 Pips 2026-01 2624 Pips 2026-02 2937 Pips 2026-03 2165 Pips 2026-04 2243 Pips It can generate signals with Buy/Sell Arrows and Pop-Up/Sound Alerts. Each signal has clear Entry and Stop Loss levels, which should be automatically flagged on the chart, as well as potential Targets 1,
介绍     Quantum Breakout PRO   ,突破性的 MQL5 指标,正在改变您交易突破区域的方式!由拥有超过13年交易经验的资深交易员团队开发,     量子突破 PRO     旨在通过其创新和动态的突破区域策略将您的交易之旅推向新的高度。 量子突破指标将为您提供带有 5 个利润目标区域的突破区域的信号箭头,以及基于突破框的止损建议。 它既适合新手交易者,也适合专业交易者。 量子 EA 通道:       点击这里 重要的!购买后请私信我领取安装手册。 建议: 时间范围:M15 货币对:GBPJPY、EURJPY、USDJPY、NZDUSD、XAUUSD 账户类型:ECN、Raw 或 Razor,点差极低 经纪商时间:GMT +3 经纪商:IC Markets、Pepperstone with Raw 和 Razor 的点差最低 规格: 不重漆! 最多 5 个建议利润目标区域 建议止损水平 可定制的盒子。您可以设置自己的 Box Time Start 和 Box Time End。 接触 如果您有任何疑问或需要帮助,请通过私人消息与我联系。
Azimuth Pro
Ottaviano De Cicco
5 (7)
Azimuth Pro V2:MT5合成分形结构分析与确认入场 概述 Azimuth Pro 是 Merkava Labs 推出的多层级波段结构指标。四层嵌套波段层级、锚定波段的VWAP、ABC形态识别、三时间框架结构过滤以及收盘确认入场——一个图表,一个从微观波段到宏观周期的完整工作流程。 这不是盲目的信号产品。它是一个以结构为先的工作流程,专为重视位置、背景和时机的交易者打造。 V2上市优惠 — Azimuth Pro V2售价USD 399(接下来的100份)。最终价格:USD 499。 1. V2的变化 合成多时间框架引擎 高时间框架分析从零开始重建,采用与Meridian Pro相同的专有合成架构。更清晰的HTF背景、稳定的实时行为、无经典MTF同步问题。合成引擎还解锁了 固定比率时间框架级联 (x2、x3、x4、x6)——不再在经纪商的固定时间框架之间任意跳转,您可以按图表时间框架的固定倍数分析结构,在每个尺度上保持相同的分形关系。 确认入场箭头 作为稳定且可恢复的执行层而设计的收盘确认箭头。当ABC设置形成且自适应确认逻辑在收盘K线上验证方向时,箭头会写入下一根K线的
RelicusRoad Pro MT5
Relicus LLC
4.96 (24)
RelicusRoad Pro: 量化市场操作系统 终身访问限时 70% 折扣 - 加入 2,000+ 交易员社区 为什么大多数交易者即使拥有“完美”指标也会失败? 因为他们在真空中交易 单一概念 。没有背景的信号是赌博。要持续获胜,您需要 共振 (CONFLUENCE) 。 RelicusRoad Pro 不是一个简单的箭头指标。它是一个完整的 量化市场生态系统 。它描绘价格运行的“公允价值之路”,区分市场噪音和真实的结构性突破。 停止猜测。开始用机构级“路”逻辑进行交易。 核心引擎:“Road” (路) 算法 系统的核心是 Road Algo ,一个实时适应市场条件的动态波动率通道。它投射出 安全线 (平衡) 和价格可能反转的 扩展水平 。 Simple Road: 典型市场的标准结构映射。 Smooth Road: 针对震荡盘整的降噪计算。 Breakout Road: 专为识别波动率扩张和爆发性走势而调整。 1. 算法动量与确认 我们的“剥头皮箭头”不只是简单的交叉。它们利用 高阶多项式逻辑 过滤噪音,确保信号与主周期一致。我们检测动量、价格行为和 Road 结构汇聚的精确入场
MetaTrader 5 智能多层突破与回调探测器 "智能 · 简单 · 快速!" 您是否厌倦了错过高概率的突破入场机会? 您是否花费数小时扫描多张图表,试图将突破与趋势方向和货币动能对齐——却仍然错过了行情? Break Pullback 用一个指标解决所有这些问题。 什么是 Break Pullback? Break Pullback 是一款专业级 MetaTrader 5 指标,专为交易市场结构、突破和趋势延续形态的交易者而设计。 它能实时自动检测多个货币对的突破与回调形态——并通过三层确认过滤每个信号: 结构突破检测——识别图表上的关键突破位 高时间框架日线偏向——将入场与主导日线趋势方向对齐 货币强弱指数——确认配对货币间的动能失衡 结果:更少的虚假信号,更强的信心,更快的执行——无需面对图表过载。 适合哪些交易者? Break Pullback 专为使用以下方法的交易者设计: 突破与回测策略 市场结构分析(BOS、 OB Order Block 、结构位) 聪明钱概念(SMC)或 ICT 风格入场 趋势跟踪与延续形态 跨外汇和黄金(XAUUSD)的多对扫描 日内和波段
Quantum TrendPulse
Bogdan Ion Puscasu
5 (25)
介绍 Quantum TrendPulse   ,这是一款终极交易工具,它将 SuperTrend   、   RSI 和 Stochastic 的强大功能整合到一个综合指标中,以最大限度地发挥您的交易潜力。该指标专为追求精准和效率的交易者而设计,可帮助您自信地识别市场趋势、动量变化以及最佳进入和退出点。 主要特点: 超级趋势整合: 轻松跟随当前的市场趋势并乘上盈利浪潮。 RSI 精度: 检测超买和超卖水平,非常适合把握市场逆转时机,可用作 SuperTrend 的过滤器 随机精度: 利用随机振荡在波动的市场中寻找隐藏的机会, 用作超级趋势的过滤器 多时间范围分析: 从 M5 到 H1 或 H4,在不同时间范围内关注市场动态。 可定制的警报: 当您的自定义交易条件得到满足时收到通知,这样您就不会错过任何交易。 无论您是新手还是经验丰富的交易员,   Quantum TrendPulse 都能为您提供所需的优势,帮助您增强策略并自信地进行交易。借助这一强大的指标,将洞察力转化为利润 — 掌控您的交易! ***购买 Quantum TrendPulse,即可免费获得 Quantum Tr
Btmm state engine pro
Garry James Goodchild
5 (4)
BTMM State Engine Pro is a MetaTrader 5 indicator for traders who use the Beat The Market Maker approach: Asian session context, kill zone timing, level progression, peak formation detection, and a multi-pair scanner from a single chart. It combines cycle state logic with a built-in scanner dashboard so you do not need the same tool on many charts at once. What it does Draws the Asian session range; session times can follow broker server offset or be set in inputs. Tracks level progression (L
首先,值得强调的是,这个交易工具是非重绘、非重画和非滞后的指标,非常适合专业交易。 在线课程,用户手册和演示。 智能价格行动概念指标是一个非常强大的工具,既适用于新手,也适用于经验丰富的交易者。它将超过20个有用的指标合并到一个指标中,结合了高级交易思想,如内圈交易员分析和智能资金概念交易策略。该指标侧重于智能资金概念,提供有关大型机构交易方式的见解,帮助预测它们的动向。 它在流动性分析方面尤其擅长,有助于理解机构的交易方式。它擅长预测市场趋势,并仔细分析价格波动。通过将您的交易与机构策略对齐,您可以更准确地预测市场走向。该指标多才多艺,擅长分析市场结构,识别重要的订单区块,并识别各种模式。 它擅长识别BOS和CHoCH等模式,理解动量的转变,并突出显示供需强劲的关键区域。它还擅长发现强大的不平衡,并分析价格创造更高高点或更低低点的模式。如果您使用斐波那契回撤工具,该指标可以满足您的需求。它还可以识别相等的高点和低点,分析不同的时间框架,并通过仪表板显示数据。 对于使用更高级策略的交易者,该指标提供了工具,如公平价值差指标和优惠和折扣区域的识别。它特别关注高时间框架订单区块,并
OrderFlux | MetaTrader 5 的足迹订单流 (Footprint Orderflow) 版本 2.0 – 活跃交易者的实时 Bid/Ask 可视化 OrderFlux 是 MT5 的足迹 (Footprint) 和订单流 (Orderflow) 指标。它不仅显示价格走到了哪里,还显示了运动过程中发生了什么:每个价格水平的 Bid/Ask 成交量、Delta、失衡 (Imbalance) 和成交量分布。 许多图表只向您显示 K 线的最终结果。OrderFlux 向您展示了到达那里的过程。当您想解读市场参与度而不仅仅是 K 线形态时,这正是您所需要的。 在实时图表中,OrderFlux 主要回答三个问题: 激进的买入或卖出压力目前正在哪里进入市场? 在哪些价格水平上成交量被吸收或拒绝? 当前的运动如何契合交易时段 (Session) 的背景? 您在界面中得到什么 主图表直接基于 Canvas 渲染足迹。此外还有底部徽章(时间、Delta、成交量)、可选的 Delta 摘要和 Session 背景。 流量 (Flow) 模块 DOM(市场深度)、Time & Sales、
Grabber System MT5
Ihor Otkydach
4.83 (23)
向您介绍一款优秀的技术指标——Grabber,它是一套即开即用的“全包式”交易策略。 在一个代码中集成了强大的市场技术分析工具、交易信号(箭头)、提醒功能和推送通知。 每位购买该指标的用户还可免费获得以下内容: Grabber辅助工具:用于自动管理已开仓位 视频操作指南:逐步教学如何安装、设置和使用该指标进行交易 原创Set文件:可快速自动配置,帮助实现最佳交易效果 忘掉其他策略吧!只有Grabber能够真正激励你在交易中攀登新高峰! Grabber策略的主要特点: 交易周期:从M5到H4 适用资产:任意,但我推荐我亲自测试过的品种(GBPUSD、GBPCAD、GBPCHF、AUDCAD、AUDUSD、AUDSGD、AUDCHF、NZDUSD、NZDCAD、EURCAD、EURUSD、EURAUD、EURGBP、EURCHF、USDCAD、USDSGD) 交易时间:全天候 24/7 交易效果:我分享自己的真实交易结果,并在此教学如何操作: https://www.mql5.com/ru/market/product/134563?source=Site+Market+MT5+Indic
“ Dynamic Scalper System MT5 ”指标专为在趋势波内进行剥头皮交易而设计。 已在主要货币对和黄金上进行测试,并可与其他交易工具兼容。 提供顺势短线建仓信号,并提供额外的价格变动支持。 指标原理: 大箭头决定趋势方向。 在趋势波内,我们采用一种生成小箭头形式的剥头皮交易信号的算法。 红色箭头代表看涨方向,蓝色箭头代表看跌方向。 敏感的价格变动线会沿着趋势方向绘制,并与小箭头信号协同作用。 信号运作方式如下:当线在适当时刻出现时,将形成入场信号;在出现线时,持仓;线完成后,平仓。 建议的操作时间范围为M1 - H4。 箭头在当前K线上方形成,如果下一根K线已开仓,则不会重新绘制上一根K线上方的箭头。 输入参数 Trend Wave Period - 趋势方向(大箭头)的周期,改变趋势波的时间间隔。值 1 表示趋势方向的最长持续时间,参数值越大,持续时间越短。 Scalper Arrows Period - 信号箭头(小箭头)的计算周期,改变入场信号的生成频率。值 3 表示最频繁的生成频率,参数值越大,箭头频率越低,准确度越高。 这些参数可以根据不同
Meridian Pro
Ottaviano De Cicco
5 (2)
Meridian Pro 2.00:MT5 专业多周期趋势矩阵 Meridian Pro 2.00 是面向 MetaTrader 5 的专业自适应趋势矩阵。它结合了原始 Meridian 趋势引擎、清晰的图表 ribbon、收盘柱确认箭头、8 周期 dashboard、Fuel 动量、加权共识、合成 HTF 处理,以及直接显示在当前图表上的高周期环境线。 目标很简单:在一个有纪律的 workflow 中读取当前趋势、多周期结构、强度、动量和 EA-ready 状态,而不是在多个图表上堆叠互不关联的指标。 Meridian Pro 的不同之处 一个自适应引擎 - 同一套波动率感知 Meridian 逻辑应用于 M1 到 W1。 合成 HTF 架构 - 高周期行由低周期数据推导,减少传统零售 MTF 中常见的 repaint、同步延迟和 broker-dependent HTF 质量问题。 完整矩阵输出 - Bias、Strength、Fuel 和加权 Consensus 一起显示,而不是拆成独立工具。 图表执行层 - ribbon 和箭头专注于当前周期,选配 HTF 线在同一图表上增加高
OmniSync Projection
Antonio-alin Teculescu
5 (1)
Chronos Fractal Engine is an innovative price projection indicator for MetaTrader 5, designed to transform your technical analysis by intelligently identifying and projecting historical price patterns. Built upon an advanced correlation algorithm and the fractal principles of the market, this powerful tool visualizes potential future price movements, giving you a unique edge in your trading decisions. What is Chronos Fractal Engine? At its core, the Chronos Fractal Engine employs a sophisticat
Trend Lines PRO MT5
Roman Podpora
5 (1)
趋势线专业版 -     有助于了解市场真正转变的方向。该指标显示了真正的趋势反转点以及主要参与者重新入场的点位。 你看     BOS线路   无需复杂设置或不必要的干扰,即可在高时间框架内显示趋势变化和关键水平。信号不会重绘,并在K线收盘后仍保留在图表上。 MT4 版本   - 与 RFI LEVELS PRO 指示器结合使用时,可发挥其最大潜力 该指标显示的内容: 真正的转变   趋势线(BOS线) 一旦信号出现,它就始终有效!这与会重绘的指标有着重要的区别,后者可能会发出信号后又改变信号,从而导致资金损失。现在,您可以更精准、更准确地进入市场。此外,还有一个功能:在箭头出现后,K线会着色,直到达到目标价位(止盈)或出现反转信号为止。 重复条目   以及主要玩家的充值 为了提高寻找入场点时的视觉清晰度,我们创建了一个模块,该模块首先显示买入/卖出区域,并在该区域内寻找最佳入场点。此外,我们还加入了智能逻辑来管理止损位,该逻辑会随着时间的推移逐步降低止损位的大小,从而降低入场时的初始风险( 移动止损位 )。 信号强度水平     (BOS) 该指标采用三个显著性等级来衡量趋势变化
The Zone Trading Indicator is a technical analysis tool for MetaTrader 5 that automatically identifies and displays tradable price zones across multiple timeframes to assist with structured market analysis. The indicator plots Monthly, Weekly, Daily, and H4 tradable zones , allowing traders to view higher- and lower-timeframe price areas simultaneously. These zones are designed to support one-candle–based entry approaches by highlighting predefined areas where price interaction may be monitored.
RFI levels PRO MT5
Roman Podpora
3.67 (3)
该指标能够准确显示反转点和价格回落区域。     行业领军人物 。您能洞察新趋势的形成,并以最高的精准度做出决策,掌控每一笔交易。 VERSION MT4     -    与……结合时,展现其最大潜力     趋势线专业版   指标 该指标显示的内容: 新趋势开始时的反转结构和反转水平及其激活。 显示屏   获利了结   和   止损   风险回报比最低的水平     RR 1:2       。 具有智能减值逻辑的止损。 显示指定指标中两种趋势类型的反转形态。 指标: 根据     趋势线     (全球趋势变化) 潮流专业版     (趋势快速变化) 简单有效   扫描器   实时趋势(新增)。 多时间框架工具筛选。 展示   利润   在 LOGIC AI 信号之后。 以下列出今日走势积极的金融工具。(RB键) 能够为终端启用通知(警报)功能,并向移动设备推送通知。 逻辑人工智能     — 利用人工智能寻找最佳切入点。 只有在启用 MTF(多时间框架分析)模式时,该功能才可用。 兼容性。 当与趋势线指标结合使用时,该指标能发挥其最大潜力。 这     RFI LEVELS
PZ Day Trading MT5
PZ TRADING SLU
2.83 (6)
该指标仅使用价格行为分析和donchian渠道以锯齿形检测价格反转。它是专门为短期交易而设计的,根本不需要重新粉刷或补漆。对于精明的交易者来说,这是一个绝佳的工具,旨在增加他们的运作时间。 [ 安装指南 | 更新指南 | 故障排除 | 常见问题 | 所有产品 ] 极易交易 它在每个时间段都提供价值 实施自我分析统计 它实现了电子邮件/声音/视觉警报 基于可变长度的突破和拥挤区域,该指标仅使用价格行为来选择交易并对市场快速做出反应。 显示过去信号的潜在利润 该指标分析其自身的质量和性能 突围的损失突出显示并解决 该指标是不可重涂和不可重涂的 该指标将帮助盘中交易者不要错过单个价格反转。但是,并非所有价格反转都是一样的,也不是具有相同的可行质量。决定要突破哪些突破而忽略哪些取决于交易者的良好判断。 如何解释统计数据 该指标研究其自身信号的质量,并在图表上绘制相关信息。将分析每笔交易,并在图表的左上角显示总体历史结果,这使您可以针对任何给定的工具和时间范围自行优化指标参数。每个乐器和时间表都有其自己的最佳设置,您可以自己找到它们。 最大优惠交易:对于任何给定的交易,MFE都是最好的结
Entry Points Pro for MT5
Yury Orlov
4.48 (138)
这款指标用于 MT5,可提供准确的入场交易信号,且无重绘。 它可应用在任何金融资产:外汇、加密货币、贵金属、股票、指数。 它将提供极其精准的评估,并告诉您何时开仓和平仓的最佳时机。 观看 视频 (6:22),其中包含一个仅处理单一信号的示例,该信号即可值回指标购价! 大多数交易者在 Entry Points Pro 指标的帮助下,在第一个交易周内即改善了他们的交易结果。 订阅我们的 Telegram 群 ! Entry Points Pro 指标的益处。 入场信号无重绘 如果信号出现,并得到确认,则它不会再消失;不像是重绘指标,它会导致重大的财产损失,因为它们可以在显示信号后再将其删除。 无差错开仓 指标算法可令您找到入场交易(买入或卖出资产)的理想时机,从而提高每位交易者的成功率。 Entry Points Pro 可操作任何资产 它允许您在 MT5 平台上交易任何经纪商的加密货币、股票、贵金属、指数、大宗商品和货币。 提供任何方向的信号 Entry Points Pro 指标提供针对任意价格走势的入场交易信号 - 上涨、下跌或横盘(横向)。 最大盈利潜力 离场信号
ARICoins
Temirlan Kdyrkhan
ARICoin is a powerful trading companion designed to generate high-probability entry signals with dynamic TP/SL/DP levels based on volatility. Built-in performance tracking shows win/loss stats, PP1/PP2 hits, and success rates all updated live. Key Features: Buy/Sell signals with adaptive volatility bands Real-time TP/SL/DP levels based on ATR Built-in MA Filter with optional ATR/StdDev volatility Performance stats panel (Success, Profit/Loss, PP1/PP2) Alerts via popup, sound, push, or email Cust
Trend Forecaster
Alexey Minkov
5 (7)
Trend Forecaster – Since 2023. The Trend Forecaster indicator utilizes a unique proprietary algorithm to determine entry points for a breakout trading strategy. The indicator identifies price clusters, analyzes price movement near levels, and provides a signal when the price breaks through a level. The Trend Forecaster indicator is suitable for all financial assets, including currencies (Forex), metals, stocks, indices, and cryptocurrencies. You can also adjust the indicator to work on any time
CRT Multi-Timeframe Market Structure & Liquidity Sweep Indicator Non-Repainting | Multi-Asset | MT4 Version Available MT4 Version: https://www.mql5.com/en/market/product/162556 Full Setup Guide: https://www.mql5.com/en/blogs/post/767525 Indicator Overview CRT Ghost Candle HTF Fractal is a complete institutional-grade market structure toolkit for MetaTrader 5. It projects higher-timeframe candle structure, CRT trap levels, session levels, previous period highs and lows, pivot points, and a real
Meta Cipher A
SILICON HALLWAY PTY LTD
5 (1)
Meta Cipher A:精准的价格行为叠加指标 Meta Cipher A 将流行的 Market Cipher A 概念引入 MetaTrader 5,作为一个高精度的叠加指标。它能够直接在价格图表上显示预警信号,结合 8 条 EMA 均线带 、WaveTrend 分析以及八种不同的信号类型,帮助您在行情完全形成之前识别进场、出场和高风险环境。 虽然 Meta Cipher A 本身已经非常强大,但它被设计为可与 Meta Cipher B 自然搭配,以实现更深入的确认与分析。 功能介绍 该叠加系统绘制动态 EMA 均线,并使用趋势颜色编码及填充区域以增强可视化效果。它包含八种专业信号类型,包括 Blood Diamond(血钻) 反转信号、 Yellow Cross(黄色交叉) 操纵警告信号,以及 Blue Triangle(蓝色三角) 延续信号。 WaveTrend 振荡器在后台运行,将多层分析结果输入 RSI 和 MFI 动量确认中。您可以用它来读取价格结构、预测走势,并判断何时应暂时观望。 为 Heiken Ashi 优化设计 Meta Cipher A 内置 Hei
==================================================================== SMC Pro v6.1 APEX AI — XAUUSD Gold Empire MetaTrader 5 Indicator · Smart Money Concepts · Predictive Intelligence Engine ==================================================================== SMC Pro v6.1 APEX AI is a professional Smart Money Concepts indicator system built exclusively for XAUUSD (Gold) on MetaTrader 5. It combines the complete SMC framework — Order Blocks, Liquidity sweeps, Fair Value Gaps, Break of Structure,
Meravith MT5
Ivan Stefanov
5 (1)
做市商工具。 Meravith 将: 分析所有时间周期并显示当前正在运行的趋势。 标注流动性区域(成交量均衡区),即多头与空头成交量相等的位置。 在您的图表上直接显示来自不同时间周期的所有流动性水平。 生成并展示基于文本的市场分析供您参考。 根据当前趋势计算目标位、支撑位和止损位。 计算交易的风险回报比。 根据您的账户余额计算仓位大小,并估算潜在利润。 在市场出现重大变化时,Meravith 还会发出警告。 指标的主要线条: 多头/空头成交量衰竭线 —— 作为目标位使用。 趋势线 —— 指示市场趋势方向。根据市场是多头还是空头而改变颜色,并作为趋势支撑。其颜色主要反映市场情绪。 成交量均衡线(Eq)—— Eq(Volume Equilibrium)是系统的核心。它表示买卖双方成交量的平衡点,即市场流动性所在位置。向上突破 Eq 表示多头倾向,向下突破 Eq 表示空头倾向。突破后,应等待回调——当价格回到相反趋势的偏离线或衰竭线附近时。 使用方法:只需将其添加到图表中。 Meravith 可以分析一切——趋势和回调。 趋势线与某条成交量衰竭线之间的距离越大,说明该方向的成交量越高。 趋势
Bill Williams Advanced
Siarhei Vashchylka
5 (11)
Bill Williams Advanced is designed for automatic chart analysis using Bill Williams' "Profitunity" system. The indicator analyzes four timeframes at once. Manual (Be sure to read before purchasing) Advantages 1. Analyzes the chart using Bill Williams' "Profitunity" system. Signals are displayed in a table in the corner of the screen and on the price chart. 2. Finds all known AO and AC signals, as well as zone signals. Equipped with a trend filter based on the Alligator. 3. Finds "Divergence Bar
UZFX {SSS} 短线智能信号 MT5 是一款无重绘的高性能交易指标,专为在快速波动的市场中需要精准、实时信号的短线交易者、日内交易者和波段交易者设计。该指标由 (UZFX-LABS) 开发,融合了价格行为分析、趋势确认和智能过滤技术,可在所有货币对和时间周期内生成高概率的买入和卖出信号。 我推荐*的最佳时间周期:15分钟及以上。 {1小时}是我的首选。效果令人惊叹……! 注意:与{ LTL 164343 }指标结合使用,可提高获胜信号率。 使用 LTL 信号判断趋势,利用 SSS 信号确定入场时机。 这种方法将最大化您的胜率,并有效规避虚假信号。 核心功能 智能信号检测——精准识别强劲的趋势反转与延续形态。 多周期短线交易——在所有时间周期内运行流畅。 可自定义提醒——针对每个信号接收弹出窗口、电子邮件及手机通知(可配置)。 清晰可视箭头——图表上醒目的蓝色(买入)和红色(卖出)箭头。 自适应信号强度——可调节信号强度,适用于短期、中期或长期交易。 用户友好界面——简洁的图表显示,无重绘或信号延迟。 工作原理 UZFX SSS指标通过扫描价格走势来检测: 看涨反转——价格
Berma Bands
Muhammad Elbermawi
5 (9)
Berma 波段 (BBs) 指标对于寻求识别和利用市场趋势的交易者来说是一种有价值的工具。通过分析价格与 BBs 之间的关系,交易者可以辨别市场是处于趋势阶段还是区间波动阶段。 访问[ Berma Home Blog ] 了解更多信息。 Berma 带由三条不同的线组成:上 Berma 带、中 Berma 带和下 Berma 带。这些线围绕价格绘制,直观地表示价格相对于整体趋势的变动。这些带之间的距离可以洞察波动性和潜在的趋势逆转。 当 Berma Bands 线相互分离时,通常表明市场正在进入横盘或区间波动时期。这表明缺乏明确的方向性。交易者可能会发现在这些时期内很难识别趋势,因此可能需要等待更清晰的趋势出现。 当 Berma Bands 线汇聚成一条线时,通常表示趋势环境强劲。这种汇聚表明存在明显的方向性偏差,因为价格波动性足以随趋势而变化。交易者可能会发现在这些时期更容易识别潜在的入场点和出场点,因为趋势的势头可以提供有利的交易机会。然而,重要的是要注意整体趋势中的潜在回调或修正。 Berma 带根据价格蜡烛图与上带和下带的相互作用提供明确的买入和卖出信号。当价格蜡烛图首
Gartley Hunter Multi
Siarhei Vashchylka
5 (11)
Gartley Hunter Multi - An indicator for searching for harmonic patterns simultaneously on dozens of trading instruments and on all possible timeframes. Manual (Be sure to read before purchasing) | Version for MT4 Advantages 1. Patterns: Gartley, Butterfly, Shark, Crab. Bat, Alternate Bat, Deep Crab, Cypher 2. Simultaneous search for patterns on dozens of trading instruments and on all possible timeframes 3. Search for patterns of all possible sizes. From the smallest to the largest 4. All fou
作者的更多信息
Overview Market Session & Bar Counter displays bar numbers on your chart while highlighting major trading sessions with semi-transparent overlays. Perfect for traders who need to track bar progression and monitor session activity simultaneously. Key Features Bar Counting Numbers each bar from the start of the trading day Customizable display intervals (show every bar or every Nth bar) Milestone highlighting for important bar numbers Real-time countdown timer showing time until next bar Weeken
Harness the Force of Market Momentum Stop chasing false breakouts. Trend Force identifies high-probability trend continuations with surgical precision, giving you the edge professional traders demand. Get accurate In/Out signals with smart dynamic stop loss, stop guessing and get results NOW! Why Traders Choose Trend Force Smart Breakout Detection Advanced volatility-adjusted algorithm catches real moves Filters out market noise and false signals automatically Dynamic adaptation to chan
筛选:
无评论
回复评论