IceFX VelocityMeter Mini
- 指标
-
Norbert Mereg
 At Darkmoon FX you will find many useful tools developed mainly to semi automatic trading. These tools support advanced/pro forex traders with highl level of trading execution and the total control of the trades. None of these tools are the ultimate or the best solutions for everybody, but rather it
 - 版本: 1.11
- 更新: 17 十一月 2021
- 激活: 10
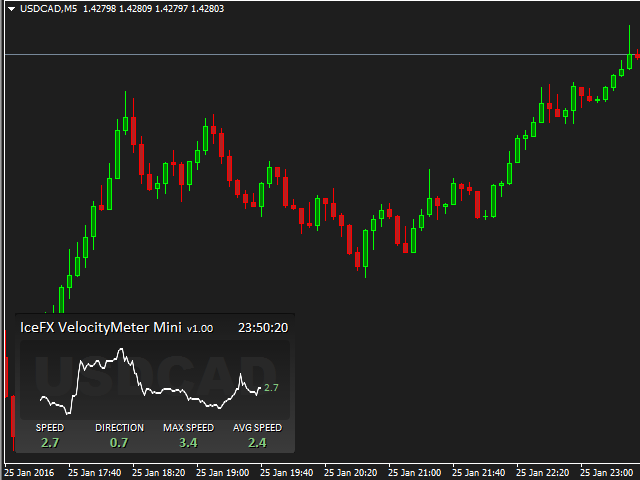
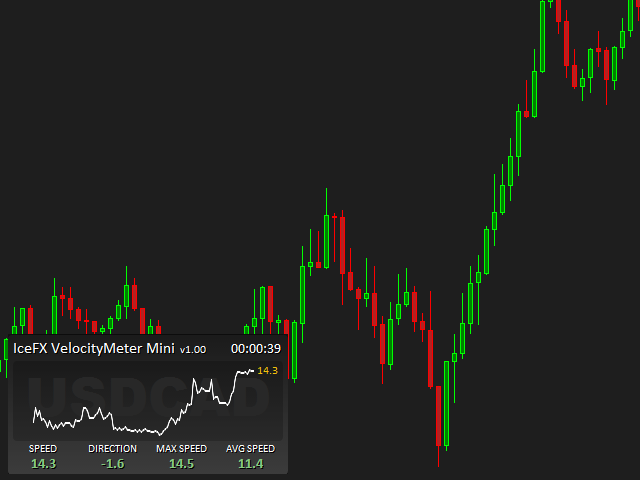
IceFX VelocityMeter Mini is a very unique indicator on MetaTrader 4 platform which measures the speed of the Forex market. It is not a normal volume or other measurement indicator because IceFX VelocityMeter Mini is capable to understand market speed movements which are hidden in ticks and those valuable information cannot be read in an ordinary way from the candles.
The software monitors the received ticks (frequency, magnitude of change) within a specified time range, analyzes these info and defines, displays and records a reference value which is typical of the actual market velocity rate. Market speed value is changing with every tick, so this professional tool has the ability to respond quickly to any changes.
This IceFX VelocityMeter Mini indicator is a "minimized" version of the original IceFX VelocityMeter indicator. It draws the last 50 speed values on a mini tick chart, too. It shows the current speed, current speed direction, average speed and maximum speed.
Parameters
- SpeedMediumLevel - level of medium speed
- SpeedHighLevel - level of high speed
- Correction - correction of calculation (recommended value is 20)
- Corner - chart corner of panel
- CornerOffsetX - horizontal offset from the corner
- CornerOffsetY - vertical offset from the corner
The indicator sets global variables with the current speed, current speed direction and average speed values, so you can use these values in your Expert Advisors.
Global variables
- SPEED_<SYMBOL>_<PERIOD>_CURR - current value of speed (e.g: SPEED_EURUSD_15_CURR)
- SPEED_<SYMBOL>_<PERIOD>_DIR - current value of speed direction (e.g: SPEED_EURUSD_15_DIR)
- SPEED_<SYMBOL>_<PERIOD>_AVG - average value of speed (e.g: SPEED_EURUSD_15_AVG)

Isn't working correctly. Please refund asap.