已发布的产品
IceFX 点差监视器 是特别的点差日志指标,显示当前, 最小/最大和平均点差数值。 这些数值可视,即使在重启动之后也如此。同样, 点差监视器可以保存所有期望的点差值至 .csv 文件用于后期分析。
FREE
IceFX 的 TradeInfo 是一款工具指标,显示当前账户和持仓的重要信息。 显示信息: 有关当前账户的信息 (结余, 净值, 可用保证金)。 当前点差, 当前回撤 (DD), 计划利润, 预计亏损, 等等。 开仓数量, 交易量 (手数), 盈利。 今日和昨日的范围。 距下一根柱线的剩余时间。 最后一日的盈利信息 (与 IceFX ProfitInfo 指标集成)。 风险- 基于开新仓的手数信息。 MagicNumber 过滤器。 注释过滤器。
FREE
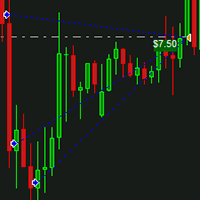
IceFX DrawProfit 指标可以有效地帮助那些交易员,在图表上看到所有已平仓位信息:利润或亏损。如果您在图表上设置的 DrawProfit 是通过 EA,您将清楚地看到它的盈利和亏损情况。 主要特征: 绘制平仓线 绘制已平仓货币的盈利/亏损 按照蜡烛图进行订单汇总 以魔幻数字过滤 EA 注释过滤器
FREE

IceFX Heatmap is a special indicator that shows the places where the price has been staying and ranging over the past few days. These sites will be displayed in a "Heatmap style", with which you can clearly see the main formed bands. The main rates (where the price has "lingered/stayed" much) are indicated in bright colors (in case of black-and-white view) or red color (in case of color view).
Settings Days - the number of days the heat(map) is calculated for. Resolution - resolution rate. 10 =
FREE
IceFX 速度计是一款 MetaTrader 4 平台上的独特指标,测量外汇市场的速度。它不是一个通常的交易量或其它测量指标,因为 IceFX 速度计能够理解市场行情速度隐藏在即时报价,而那些有价值的信息是不能以普通方式从蜡烛图里解析出来的。 本软件监视指定时间范围内接收的即时报价 (频率, 变化幅度), 分析这些信息和定义, 显示并记录引用值, 此即典型的市场真实速率。市场速度值在每次报价时都在变化, 所以这款专业工具有能力快速响应任何变化。 它记录一根蜡烛内的最小/最大/平均值, 甚至机器人重启后依旧可见。由速度计提交的全部特殊数据可以读取/用于任何 MetaTrader 4 EA。
FREE
IceFX 的最新账户信息指标解锁所有 MetaTrader 4 的高级功能 (编译版本 600 以上)。 本指标以优雅的方式,用图形化表示当前账户的主要数据 (余额, 净值, 可用保证金, 当前盈利/亏损, 总盈利/亏损, 持仓数量和手数, 等等)。在图表上 AccountInfo 图形化显示近期账户余额。 所有数据也可以用 MagicNumber , 订单注释, 和品名过滤,以便对指定 EA/手工策略的性能进行专业评估。
FREE
本指标的目标是令您快速、全面的查看当前盈利。IceFX 的 ProfitInfo 是一款工具指标,计算并显示图表上品种的实际交易盈利。指标显示按照日 / 周 / 月和年分离,单位点数,货币和百分比。 主要特征: 您可以很容易的调整 IceFX ProfitInfo 来显示当前打开图表指定交易货币对的盈利,甚或整个账户盈利。 可定制在图表上的全部位置。 定制字号。 显示日和月的平均盈利。 MagicNumber 过滤器。 评论过滤器。
FREE
This is a unique tick chart indicator for MetaTrader 4 platform. The software is capable to graphically display the last 100 ticks and in addition to that it displays the current spread, bid / ask and time values in an elegant IceFX style dashboard. The indicator is an efficient tool for traders using M5 or even M1 timeframe.
Indicator parameters: Corner - corner of panel CornerXOffset - horizontal offset from the corner CornerYOffset - vertical offset from the corner ChartType - type of char
FREE

IceFX VelocityMeter Mini is a very unique indicator on MetaTrader 4 platform which measures the speed of the Forex market . It is not a normal volume or other measurement indicator because IceFX VelocityMeter Mini is capable to understand market speed movements which are hidden in ticks and those valuable information cannot be read in an ordinary way from the candles. The software monitors the received ticks (frequency, magnitude of change) within a specified time range, analyzes these info and
IceFX VelocityMeter Mini is a very unique indicator on MetaTrader 4 platform which measures the speed of the Forex market . It is not a normal volume or other measurement indicator because IceFX VelocityMeter Mini is capable to understand market speed movements which are hidden in ticks and those valuable information cannot be read in an ordinary way from the candles. The software monitors the received ticks (frequency, magnitude of change) within a specified time range, analyzes these info and