DeltaVolumeValue

In the fast-paced world of cryptocurrency trading, understanding market dynamics is crucial for making informed decisions. One of the key indicators that traders use to analyze market behavior is Volume Delta, which offers insights into the balance between buying and selling pressure. This article explores the concept of Volume Delta, its significance in order flow analysis, and how it can be used effectively in trading strategies. By providing a clear understanding of this indicator, traders can better anticipate price movements and improve their overall trading performance. Understanding Volume Delta Volume Delta measures the difference between buying and selling volume within a specific time frame. It provides traders with a clearer picture of market sentiment by highlighting whether buyers or sellers are in control. This indicator is particularly useful in identifying trends and reversals, as it combines volume analysis with price action. By assessing the Volume Delta, traders can gain insights into whether the market is bullish, bearish, or ranging. The calculation of Volume Delta is straightforward. It involves subtracting the total volume of sell orders from the total volume of buy orders over a given period. A positive Volume Delta indicates that buying pressure is dominant, while a negative value suggests that selling pressure is stronger. This simple yet effective metric can significantly enhance a trader's understanding of market dynamics. Volume Delta reflects the net buying and selling pressure. It can help in identifying potential trend reversals. Positive Volume Delta suggests bullish sentiment. Negative Volume Delta indicates bearish sentiment. It is calculated by subtracting sell volume from buy volume. The Importance of Order Flow Analysis Order flow analysis is an essential component of modern trading strategies. It involves examining the flow of buy and sell orders to understand market dynamics more deeply. By analyzing order flow, traders can gain insights into how price movements occur and where potential support and resistance levels may lie. This approach allows traders to make more informed decisions based on actual market behavior rather than relying solely on traditional indicators. Volume Delta plays a vital role in order flow analysis. It provides traders with the ability to assess the intensity of buying and selling activity, offering a clearer picture of market sentiment. Understanding the intricacies of order flow can lead to improved timing in entering and exiting trades. Moreover, traders can use Volume Delta in conjunction with other indicators to build a comprehensive trading strategy. Order flow analysis reveals actual market behavior. It helps in identifying support and resistance levels. Volume Delta enhances the understanding of market sentiment. Traders can improve their timing with order flow insights. Combining Volume Delta with other indicators can lead to better strategies. How to Use Volume Delta in Trading To effectively incorporate Volume Delta into your trading strategy, it's essential to understand how to interpret its signals. Traders can look for divergences between Volume Delta and price movements to identify potential trend reversals. For instance, if the price is making new highs while Volume Delta is decreasing, it may signal a weakening bullish trend. Conversely, if the price is making new lows but Volume Delta is increasing, it could indicate that sellers are losing control. Another way to use Volume Delta is to monitor it alongside candlestick patterns. Certain patterns, such as engulfing candles or doji formations, can provide additional context when analyzed with Volume Delta. For example, a bullish engulfing candle with a corresponding positive Volume Delta can strengthen the case for a potential upward move. Look for divergences between Volume Delta and price. Decreasing Volume Delta with rising prices may indicate weakness. Increasing Volume Delta with falling prices suggests seller exhaustion. Analyze Volume Delta with candlestick patterns for context. Use Volume Delta to confirm signals from other indicators. Limitations of Volume Delta While Volume Delta is a powerful tool, it is not without its limitations. One potential drawback is that it may lag behind price movements, leading to delayed signals. Traders should be cautious of relying solely on Volume Delta without considering other market factors. Additionally, the interpretation of Volume Delta can vary depending on the market conditions. In highly volatile markets, for instance, the indicator might produce more false signals. It's also important to remember that Volume Delta should be used in conjunction with other technical analysis tools. Relying exclusively on this indicator may result in an incomplete view of the market. Therefore, traders must develop a balanced approach by integrating Volume Delta with other indicators and analysis techniques to enhance decision-making. Volume Delta may lag behind price movements. It should not be the only tool in a trader's toolkit. Interpretation can vary with market conditions. Volatile markets may produce false signals. Combining indicators leads to a more comprehensive analysis. Conclusion Volume Delta is a valuable indicator for traders looking to understand the nuances of order flow and market sentiment. By analyzing the difference between buying and selling volume, traders can gain insights that help them make informed trading decisions. While it has its limitations, when used in conjunction with other analysis techniques, Volume Delta can significantly enhance a trader's ability to anticipate market movements. As the cryptocurrency market continues to evolve, understanding indicators like Volume Delta will remain crucial for successful trading



推荐产品
HTF Candles PO3 SMC shows candles from a higher timeframe directly on your current chart, to the right of price. You can follow the forming 4H candle, or any other timeframe, while you trade on M5 or M15, without switching charts. The indicator is built for traders who use the Power of 3 concept (accumulation, manipulation and distribution) and Smart Money Concepts. Next to the candles it shows the levels that matter for this approach, so you can read the higher timeframe context at a glance. Wh
123模式 是最受欢迎,功能强大和灵活的图表模式之一。该模式由三个价格点组成:底部,峰值或谷值以及38.2%至71.8%之间的斐波纳契回撤位。当价格突破最后一个峰值或谷值时,该形态被认为是有效的,此时指标绘制箭头,发出警报并可以进行交易。 [ 安装指南 | 更新指南 | 故障排除 | 常见问题 | 所有产品 ] 清除交易信号 可自定义的颜色和尺寸 实施绩效统计 可定制的斐波那契回撤水平 显示适当的止损和获利水平 该指标可用于查找连续或反转形态 它是不可重涂和不可重涂的 它实现了电子邮件/声音/视觉警报 123模式 可以表现为连续或反转模式。为了简化操作,该指标使您可以选择要寻找哪种类型的形态,使其成为趋势或反转交易者的绝佳工具。 设置 将指标加载到任何图表时,将显示一组选项作为输入参数。如果您认为它们太多,请不要感到失望,因为参数被分组为不言自明的块。这就是每个参数块的作用。 幅度-幅度表示替代价格点之间的最小柱线量。要找到大图案,请增加幅度参数。要查找较小的模式,请减小幅度参数。 闵。回撤-形态中所需的最小斐波那契回撤。设置为零不对其进行评估。 最大。回撤-形态中可能的最大斐
KD HTF Candles
Dien Du Khanh Duong
KD HTF Candles projects transparent higher-timeframe candle bodies and wicks (e.g. M15/H1) directly onto your lower-timeframe chart, allowing you to view higher-timeframe candlestick patterns while trading a lower timeframe. Reviewing a higher-timeframe candle typically requires switching charts, which can interrupt focus on the execution timeframe. This tool displays the higher-timeframe candle directly on the lower-timeframe chart. Key Features Transparent HTF Overlay: Semi-transparent higher-
FREE
GDS Renko Entry Helper - Free Renko Price Interaction Indicator for MetaTrader 5 GDS Renko Entry Helper is a free Renko price interaction indicator for MetaTrader 5. It helps traders highlight important areas where price reacts, slows down, returns to a zone or changes behavior around support and resistance. The tool is designed for manual Renko analysis. It does not generate buy or sell signals and does not tell the trader when to enter the market. Its purpose is to help focus attention on area
SmartTrader AI Pro
Ahmed Jazlaan Mohamed
SmartTrader AI Pro Structured XAUUSD Market Analysis Based on Documented Historical Calibration Most technical indicators ask traders to trust unverifiable claims. SmartTrader AI Pro takes a different approach. The scoring weights and thresholds used by the indicator were calibrated against historical XAUUSD data using a documented and repeatable backtesting methodology. The results—including where the model demonstrated a measurable relationship with subsequent price movement and where it did n
AccountStatsPanel
Nguyen Nam Tuan
# Account Stats Panel — Professional Trading Statistics for MetaTrader 5 A complete, canvas-rendered statistics dashboard for your trading account. Track your real risk day by day: maximum equity drawdown (eDD), drawdown %, traded volume and closed profit — organized into daily and monthly tables, plus a smooth interactive profit chart. All data is measured tick-by-tick in real time and saved locally, so your statistics survive terminal restarts. ## KEY FEATURES **Live Account Info** - Leverage
SR Regression MT5 – Advanced Trend, Support/Resistance & MTF Sentiment Indicator SR Regression MT5 is a professional multi-functional trading indicator designed for traders who want to combine trend analysis, dynamic support/resistance detection, breakout signals and multi-timeframe sentiment confirmation in one powerful tool. What It Does Automatically draws Linear Regression Channels (small, medium, large trend periods) Detects and merges Support & Resistance levels Generates Buy/Sell break
Volume by price
Zhongquan Liang
成交量在交易中扮演着至关重要的角色,它是衡量市场活跃度和投资者情绪的关键指标。以下是成交量对交易的几个重要作用: 确认趋势 :道氏理论强调了成交量在确定市场趋势中的重要性。较大的成交量通常表明市场多空双方的分歧较大,而较小的成交量则可能意味着市场对当前价格的认同度较高。 捕捉主力动作 :通过一段时间的成交量分析,可以捕捉到主力资金的动向。一天的成交量可能会被操纵,但长期的成交量更能真实反映市场主力的行为。 预测价格变动 :成交量的变化往往先于价格变动。例如,价格上涨时伴随着成交量的增加,可能预示着后市将继续上涨;相反,如果价格上涨但成交量减少,则可能意味着上涨动力不足。 衡量市场活跃度 :成交量的大小可以直接反映市场的活跃程度。高成交量表明市场活跃,低成交量则可能意味着市场冷淡。 供需关系的体现 :成交量是市场供需关系的直接表现。供不应求时,成交量会放大;供过于求时,成交量会萎缩。 辅助技术分析 :在技术分析中,成交量与价格、时间和空间一起构成了分析的四大要素。成交量的分析可以帮助投资者更准确地判断市场趋势和转折点。 决策依据 :有经验的投资者会将成交量作为进出市场的依据之一。例如,带
LevelPAttern MT5 is a technical indicator based on the daily levels and Price Action patterns. The indicator is based on the standard ZigZag indicator + reversal candlestick pattens, such as Star, Hammer (also knows as Pin bar), Engulfing and others. The indicator generates audio and text notifications when a pattern is formed and a level is touched. It also supports sending email and push notifications. Indicator operation features It is suitable for working with any CFD and FOREX trading inst
产品概述 Global   Session Zones System 是一款专为   MT4   和 MT5   双平台 设计的主图辅助指标。它将无形的时 间周期转化为直观的图表语言,通过自动绘 制全球四大外汇交易时段(纽约、伦敦、 东京、悉尼)的背景框、关键价格线和统计面 板,帮助交易者精准识别市场波动范围 与趋势强度,并提供可靠的时段高低点突破信号。 核心功 能 四时段可视化 :支持自定义配置四大时段的起止时 间与颜色,以矩形背景框直观展示各 时段区间。 多维技术分析 : 可选显示时段内的线性回归趋势线、均 值线、VWAP(成交量加权平均价) 及高低点延伸线,辅助判断趋势方向。 实时状态面板 :右上角显示各时段 的活跃状态,高级模式下提供趋势强度( R²)、标准差(σ)等量化数据。 智能突破系统 :自动监测价格对时段高低点的突 破,绘制箭头信号并触发多种提醒,支持收盘确认 防抖动。 交易信 号 突破做多 (Break out Buy) :当一根 K 线的收 盘价明确向上突破某一时段(如伦敦时 段)的最高价时,系统会在该   K 线下方绘制一个向上的箭头。这标志着价格 可能脱离盘整区
PowerZones Premium MT5
Christophe Trouillas
战略区域触及x3、x4、x5次    |   TP1/TP2/TP3以 点数 或 值   |   目测检查您的风险/回报比安全性 无重绘、无延迟指标 - 适合手动和机器人交易 - 适用于所有资产和所有时间框架 限时优惠  之后恢复至 >> $99  购买后, 请联系我  获取推荐和个性化设置 [ 版本 MT5  -  MT4  | 查看我们的其他3个工具以提高胜率:TrendDECODER / PowerZONES / BladeSCALPER ] 这是什么? 我们的指标首次在图表上直观地结合了 3个概念 : 市场将测试的区域 止盈水平 风险回报比 在支撑区域(止损)和阻力区域(止盈)之间 PowerZONES 将改变您的交易习惯,帮助您 停止冲动交易 。 我们在基础支撑和阻力概念上进行了创新,增加了新功能: 区域:  比线条更符合实际交易 强度:  支撑/阻力在过去被触及的次数 区域密度:  两个区域之间的距离;密度越高,区域越多 区域颜色变化:  根据其相对于价格的位置:红色表示价格低于区域,蓝色表示价格高于区域 注意:  请注意,我们的产品 BladeSCALPER
Blahtech Market Profile MT5
Blahtech Limited
5 (10)
Was: $249  Now: $99   Market Profile defines a number of day types that can help the trader to determine market behaviour. A key feature is the Value Area, representing the range of price action where 70% of trading took place. Understanding the Value Area can give traders valuable insight into market direction and establish the higher odds trade. It is an excellent addition to any system you may be using. Inspired by Jim Dalton’s book “Mind Over Markets”, this indicator is designed to suit the
ICT Timings Macros Liquidity Map
Janardo St Jude Williamson
ICT Timings & Macros + Liquidity Map draws the full ICT session toolkit on your chart in one indicator, so you're not stacking five separate tools to see your timing framework. Everything is anchored to the 18:00 EST daily reset and fully configurable — colors, styles, widths, fonts, label positions, and history depth — down to the individual line. Session Dividers (12h / 6h / 3h) 18:00 EST-anchored vertical dividers at the 12-hour, 6-hour, and 3-hour level, each independently enabled. Every div
Anan Smart Pro
Mohammed Anan
Anan Smart Flow Pro is a premium MT5 signal indicator designed for traders who prefer structured entries, clean visual execution zones, and confirmed closed-candle signals. The indicator combines smart trend-following logic with ATR-based dynamic TP/SL levels to provide professional BUY and SELL opportunities directly on the chart. Signals are confirmed only after candle close and do not repaint on closed candles. Main Features: • Non-repainting closed-candle signals • Smart BUY / SELL entr
Get ALL my MT4 & MT5 indicators FREE — See how here Special offer : ALL TOOLS , just $35 each! New tools   will be   $30   for the   first week   or the   first 3 purchases !  Trading Tools Channel on MQL5 : Join my MQL5 channel to update the latest news from me 在当今动荡的金融交易环境中,准确识别支撑位和阻力位对于交易者做出明智决策至关重要。 Predictive Ranges Scanner Multi-TF 是一款高级工具,旨在帮助交易者对多种货币对和不同时间周期进行扫描并预测未来交易区间,从而有效且精准地识别市场趋势。 See more MT4 version at:  Predictive Ranges MT4 Scanner Multi TF See more products at:   All P roduc
WhalesTrade Pro Indicator
Emma-ekong Ben Eshiet
WHALETRADES PRO - Complete Strategy Guide Understanding Your Trading Arsenal WhalesTrade Pro is your window into the institutional side of the market. It combines three powerful trading systems into one comprehensive tool that reveals what's really happening beneath price action. The numbers changing on your chart are not random. Each one tells a specific story about market participants, their conviction, their fear, and their greed. Learning to read these numbers transforms you from a gambl

MT5 Rectangle Extender Indicator
Muhammad Shamsuddeen Muhammad
MT5 Rectangle Extender Indicator is a simple and easy tool that automatically extends any box/rectangle drawn on the chart to the right edge of the screen.  This tool can be used for easy drawing of zones and can help with determining future areas of interest on the chart once price trades back to those levels. Very suitable for supply and demand, order blocks, POI's (Points of Interest) mapping on charts. Sometimes its better to have a zone than a single price level as price can shoot above or
Order Block FVG Box
Usiola Oluwadamilol Olagundoye
Next Arrival : Flip or Die Trading Arena. Flip a trading account:  https://flipordie.com/chapter-1-thirteen-doublings-double-a-trading-account/ The Order Block FVG Box indicator for MetaTrader 5 is a powerful tool designed for discerning traders looking to identify and capitalize on high-probability trading opportunities. This indicator excels at pinpointing valid Order Blocks that are immediately followed by Fair Value Gaps (FVG), enhancing your trading strategy with precise visual cues. Key Fe
FREE
亚洲区间人人都画。Session Liquidity Sweep Stats 告诉你它通常 会怎样 。 每个交易时段的高低点在时段结束后即被追踪,每一次触碰都会在你自行固定的判定周期上得出三种答案之一:该水平被 扫荡(swept) 且价格反转、被 突破(broken) 且价格继续、或仅被触碰而当日未决。 功能 亚洲时段收盘后,其高低点绘制在图表上。伦敦时段收盘后,伦敦高低点加入。此后逐根K线监控每个水平,价格触碰的那一刻问题开启:守住还是走掉? 从触碰K线取两个参照并让它们竞速。收盘价越过该K线的 影线尖端 即为 突破 ——走势延续。收盘价回到触碰前最后一根反向K线的 开盘价 之外即为 扫荡 ——流动性被取走且价格反转。先发生者胜出。若某根K线刺穿水平并直接收于其外,则立即判定为突破。 同样的规则应用于历史数据,因此面板可显示该水平以往的表现。两个独立样本窗口并排显示——近期与更长的基准——让你看出当前市场状态是否偏离常态。 选择理由 数字与名称相符。 这里的扫荡是被收回的影线,而不只是被触及的水平 判定周期固定。 突破与扫荡都是基于收盘的判定,答案取决于所用周期。本工具在你设定的周期
HoD LoD Time Price Studies
Aurthur Musendame
4.2 (5)
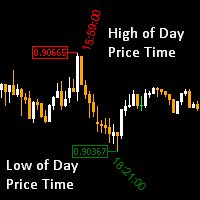
High of the Day and Low of the day Time and Price Fractal Studies is an indicator that will help you identify certain patterns that tend to repeat themseleves at certail times of the day or at certain prices.  It is used to study Daily Highs ad Lows in relation to time and price.  You will get to answer certail questions like: At what time of day does this market usually turn around. At what price does the market turn. Is it at round numbers etc
FREE
TTMM – "Time To Make Money" – Time When Traders Makes Money on the Stock Exchanges The ТТММ trade sessions indicator displays the following information: Trade sessions: American, European, Asian and Pacific. (Note: Sessions are displayed on the previous five days and the current day only. The number of days may change depending on the holidays - they are not displayed in the terminals. The sessions are also not displayed on Saturday and Sunday). The main trading hours of the stock exchanges (tim
Flat10 Trend Bias Panel is an MT5 indicator designed to aggregate multiple technical indicators into a single on-chart panel, allowing you to quickly see which direction the market is currently leaning toward (Long / Short bias) at a glance. It includes 10 indicators: OsMA, MACD, Stochastic, ADX, SAR, Aroon, Vortex, CCI, RSI, and ATR, so you can check their conditions on one screen. Each indicator can be toggled ON/OFF individually. When an indicator is turned OFF, it is not only hidden from the
Better Volume MT5
Illia Zhavarankau
1 (1)
Description: The indicator of tick volumes Better Volume MT5 allows you to assess the general mood of the market and quite accurately catch the moments of the formation of large movements. The indicator is a color histogram in an additional window. In the calculation of Better Volume MT5 the Price Action combinations are taken into account, the values of the volumes with the height of columns and color marking are displayed. Input parameters: MAPeriod - period for calculating the moving average
Pullback Hunter
Anton Polkovnikov
PULLBACK HUNTER (回调猎手) 每个交易员的终极梦想是什么?要毫不迟疑地看到反转将在哪里发生。当然,这也是一种魔法,虽然... 没有什么是不可能的。但与此同时,我为你准备了一个指标,它可以实时标记当前运动的修正结束,或者简而言之,它可以捕捉到反转的情况。什么是主旨?许多人在价格向开仓方向移动时练习反弹。他们在新极点的形成过程中这样做。一切都很好,但在这种情况下,头寸的加权平均价格并不理想。但如果我们等待回调并在趋势中买入,我们将获得一个良好的平均价格。这个指标显示了矫正运动可能结束的地方。 什么是重要的?不建议 "正面 "使用指示器。也就是说,在向上的箭头上买入,等待向下的箭头来关闭购买。指标的最佳用途是设定一个位置。通过这个额外的工具,你可以过滤你的方向,并在箭头上买入(或做空)被过滤的方向。例如,你使用累积三角洲。它向你展示了整个市场的购买情况。你等待上升的箭头,然后买入。使用额外的分析工具来退出头寸。 该指标的原理是什么?箭头是价格测试支撑或阻力水平的地方。这些水平是由指标内部的算法计算出来的。一个相同的蜡烛图可能同时测试几个支撑位。这可以通过箭头的颜色看出。如果烛
Fibrillar
Vitalii Zakharuk
It is very easy to use the Fibrillar indicator, since the simplest is to look at the chart and act according to the indications of the colored arrows. The algorithm takes into account the measurement of prices, and this method also focuses on measuring each of the price drops (H / C, H / O, LC, LO) - which gives more detailed information, but also more averaged. When calculating this indicator, logarithmic gains are first calculated at the closing price, which allows you to filter out the tren
Japanese Candlestick Indicator
Alexander Denisovich Jegorov
Simple Japanese candlestick indicator Contains 3 patterns: - bearish engulfing - bullish engulfing - doji Only contains these 3 because after rigorous testing and trading (data) these seem to be the most efficient. Also contains: - alerts if enabled  When japanese candlestick is detected it is colored with relevant color depending on bias, and also shows label next to it. Labels: - BEG = Bearish engulfing - BE = Bullish engulfing - DO = Doji
FZR indicator determines fractal zigzag reversal pattern of all the time frames of the chosen symbol and shows the information in the Info label. Indicator draws the detected pattern in the chosen time frame and also you can select in the menu to draw the trend line according to FZR peaks. What it is FZR? See the first picture in the screenshots. As you can see for every peak of FZR the AO indicator must cross zero line. FZR indicator determines the trend direction. How to use FZR for trading?
我们创新的基本烛台形态仪表盘专为自动识别图表上的盈利烛台形态而设计。该仪表盘使用先进的算法实时扫描价格图表,并检测从经典到复杂的各种烛台形态。此外,它还有一个易于使用的界面,允许您在不同的时间框架上对检测到的形态进行可视化,从而轻松做出明智的决策/ MT4 版本 免费指标:   Basic Candlestick Patterns 包括谐波形态 看涨形态 Hammer  Inverse hammer Bullish engulfing Morning star 3 White soldiers 看跌形态 Hanging man Shooting star Bearish engulfing Evening star 3 Black crows 指标列 Symbol:   将显示所选符号 Pattern:   形态类型(锤子型、反向锤子型、看涨吞没型......) Bar:   自检测到该形态以来所经过的柱状图数量 Age (in minutes):   自检测到该形态以来的年龄 主要输入 Symbols :   从 "28 种主要货币对 "或 "选定符号 "中选择。 S
Mirror Chart MT5
Andrej Hermann
5 (1)
The Mirror Chart MT5 is a overlay indicator specifically designed to project a second financial instrument directly onto the main chart window. This tool is invaluable for traders who rely on correlation analysis, as it visualizes the price movements of two different instruments in real time. Unlike traditional overlays, this indicator utilizes intelligent, dynamic centering and scaling logic. It continuously analyzes the visible price range in the current window for both symbols and calculates
FREE
Your Pointer
Nadiya Mirosh
Your Pointer is no ordinary Forex channel. This corridor is built on the basis of the analysis of several candles, starting from the last one, as a result of which the extremes of the studied interval are determined. They are the ones who create the channel lines. Like all channels, it has a middle line as well as a high and low line. This channel is worth watching for its unusual behavior. The use of the Your Pointer indicator allows the trader to react in time to the price going beyond the bo
该产品的买家也购买
Trend Sniper X
Sarvarbek Abduvoxobov
4.9 (42)
Trend Sniper X 是一款适用于 MetaTrader 5 的多周期趋势跟踪指标,可帮助交易者清晰精准地识别趋势方向和潜在的反转点。 适用于 MT4: https://www.mql5.com/en/market/product/193245 价格信息: 当前价格为促销价,随着后续更新和新功能的推出,价格可能会有所变动。 赠品优惠: 购买后联系作者,即可免费获取该指标的 Auto-Trade Assistant EA(自动交易助手 EA)。 Code2Profit 频道 通过多时间框架分析掌控市场! 如何使用 Trend Sniper X 最大化您的胜率:核心规则与交易时段技巧 技术规格 平台 MetaTrader 5 指标类型 多时间周期趋势指标 运行时间周期 任何图表时间周期,可独立选择更高的时间周期 (M1–MN1) 主要交易品种 外汇、黄金 (XAUUSD) 及其他差价合约 (CFD) 推荐账户 任何账户类型 可视化 彩色趋势蜡烛 (买入/卖出/微弱/变化) + 买入/卖出箭头 附加模块 交易时段方框 (悉尼、东京、伦敦、纽约) 主要功能 多时间周期趋势分析: 直接在
Smart Trend Trading System — MetaTrader 5 购买后,请在 MQL5 上给我发消息,即可免费获得 Smart Universal Expert Advisor,以及在线课程、PDF 手册和私人群组访问权限。 STTS 将趋势方向、入场和出场信号、反转区域及重要价格水平集中呈现在图表上。您可以根据系统手动交易,也可以连接单独的兼容 EA,按照您选择的设置自动执行交易。 一套系统,四种交易思路 STTS 将交易方法分为四大类: • 剥头皮交易 — 跟踪短期信号和市场波动。 • 趋势交易 — 评估方向,寻找趋势中的交易机会。 • 反转交易 — 识别潜在的转折区域和方向变化。 • 成交量交易 — 利用成交量相关信息评估市场活跃程度。 入场和出场箭头、趋势信息、支撑与阻力位及反转区域,帮助您直接在图表上分析交易形态。 先从一种方法开始。了解其信号和设置后,再探索其他方法。 从信号到自动化 Smart Universal Expert Advisor 可连接 STTS,让您自动执行受支持的交易信号。 启用自动交易前,请配置指标连接、仓位大小和交易管理设置
Zoryk Gold
Reda El Koutbane
4.76 (17)
折扣将在 24 小时后结束——下一价格为 69 美元 ZORYK — MetaTrader 5 专用高级 XAUUSD 黄金信号系统 你一定熟悉这种感觉。 你花了很多时间分析黄金,等待合适的入场机会。终于开仓后,价格却立刻朝相反方向移动。你过早平仓、移动止损,或者只犹豫了几秒钟。随后,市场却在没有你的情况下到达了你原本预期的目标。 问题并不总是方向判断错误。 真正的问题是缺乏确定性。 你不知道准确的入场位置在哪里。 你不知道什么时候交易逻辑已经失效。 你不知道应该先锁定较近的利润,还是继续等待更大的行情。 你也不知道当前信号是否足够强,还是自己只是在强行寻找交易机会。 黄金市场变化非常快。一个没有明确计划的好想法,可能在几秒钟内变成错误的交易决定。 ZORYK 正是为了解决这个问题而开发。 什么是 ZORYK ZORYK 是一套完整的 XAUUSD 黄金信号与交易计划系统,专门为 MetaTrader 5  和 M5 时间周期 开发。 它不是一个只显示 BUY 或 SELL 箭头,然后让你独自决定其余所有内容的简单指标。 每个确认后的信号都可以在图表上显示完整的可视化交易计划,包
SuperScalp Pro
Van Minh Nguyen
4.56 (36)
SuperScalp Pro - Professional Multi-Layer Confluence Scalping System SuperScalp Pro 是一款高级剥头皮交易指标,在经典 Supertrend 的基础上加入了多个智能确认过滤器。它可以帮助您识别概率更高的 Buy/Sell 交易机会,同时显著减少虚假信号。 清晰的 Buy 和 Sell 箭头会直接显示在图表上,基于 ATR 的 Stop Loss 和 Take Profit 水平会实时自动计算。 购买后,请联系我获取设置指导和推荐配置。 使用 SuperScalp Pro Auto Trader 轻松实现信号自动化: [Auto Trader] 下载推荐设置文件: [Set File] 完整文档请参阅产品博客: [User Guide] 加入官方频道获取最新更新: [Official Channel] 您将获得什么 SuperScalp Pro Indicator – 多层级 Buy/Sell 信号,并自动计算基于 ATR 的 Stop Loss 和 Take Profit。 免费 VM Auto SLTP
全新王者降临 - 指标 + 订单管理提示(TP1 + TP2 + TP3)+ 可选 Telegram 信号发送器 INCLUDED(免费) (完整交易与信号系统) 我们最强的黄金 EA: Gold Slayer 该指标包含先进的交易策略、可自定义订单管理系统,以及结合 Envelope 扩展的均值回归系统,并通过 RSI 等多重智能确认过滤器进行验证,以捕捉高概率反转入场机会,提供 BUY 与 SELL 信号。 你不仅能够学习如何交易,还能学会如何高效管理多个仓位,并利用之前盈利的持仓来覆盖亏损交易。 专为 M5 周期打造并优化,在 BTCUSD 和 XAUUSD 上表现尤为出色,因为这些市场的流动性能够让信号更加干净、可靠。 该指标会自动生成清晰的多头(Long)与空头(Short)信号,同时基于 ATR 自动计算入场位、止损位和止盈位,让风险管理从一开始就融入系统之中。 多 TP 系统设有三个渐进式目标位,你可以在 TP1 锁定部分利润、在 TP2 继续持仓,并在更大的行情中将仓位持有至 TP3,而这正是平均风险回报比真正开始大放异彩的地方。 默认参数开箱即用,已经针对稳定表现进行
SMC Intraday Formula
VividMind Digital Solutions
5 (26)
让我们先坦诚一点。 没有任何一个指标可以单独让你实现盈利。如果有人告诉你可以,那他是在向你兜售一个梦想。任何显示完美买卖箭头的指标都可以被做得看起来毫无瑕疵——只需要放大历史中的某一段并截取成功交易的截图。我们不会这样做。 SMC Intraday Formula 是一个工具。 它为你读取市场结构,标记出概率最高的价格区域,并用简单直白的语言准确告诉你当前智能资金的行为轨迹。你仍然需要做决定。你仍然需要执行交易。但现在,你是带着精确性执行,而不是靠希望。 我们已经在黄金(XAUUSD)以及主要外汇货币对的日内剥头皮交易中使用该指标将近三年。这是我们在 M1、M5、M15 和 M30 上的日常主力工具。它之所以有效,是因为它不试图预测未来——它展示的是当前正在形成的高概率交易机会,并解释 为什么 。 它与其他所有指标有什么不同? 大多数交易指标只做一件事。移动平均线交叉。振荡指标触及某个水平。出现一个箭头。你进场交易。你亏损。你责怪指标。重复。 SMC Intraday Formula 将多个机构级概念整合为一个统一的市场解读: - 斐波那契共振引擎 不只是普通的斐波那契水平——该指标
Entry Points Pro for MT5
Yury Orlov
4.52 (151)
传奇回归:Entry Points Pro 10。 这款传奇指标曾 3 年稳居 MQL5 Market 前三,如今全面重启。 数百条热情好评(两个版本合计 589 条),每天有数千名交易者用它交易,演示版下载 31,000+   MT4+MT5  次。 五年来我读过你们的每一条评价——在第 10 版里,我没有给出许诺,而是把答案直接做进了产品。指标作者自 1999 年入市, 珍视诚信、自己的声誉和自己的客户 。 Entry Points Pro 给出的入场信号严格不重绘。 而且这一次不再只是作者的一面之词,而是可验证的事实:确认信号只在 K 线收盘后标出,自动化测试记录到 零重绘 (在 EURUSD、XAUUSD 和 BTCUSD 上共 2,486,568 次不变量检查——0 次违规)。测试方法完全公开——您可以在策略测试器中自行复现。 购买后请务必第一时间给我发私信。 我会发给您 扩展版说明书《交易者圣经》 ——使用本指标交易的完整指南——并告诉您如何免费获得 赠品:市场扫描器 ,它能同时分析多个品种和多个时间周期,并在一个界面上显示 Entry Points Pro 此刻在哪里表现
Neuro Poseidon MT5
Daria Rezueva
4.75 (52)
Neuro Poseidon is a new indicator by Daria Rezueva. It combines precise trading signals with adaptive TP/SL levels - creating best possible trades as a result! Message me and get  Neuro Poseidon Assistant  as a gift to automize your trading process! What makes it stand out? 1. Proven profitability on all assets and timeframes 2. Only confirmed BUY and SELL signals present on the chart 3. Adaptive TP & SL levels generated by the software for each trade 4. Easy to understand - suitable for al
GoldenX Entry MT5
VividMind Digital Solutions
5 (16)
GoldenX Entry 是一款用于 MT5 的指标,包含自适应 Smart Entry Trend 算法、信号评分系统、市场状态识别器以及波动率过滤器。每个信号都包含计算得出的入场位、三个止盈位(TP1、TP2、TP3)以及止损位。它基于多个分析层构建,旨在适应不同市场条件,将多层分析系统与内置优化器及统计跟踪系统相结合。该指标基于风险收益比(RR)指标和历史交易行为提供量化分析。 开始使用非常简单——在所选时间周期上运行优化器,然后在图表上开始使用该指标。 核心功能 GoldenX Entry 将信号引擎与内置交易管理及历史统计跟踪整合在同一图表中: - 内置优化器: 优化器可在图表上单击运行。它通过两阶段搜索流程测试200种参数组合——先进行探索,再进行优化——并在完成后自动应用选定配置。结果会按时间周期缓存,因此当返回已优化的周期时,会立即恢复相同设置。 - 黄金品种自动周期识别: 将指标加载到任何 XAUUSD 图表(M1 到月线)。系统会自动识别当前周期并加载对应预设。共包含9个时间周期配置文件,专为黄金在标准周期上优化设计。切换周期时,参数会自动调整。 - 资金参考面
M5 Sniper
MeanFX
5 (3)
让您的交易优势尽在视野之中! M5 Sniper 是 MeanFX 推出的一款全新指标。它将 精准的交易信号 与 自适应 TP/SL 水平 相结合——从而创造出最佳的统计交易机会! 每售出 5 份,价格上涨一次,下一价格为 69$ 购买后请给我发消息,以获取技巧/指南和奖励 EA 它有哪些突出优势? 经过验证的统计表现 ,适用于 Gold XAUUSD( 几乎适用于每一种资产 ,专注于掌握一个时间周期,而不是试图面面俱到却无法获得稳定的结果) 每天每个交易品种 1 至 8 笔交易 ,具有较高的胜率百分比,并让所有统计优势站在我们这一边 图表上 仅显示已确认的 BUY 和 SELL 信号 自适应 TP 和 SL 水平 ,由指标针对每笔交易生成 平均胜率 75%+ 平均 Signal Ratio 最低 1.1+ 警报 和通知也会发送至 手机 **适合 Prop Firm(资金管理公司)**的交易方式 易于理解——适合 所有经验水平 的交易者 创作者提供的个人支持 100% 不重绘、不重新绘制、不滞后 奖励自动化 Expert Advisor(EA) 背后的策略: M5 Sniper 基于
Adaptive Price Action Engine 买指标,免费送EA 自适应多时间框架趋势与K线形态智能分析系统 市场环境始终在变化,不同的市场阶段中,并非所有 Price Action 形态都具有相同的参考价值。 Adaptive Price Action Engine 旨在适应不断变化的市场条件,将 趋势结构、多时间框架分析、K线形态与统计优化 整合到一个统一的分析框架中。 两种自适应模式 Dual Alpha Trend Mode(双 Alpha Trend 模式) 自动搜索适合的 Alpha Trend 参数,并结合低周期与高周期市场结构,使指标能够根据近期市场行为动态调整趋势识别。 Candlestick + Alpha Mode(K线 + Alpha 模式) 将 Alpha Trend 市场状态与 22种多空K线形态 相结合。系统不会简单地对所有形态一视同仁,而是对不同的形态组合进行统计评估,并识别在特定市场环境下表现出更强历史统计特征的配置。 主要功能 趋势参数自动优化 多时间框架市场状态分析 22种多头与空头 Price Action K线形态 对数千种可能
M1 Sniper MT5
Oleg Rodin
5 (7)
M1 SNIPER   是一款易于使用的交易指标系统。它是一个专为 M1 时间框架设计的箭头指标。该指标可以作为独立的系统在 M1 时间框架下进行剥头皮交易,也可以作为您现有交易系统的一部分使用。虽然该交易系统专为 M1 时间框架交易而设计,但它也可以用于其他时间框架。我最初设计此方法是为了交易 XAUUSD 和 BTCUSD。但我发现这种方法在其他市场交易中也同样有用。 指标信号既可以顺势交易,也可以逆势交易。我教授一种特殊的交易技巧,帮助您利用指标信号进行双向交易。该方法基于使用特殊的动态支撑位和阻力位区域。 购买后,您可以立即下载 M1 SNIPER 箭头指标。此外,我还为所有 M1 SNIPER 工具用户免费提供下方屏幕截图所示的 Apollo Dynamic SR 指标!这两个指标的组合可以帮助您更轻松、更准确地利用 M1 时间框架进行交易。 购买后请联系我,免费获取交易提示和奖励指标! 祝您交易成功!
Gann Made Easy MT5
Oleg Rodin
5 (11)
Gann Made Easy   是一个专业且易于使用的外汇交易系统,它基于使用先生理论的最佳交易原则。 W.D.江恩。该指标提供准确的买入和卖出信号,包括止损和获利水平。您甚至可以使用推送通知在旅途中进行交易。 购买后请联系我,即可免费获得交易指导和超棒的额外指标! 您可能已经多次听说过江恩交易方法。通常 Gann 的理论不仅对于新手交易者而且对于那些已经有一定交易经验的人来说都是非常复杂的东西。这是因为江恩的交易方法在理论上并不那么容易应用。我花了几年时间来完善这些知识,并将最好的原则应用到我的外汇指标中。 该指标非常易于应用。您所需要的只是将其附加到您的图表并遵循简单的交易建议。该指标不断进行市场分析工作并寻找交易机会。当它检测到一个好的入口点时,它会为您提供一个箭头信号。该指标还显示止损和获利水平。 换句话说,当您像先生一样进行交易时,该指标会为您提供最佳江恩建议。江恩亲自告诉你此时此刻该做什么。但最好的部分是您不需要了解任何有关江恩交易原则的知识,因为该指标会为您完成整个市场分析工作。
Auto Optimized SpeedAngle 是一款机构级的动量向量化系统,通过持续的前瞻优化(Walk-Forward Optimization, WFO)彻底消除了曲线拟合(curve-fitting)。该指标没有采用在市场 状态转换时容易失效的静态输入参数,而是利用出样外验证(Out-of-Sample, OOS) dynamically 动态重新校准设置,从而确保显示的 信号代表真正的统计优势,而非历史巧合。 核心机构级架构 前瞻优化引擎(Walk-Forward Optimization Engine): 核心算法持续扫描数千种回溯周期(lookback)与阈值组合,严格将数据划分为样本内(in-sample)和样本外(out-of-sample)。只有当参数配置在未知数据环境中证明具备数学优越性时,系统才会对其进行 adoption。 量化目标函数(Quantitative Objective Functions): 优化引擎不一味追求绝对毛利,而是聚焦于机构级的稳定性指标。用户可针对系统质量数(SQN)、期望值(每笔交易的平均 R 倍数)或净 R 值进行优化,从而优
ARIPoint
Temirlan Kdyrkhan
1 (4)
ARIPoint is a powerful trading companion designed to generate high-probability entry signals with dynamic TP/SL/DP levels based on volatility. Built-in performance tracking shows win/loss stats, PP1/PP2 hits, and success rates all updated live. Key Features: Buy/Sell signals with adaptive volatility bands Real-time TP/SL/DP levels based on ATR Built-in MA Filter with optional ATR/StdDev volatility Performance stats panel (Success, Profit/Loss, PP1/PP2) Alerts via popup, sound, push, or email Cu
Scalper Vault MT5
Oleg Rodin
5 (1)
Scalper Vault 是一套功能强大且配置完善的交易系统,专为追求日内交易稳定性的交易者而设计。 作为一套完整且独立的交易系统,该高精度指标能够为外汇和二元期权交易者提供机构级的市场分析。 购买后请联系我,获取我的独家交易技巧以及一份超值赠品! Scalper Vault 能够消除凭感觉交易和复杂的各种手动分析,让您只需专注于执行交易,并运用简单易行的交易技巧进行操作。 精准的顺势交易信号:其核心算法通过分析市场结构,仅在市场主导趋势的方向上提供高胜率信号,从而大幅减少错误的入场操作。 精确的顶部与底部探测:系统能够识别市场动能耗尽的状态,从而锁定潜在的反转区域。 基于江恩(Gann)理论的买卖区域:系统会自动绘制江恩数学市场点位,让您能清晰洞察大型机构交易者在何处寻求买入或卖出。 100% 不会重绘(Non-Repainting):一旦K线收盘,生成的信号便会永久固定在图表上。绝无动态偏移,绝无虚假信号——您在历史数据中所见,即为该指标的真实表现。 广泛的市场适用性:适用于各类货币对、黄金、指数以及加密货币交易。
Gold Trend Coach MT5
Cristhian Alexander Gaibor Cuasquer
5 (1)
Gold Trend Coach 是 MetaTrader 5 的黄金(XAUUSD)趋势指标,提供买入和卖出信号、止损和三个止盈目标,在 K 线收盘时确认,并配有多周期教练面板和手机和 Telegram 提醒。专为 M5 剥头皮和 M15 日内交易设计,适用于伦敦和纽约时段。 Gold Trend Coach:XAUUSD 黄金趋势信号,带入场、止损和三个目标。首发价 $39,仅限前 20 份,之后 $59。 购买后给我留言,买家套件马上发给你。 把你最长连亏直接显示在图表上的黄金指标。 这个市场上的每一个 XAUUSD 指标都会给你看它的盈利信号。Gold Trend Coach 也会给你看它的亏损信号,用红色计数,连同最长连亏和净结果一起显示在一个面板上,这个面板什么都算,而不是只算好看的。信号打到止损,你看得到。连续三个打到止损,你同样看得到。这就是约定:每个信号都有入场、止损和三个目标,以及它们真实结果的真相。 指标只提供信息,不开仓。为黄金 M5 和 M15 而设计,适用于伦敦和纽约时段。终身免费更新。 图表上你会看到什么 一次只显示一个信号。图表上只有当前这一波行情、它
Tokyo mt5 Indicator
Vasiliy Strukov
5 (10)
Tokyo Indicator(东京指标)直观地展示了趋势方向、潜在交易信号及市场状况。 其采用颜色编码的阶梯式趋势线,以蓝色标识看涨阶段,以洋红色标识看跌阶段。配套的方向箭头会在趋势发生变化时,标示出潜在的买入与卖出机会。 内置的综合仪表盘将当前信号、市场倾向、动能、波动率及信号质量整合于同一视图中,方便交易者在观察价格走势的同时评估指标数据,无需在不同面板间切换。 凭借清晰的图表显示和简洁的市场概览,Tokyo Indicator 支持以系统化的方式进行趋势分析与交易确认。 适用于任何时间周期及各类交易品种,尤其适合黄金交易。 购买后请立即联系我,以获取专属赠品!您可以免费获得我们的“强力支撑与趋势扫描”(Strong Support and Trend Scanner)指标,请私信我! 设置说明与使用手册请见此处。 请注意:我不会在 Telegram 上出售我的 EA 或特殊参数设置(set files);我的 EA 仅在 Mql5 平台上提供,而参数设置文件仅在我的博客(此处链接)上发布。请务必警惕诈骗,切勿从他人处购买任何参数设置! 设置 ShowHUD —— 在图表上显示
Entry In The Zone and SMC Multi Timeframe is a real-time market analysis tool based on Smart Money Concepts (SMC), designed to analyze market structure, price direction, and key trading zones. It supports both Single-Timeframe and Multi-Timeframe Analysis, providing a clearer view of overall market structure across multiple timeframes, with real-time BUY / SELL signals designed with a strict focus on No-Repaint principles. The signals are designed to help filter unclear setups and evaluate tradi
Trend Catcher ind mt5
Ramil Minniakhmetov
5 (18)
趨勢捕捉指標 趨勢捕捉指標結合了作者獨有的客製化自適應趨勢分析指標,用於分析市場價格趨勢。它透過過濾掉短期噪音,並專注於潛在的動能強度、波動性擴張和價格結構行為,來識別真實的市場方向。此外,它還結合了平滑和趨勢過濾等客製化指標,例如移動平均線、相對強弱指標 (RSI) 和波動率過濾器。 您可以在這裡查看實際運行情況以及我的其他產品: https://www.mql5.com/en/users/mechanic/seller 請注意,我不會在 Telegram 上出售 EA 或任何設置,那是騙局。所有設定都可以在我的部落格上免費取得。 重要提示!購買後請立即聯繫我,以獲取使用說明和額外獎勵! 請注意,我不會在 Telegram 上出售 EA 或任何設置,那是騙局。所有設定都可以在我的部落格上免費取得。
您好,交易员! 大多数散户交易者依赖于滞后的网页脚本。真正具有交易优势需要机构化的架构。 Astro AI 指标并非标准的图表叠加层。它是一个编译后的神经网络,包含两个代理,直接运行在您的终端上。 以下是该系统背后的具体技术: 1. 代理 1:分析师(图神经网络 - GNN) 市场并非孤立的价格柱;它们是相互关联的数据网络。 功能:代理 1 使用图神经网络来映射这些复杂的非线性关系。 优势:标准指标仅考虑单一的历史移动平均线,而我们的 GNN 可以实时处理深层的市场结构关系,在散户交易量发挥作用之前揭示隐藏的相关性。 2. 代理 2:执行器(近端策略优化 - PPO) 模式识别只是成功的一半。基于当前市场波动做出正确的决策,才是预测模型与滞后模型之间的区别所在。 功能:代理 2 使用 PPO(一种先进的强化学习算法)来确定最佳入场点。 优势:它持续调整交易策略,而非使用静态的“超买”或“超卖”线。它会分析当前市场状况并计算最可能的成交点。 执行桥接:通过 ONNX 集成到交易终端 如果执行速度慢,模式识别就毫无用处。我们已通过 ONNX(开放神经网络交换平台)
Divergence Bomber
Ihor Otkydach
4.89 (94)
购买该指标的每位用户将额外免费获得以下内容: 原创工具“Bomber Utility”,该工具会自动跟踪每一笔交易,设置止损和止盈点,并根据策略规则自动平仓; 适用于不同交易品种的指标设置文件(Set 文件); 三种不同风险模式下的 Bomber Utility 设置文件:“最低风险”、“平衡风险” 和 “观望策略”; 一套详细的 视频操作手册,帮助您快速完成安装、配置并开始使用本交易系统。 注意: 要获取以上所有赠品,请通过 MQL5 的私人消息系统联系卖家。 我为您介绍原创的自定义指标 “Divergence Bomber”(背离轰炸机),它是一套基于 MACD 背离交易策略 的“全功能”交易系统。 该技术指标的主要任务是识别 价格与 MACD 指标之间的背离,并发出交易信号(包括推送通知),指示未来价格可能的运动方向。平均而言,这些信号的准确率超过 98%。有关该指标如何工作的详细说明,请观看本页面上的视频演示。 该系统使用 止损订单 和 动态回撤平仓机制 来管理交易。 Divergence Bomber 指标的主要特点: 支持交易的品种: AUDCAD、AUDCHF、AUDS
Unix Scalper
Issam Kassas
4 (4)
Unix Scalper — MetaTrader 5 购买后,请在 MQL5 上给我发消息,即可免费获得 Smart Universal Expert Advisor,以及在线课程、PDF 手册和私人群组访问权限。 发现交易形态,看清交易计划,选择执行方式。 UNIX Scalper 将市场分析、BUY/SELL/WAIT 决策以及 Entry、Stop Loss、TP1 和 TP2 水平集中在一个清晰的面板中。 看清信号与交易计划 • 明确的决策:BUY、SELL 或 WAIT。 • 明确的价格水平:Entry、Stop Loss、TP1 和 TP2。 • 多时间周期概览:比较面板中各时间周期的信号。 • 辅助分析:趋势、动量、成交量、波动率、支撑与阻力,以及市场质量。 • 灵活的布局:Minimized、Compact、Standard 或 Full。 查看信号,检查价格水平,再判断该交易形态是否符合您的交易规则。 从黄金和比特币开始 建议首先使用的交易品种:XAUUSD 和 BTCUSD。 探索短期剥头皮交易和较高时间周期分析。选择历史K线范围,通过表现曲线查看所选设置
PainX GainX Blue Spike Fusion AI Advanced Synthetic Index Spike Detection Indicator for MetaTrader 5 Discover potential spike setups with a clear, organized, and professional trading interface. PainX GainX Blue Spike Fusion AI is a specialized indicator designed for traders who monitor synthetic indices and want a structured way to observe potential price spike opportunities. The indicator combines signal monitoring, market-condition analysis, visual alerts, and event tracking in one convenient

Volatility Master for MetaTrader is a real-time dashboard tool that scans up to  50 symbols  to identify high-volatility , trending markets instantly. With bullish/bearish signals, customizable alerts, and a user-friendly interface, it helps you avoid range-bound conditions and focus on high-probability trades. Clarity leads to confidence. Trade confidently and protect your capital effectively with this powerful dashboard. We don't offer free or bonus indicators in exchange of reviews from you.
Quantum TrendPulse
Bogdan Ion Puscasu
5 (26)
介绍 Quantum TrendPulse   ,这是一款终极交易工具,它将 SuperTrend   、   RSI 和 Stochastic 的强大功能整合到一个综合指标中,以最大限度地发挥您的交易潜力。该指标专为追求精准和效率的交易者而设计,可帮助您自信地识别市场趋势、动量变化以及最佳进入和退出点。 主要特点: 超级趋势整合: 轻松跟随当前的市场趋势并乘上盈利浪潮。 RSI 精度: 检测超买和超卖水平,非常适合把握市场逆转时机,可用作 SuperTrend 的过滤器 随机精度: 利用随机振荡在波动的市场中寻找隐藏的机会, 用作超级趋势的过滤器 多时间范围分析: 从 M5 到 H1 或 H4,在不同时间范围内关注市场动态。 可定制的警报: 当您的自定义交易条件得到满足时收到通知,这样您就不会错过任何交易。 无论您是新手还是经验丰富的交易员,   Quantum TrendPulse 都能为您提供所需的优势,帮助您增强策略并自信地进行交易。借助这一强大的指标,将洞察力转化为利润 — 掌控您的交易! ***购买 Quantum TrendPulse,即可免费获得 Quantum Tr
Atomic Analyst MT5
Issam Kassas
4.48 (62)
Atomic Analyst — MetaTrader 5 购买后,请在 MQL5 上给我发消息,即可免费获得 Smart Universal Expert Advisor,以及在线课程、PDF 手册和私人群组访问权限。 Atomic Analyst 将价格行为、趋势方向、入场和出场信号、止损位及多个止盈位集中呈现在图表上。 看清信号,理解交易形态 Atomic Analyst 将分析结果整理为清晰的可视化信息: • 买入和卖出箭头,用于识别潜在的入场机会。 • 止损位和多个止盈位,帮助规划交易。 • 趋势、强度和动量读数,用于评估市场方向。 • 多时间周期分析,用于比较更广泛的市场背景。 • 彩色K线和提醒,帮助您跟踪变化的市场条件。 结合辅助分析查看信号,再判断该交易形态是否符合您的交易规则。 从短期形态到更大级别的行情 您可以将 Atomic Analyst 用于剥头皮交易、日内交易,或跟踪持续时间更长的市场走势。 建议从 H1 时间周期开始。建议交易品种包括 EURUSD、AUDUSD 和 XAUUSD。 从信号到自动化 Smart Universal Expert A
Market Structure Order Block Dashboard MT5 是一款专为希望直接在图表上解读市场结构和主要价格反应区域的交易者设计的MT5指标。它结合了BOS、ChoCH、订单块(Order Blocks)、公允价值缺口(FVG)、流动性、Kill Zones、成交量分布图以及一个紧凑的面板,便于快速分析。 本指标面向使用市场结构、ICT和Smart Money概念作为决策框架的交易者。它可以帮助以更结构化的方式识别趋势延续、可能的反转、价格失衡、流动性目标和关注区域。 面向买家的资源 购买后可通过MQL5私信申请获取完整的PDF使用指南和参数配置建议。通过MQL5私信提供直接技术支持。 1.20版本带来两项重要新增: Pending BOS / Pending ChoCH 检测 和 可拖动面板 (按住面板标题栏即可将其拖动到图表任意位置,不影响图表本身)。当K线收于前一摆动点之外时,Pending Breaks 立即显示待确认的结构突破,无需等待经典的摆动确认。 重要 本产品仅为指标。它不会自动开仓、平仓或管理仓位。它不是EA(智能交易系统)。 主要功能 市场
FiboSniper Pro
Van Minh Nguyen
5 (3)
FiboSniper Pro – Multi-Filter Fibonacci System with Auto SL/TP and Control Panel FiboSniper Pro 是一款技术指标,将动态 Fibonacci Envelopes 与多个确认过滤器相结合,以生成经过筛选的 Buy 和 Sell 信号。Fibonacci 水平基于 Moving Average 和 ATR 计算,然后通过 ADX、EMA、RSI、ATR、Volume、Time 和 Candle 结构进行过滤。该指标直接在图表上显示基于 ATR 自动计算的 Stop Loss 和 Take Profit 水平,并提供交互式控制面板,以便快速调整参数。 购买后,请联系我以获取推荐的设置文件和详细使用说明。 使用 Auto Trader X 自动执行 FiboSniper Pro 信号: [Auto Trader X] 用户指南和设置文件: [Click here] 完整文档请参阅产品博客: [Click here] 加入官方频道获取最新更新: [Click here] 专为偏好结构化入场和清晰风险管理
Break and Retest Hunter
Mohamed Hassan
5 (1)
Break and Retest Hunter is a powerful MetaTrader 5 indicator designed to automatically identify support and resistance levels, breakout structures, and potential retest opportunities in real time. Bonus Indicator: After purchasing Break and Retest Hunter , contact me to receive Trade Indicator Assistant EA completely free as a bonus utility. $65 for the next 10 copies . Next price is $120.  Combining adaptive market analysis, clear BUY/SELL signals, Fibonacci-based profit targets, and a premiu
作者的更多信息
RealChannel
Vladimir Utkin
1 (1)
The indicator based on the trading channel in the MT5 trading terminal is a tool that automatically builds a channel formed by the peaks of the price chart in an upward and downward sequence. This indicator helps traders identify support and resistance levels, market trends, as well as set stop-loss and take-profit levels for optimal trade management. This version of the indicator is equipped with a basic trading logic, which can be disabled in the settings and used as an indicator for your tra
FREE
Cazador de Oro
Vladimir Utkin
Инструкция по использованию советника TrendHanter для MetaTrader 5 1. Установка советника Скопируйте файлы : Поместите файл   TrendHanter.ex5   в папку: MT5 → MQL5 → Experts Запуск советника : Откройте MT5. Перетащите   TrendHanter   из раздела «Советники» на нужный график. Во вкладке «Общие» разрешите: Автоматическую торговлю   Разрешить оповещения 2. Настройка параметров Во вкладке «Параметры» настройте: Группа параметров Ключевые настройки Описание Stochastic InpKPeriod=14 ,   InpDPeriod=3
The Tick Volume Balance indicator is created based on the tick volumes of the instrument on the selected timeframe, taking into account the trading balance of supply and demand prices. The indicator considers the nature of candle formation used in the Price Action strategy. With equal volume, a regular candle and a candle with a pattern will have a larger size and will be colored according to its pattern. I would like to note that large volume candles colored in bullish and bearish colors at t
### **User Guide for CVD Indicator Installation and Usage in MT5**   **Indicator Name:** Cumulative Volume Delta (CVD)   **Version:** 1.00   **Purpose:** Visualizes buy/sell pressure balance through volume analysis.   --- ### **Installation**   1. Download `CVD.mq5` file.   2. In MT5:      - `File` → `Open Data Folder`      - Navigate to `MQL5/Indicators`      - Paste the file into the folder.   3. Restart MT5.   4. In the "Navigator" panel:      - Right-click `CVD` → "Attach to Chart"    
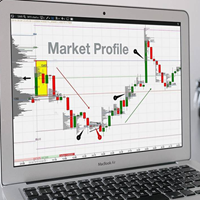
Индикаторы профиля объёма: основные понятия Определение Профиль объёма — это продвинутый индикатор технического анализа, который показывает торговую активность за условленный период времени на определённых ценовых уровнях. С учётом таких пользовательских параметров, как количество строк и период времени, индикатор строит на графике гистограмму, отражающую доминирующие или значимые ценовые уровни, основанные на объёме. По сути, профиль объёма берёт в расчёт общий объём, торгуемый на определённом
### EMA Oscillator Analysis   **Working Principle:**   1. **Main Line Calculation (BufferV):**      - Computes price deviation from adaptive EMA.      - Formula: `BufferV[i] = Close[i] - (alpha * Close[i] + (1-alpha) * BufferV[i-1])`      - Where `alpha = 2/(ema_period+1)`.   2. **Volatility Bands:**      - `BufferDev`/`BufferNegDev`: ±1 standard deviation.      - `BufferDevLimit`/`BufferNegDevLimit`: ±2 standard deviations (multiplied by `limit_factor`).      - Standard deviation is calculate
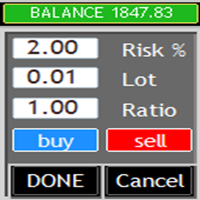
What is this?   This Expert Advisor adds a visual trading panel to MetaTrader 5 charts. Key features:   - Open/close trades with one click   - Manage Stop Loss (SL) and Take Profit (TP) levels   - Auto-apply risk settings   - Light/dark theme toggle    Interface:   1. Main panel with buttons:      - `BUY` – open buy order      - `SELL` – open sell order      - `CLOSE ALL` – close all trades      - `On/Off` – hide/show panel   2. Input fields:      - `Stop Loss (SL)` – SL distance in points  
Complete Advisor Description for MetaTrader 5 Video  https://youtu.be/7BKaf6kB-OQ?si=MB684rKT8f2f1rmv Advisor Logic The advisor uses a   dual stochastic   system: Senior timeframe   defines the trend. Junior timeframe   finds entry points. Fractal levels   build support/resistance. Signals are filtered by: Order rules ( isFreeOpen / isTwoOpen / isOneOpen ) Reverse signals ( Revers ) Stop levels based on fractals or %/pips. Key Parameters Parameter Group Parameter Description Stochastic SeniorTF
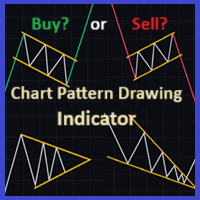
Description of the "GraphicPatternsBuilder" Indicator    Principle of Operation and Advantages:   The indicator automatically plots support (green) and resistance (red) lines on the chart, identifying key price levels. Works on any asset (cryptocurrency, stocks, Forex) and all timeframes.    Key Advantages:  1.  Automation of Routine Work  – The indicator independently identifies significant extrema and draws lines.   2.  Two Construction Algorithms :      -  Type 1 : Line is built using two
ImbalanceCandleAnalyzer: Your Algorithmic Edge on ICT Imbalances Stop Guessing. Start Trading with the Precision of Professional Smart Money. Dear Trader, if you're familiar with the ICT strategy, you know that Price Imbalances (or FVGs) are the cornerstone of high-probability entries. These are the "roadmaps" left by smart money. But manually hunting for them on the chart wastes hours, leads to missed opportunities, and human error. What if you could automate this process? The   ImbalanceCandle
RangerTrader
Vladimir Utkin
Advertising Brochure: Trading Advisor Ranger v1.02 Professional Range Trading Tool "Range Breaker" Strategy: Innovative Market Approach Ranger is an intelligent trading system based on price range breakouts with mathematically verified risk management. The algorithm combines entry precision with multi-level capital protection. TOP-10 Ranger Advantages in Ascending Effectiveness: 10. Multi-Level Deposit Protection - Automatic lot calculation based on risk percentage - Built-in volatility fi
Cazador RSI
Vladimir Utkin
Cazador RSI Expert Advisor    Technical Overview & Algorithm Description Core Trading Strategy The Cazador RSI EA implements a sophisticated   RSI-based momentum strategy   with   pyramiding/averaging   capabilities: Entry Signals: BUY Trigger : RSI crosses above 20 level (oversold bounce) SELL Trigger : RSI crosses above 80 level (overbought reversal) Multiple Timeframe Confirmation : Uses current and historical RSI values Averaging System: Dynamic Position Sizing : Lot size increases
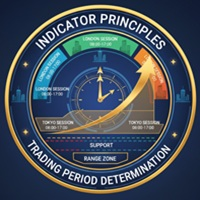
RangeZone  Indicator General Overview: Global Exchange Trading from East to West World financial markets operate on the principle of continuous trading sessions, where activity moves with the sun from one financial center to another. Understanding this dynamic is key to successful trading! How Trading Moves Around the World: Asian Session   (Sydney, Tokyo): Opens first, sets the tone for daily volatility Japanese yen, Australian dollar, Asian indices Often forms key support/resistance level
筛选:
无评论
回复评论