OrderBlocks MTF
- 指标
-
Cao Minh Quang
 Welcome to my profile. I am a developer MQL4 and MQL5.
Telegram: https://t.me/storevan
Thanks and regards! - 版本: 1.1
- 更新: 24 四月 2025
- 激活: 5
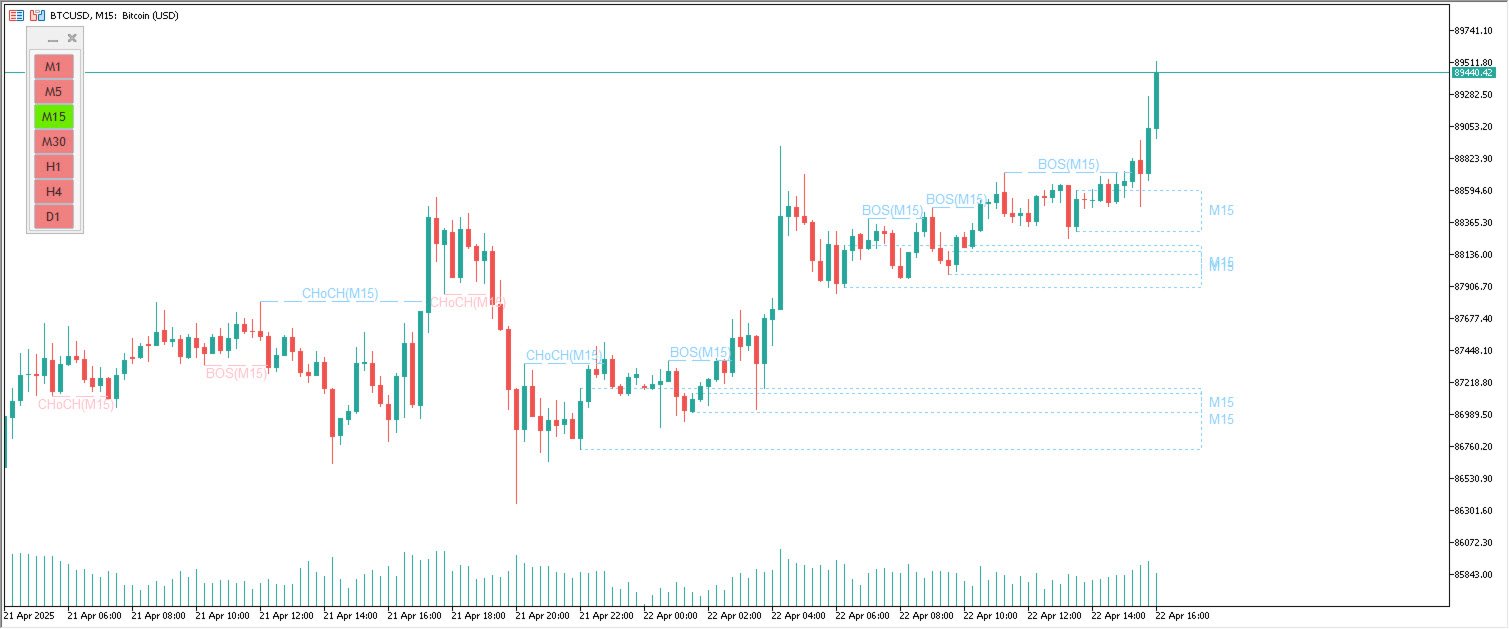
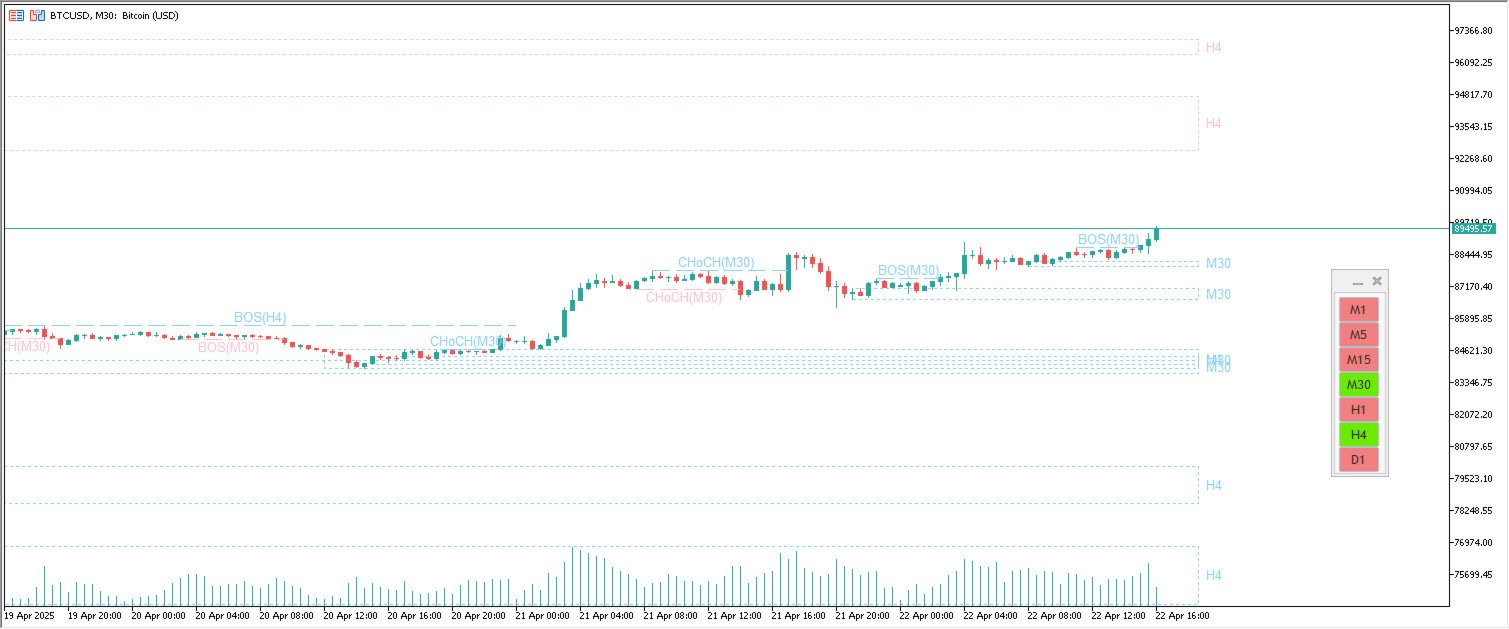
Order Block Multi Timeframe
The Order Block Multi Timeframe is a powerful tool for Smart Money Concept (SMC) traders, combining high-accuracy Order Block detection with real-time Break of Structure (BOS) and Change of Character (CHoCH) analysis across multiple timeframes.
Smart Money Insight, Multi-Timeframe Precision
This indicator automatically identifies institutional Order Blocks—key price zones where large players have entered the market—and plots them directly on your chart. It also tracks structural shifts via BOS and CHoCH to help confirm potential reversals, breakouts, or continuations.
Core Features:
-
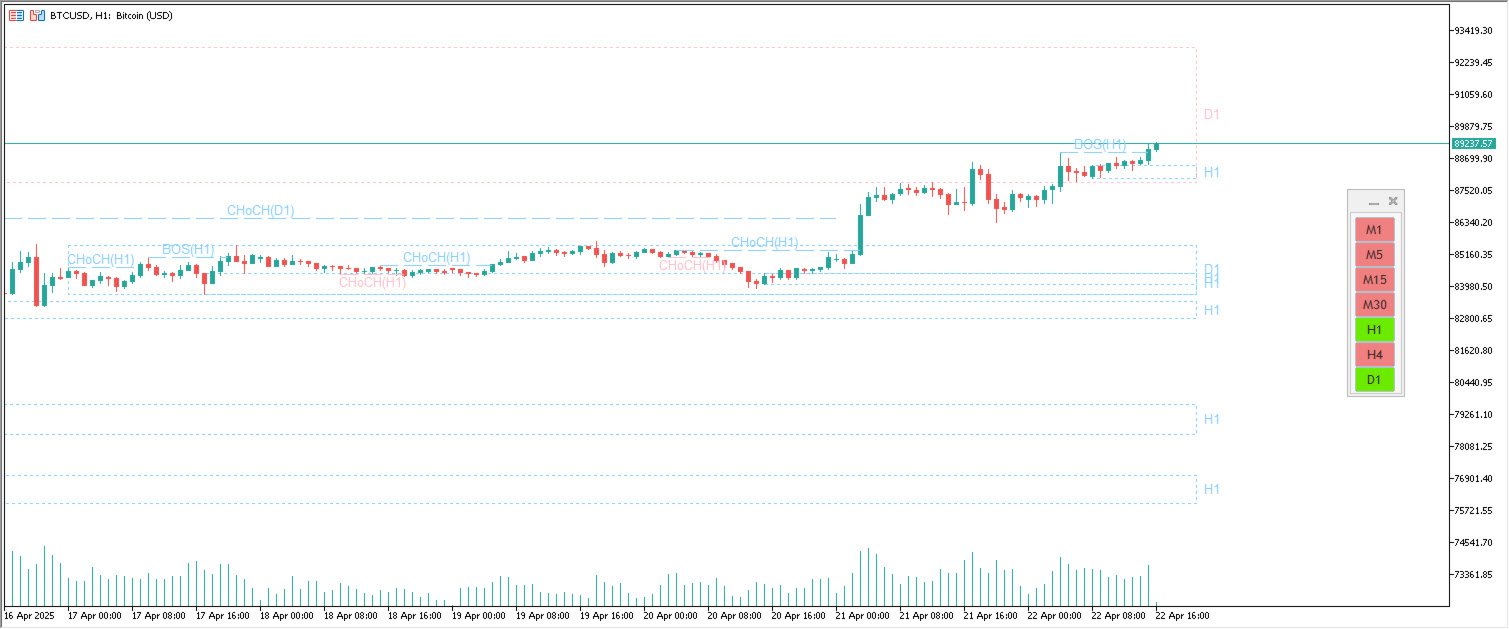
Multi-Timeframe Order Block Detection
View OBs from H1, H4, Daily, and other higher timeframes on your active chart—giving you the bigger picture at a glance. -
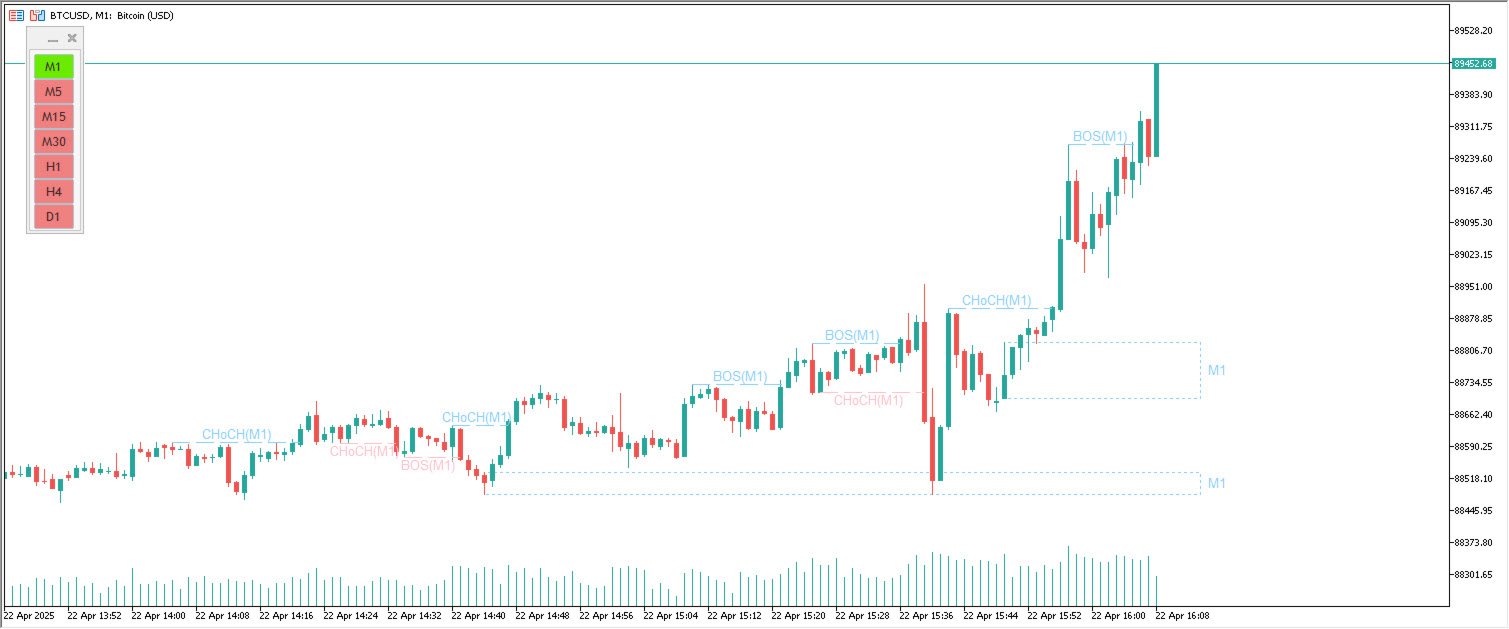
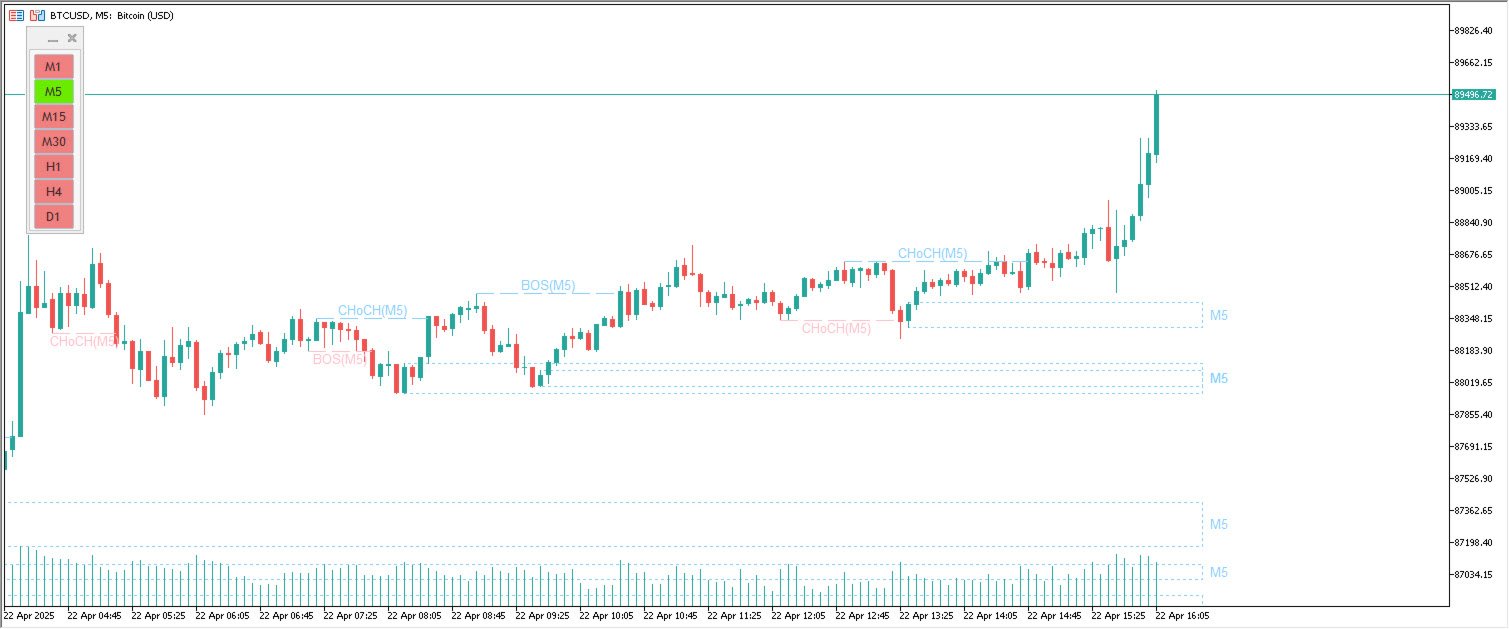
Break of Structure (BOS) & Change of Character (CHoCH)
Clearly marked BOS and CHoCH levels for structure validation, trend shifts, and trade confirmation. -
Clean Visual Markings
Color-coded OB zones and labeled structure breaks make the chart clean and easy to read—even when analyzing multiple timeframes. -
Dynamic Zone Update
Order Blocks auto-update as market structure evolves, ensuring the freshest data is always on your screen. -
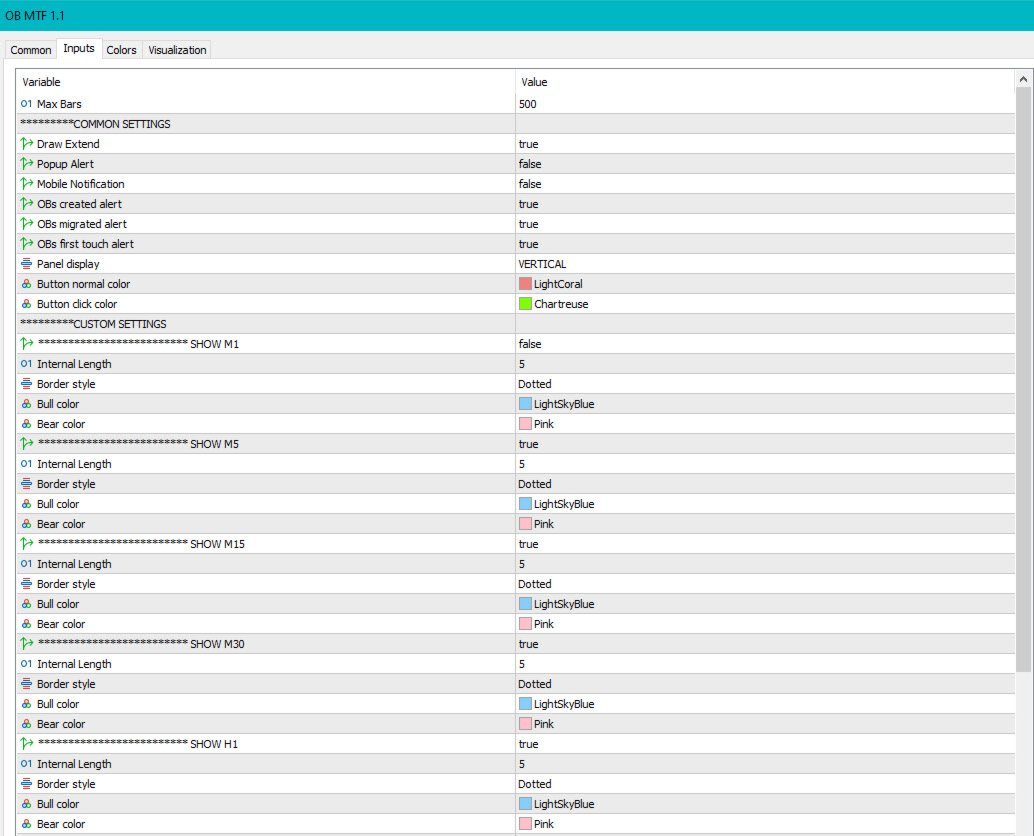
Custom Settings
Choose which timeframes to display, how far back to scan, and how to display the structure lines and labels.
Perfect For:
-
ICT/SMC-based traders
-
Price action analysts
-
Traders seeking institutional entry zones
-
Day traders and swing traders alike
Why Use This Indicator?
Order Blocks show where smart money is active. BOS and CHoCH confirm whether structure aligns with institutional intent. Together, they form one of the most reliable entry confirmation systems available to modern traders.
Get a true edge with the Order Block Multi Timeframe—where structure meets precision.