Wilders Volatility Trend Following Optimised

# Wilders Volatility Trend Following Optimised 指标文档

## 介绍

Wilders Volatility Trend Following Optimised 指标是一种用于 MetaTrader 5 的复杂趋势跟踪技术分析工具。它实现了一个高级自适应趋势跟踪系统,该系统能够动态适应市场条件,为交易者提供清晰的入场和出场信号,同时自动计算最佳止盈和止损水平。

该指标专为遵循基于趋势的策略的交易者设计,旨在通过响应市场波动性变化的自适应风险参数来优化交易管理。

## 主要特点

- **自适应趋势跟踪**:自动识别并跟踪市场趋势
- **动态仓位管理**:计算最佳入场、出场、止损和止盈水平
- **基于波动性的参数**:使用真实波幅均值(ATR)来适应市场波动性
- **自适应加速因子(AFX)**:实现加速因子之间的 S 型曲线过渡
- **平滑止盈计算**:使用双曲正切函数实现自然利润目标过渡
- **追踪止损**:实现智能追踪止损机制,锁定利润
- **视觉反馈**:提供全面的视觉元素,包括箭头、线条和文本注释
- **全局变量导出**:使关键值可用于其他指标和 EA

## 技术方法

### 趋势跟踪方法论

该指标采用基于趋势的方法,使用停止和反转(SAR)机制。它维持当前仓位(多头或空头)并跟踪显著收盘价(SIC)值,该值代表自进入当前仓位以来最有利的价格。

SAR 水平计算如下:
```
SAR = SIC - FLIP * ACC * ATR
```
其中:
- `SIC` 是显著收盘价值
- `FLIP` 是仓位方向(多头为 1,空头为 -1)
- `ACC` 是加速因子
- `ATR` 是真实波幅均值

当价格以与当前仓位相反的方向穿越 SAR 水平时,指标生成反转仓位的信号。

### 自适应加速因子(AFX)

该指标最具创新性的方面之一是自适应加速因子(AFX)计算。它使用 S 型函数创建基于价格移动的不同加速因子值之间的平滑过渡:

```
AF_X = af_start + (af_end - af_start) * sigmoid_x
```

S 型函数创建一个 S 形曲线,使过渡平滑而非突然。这种自适应方法允许指标:

1. 开始时使用更宽的止损,给交易留出呼吸空间
2. 随着交易向有利方向移动逐渐收紧
3. 一旦穿越某些阈值,通过追踪机制锁定利润
4. 通过 ATR 适应市场波动性

### 动态止盈计算

该指标实现了使用双曲正切函数的复杂止盈计算:

```
profitMultiplier = 1.0 + profitRange * transitionFactor
```

其中 `transitionFactor` 使用自定义双曲正切实现计算。这创建了一个动态止盈,它:

- 从最小水平开始(SIC_SNAP ± ATR * ACC * PROFIT_MIN)
- 逐渐增加到最大水平(SIC_SNAP ± ATR * ACC * PROFIT_MAX)
- 使用平滑过渡,基于价格从基础水平移动的距离
- 通过 ATR 值适应市场波动性

## 关键组件

### 显著收盘价(SIC)

显著收盘价(SIC)是该指标中的一个关键概念。它代表自进入当前仓位以来最有利的价格水平:

- 对于多头仓位:SIC 是自进入仓位以来的最高收盘价
- 对于空头仓位:SIC 是自进入仓位以来的最低收盘价

SIC 作为计算 SAR 水平和其他重要值的参考点。

### 真实波幅均值(ATR)

该指标使用 ATR 来测量市场波动性并相应地调整各种计算。ATR 使用平滑方法计算:

```
ATR = Alpha * TR + (1 - Alpha) * previous_ATR
```

其中:
- `TR`(真实波幅)是以下三者的最大值:当前高低范围、当前高与前一收盘价之差、当前低与前一收盘价之差
- `Alpha` 是平滑因子(默认为 1/7)

### 仓位跟踪和信号生成

该指标跟踪当前市场仓位(多头、空头或无)并基于四个条件生成信号:

1. 如果是多头仓位且当前价格小于或等于止损,切换到空头
2. 如果是空头仓位且当前价格大于或等于止损,切换到多头
3. 如果是多头仓位且当前价格小于或等于 SAR,切换到空头
4. 如果是空头仓位且当前价格大于或等于 SAR,切换到多头

当仓位变化发生时,指标会:
- 更新 SIC 和 ATR_SNAP 值
- 重置边界突破标志
- 在图表上绘制箭头和垂直线
- 更新所有视觉元素

### 边界突破机制

该指标实现了上下边界系统:

```
upperBound = SIC_SNAP + ATR_SNAP * ACC
lowerBound = SIC_SNAP - ATR_SNAP * ACC
```

当价格以有利方向突破这些边界时,指标激活只向有利方向移动的追踪止损机制,锁定利润。
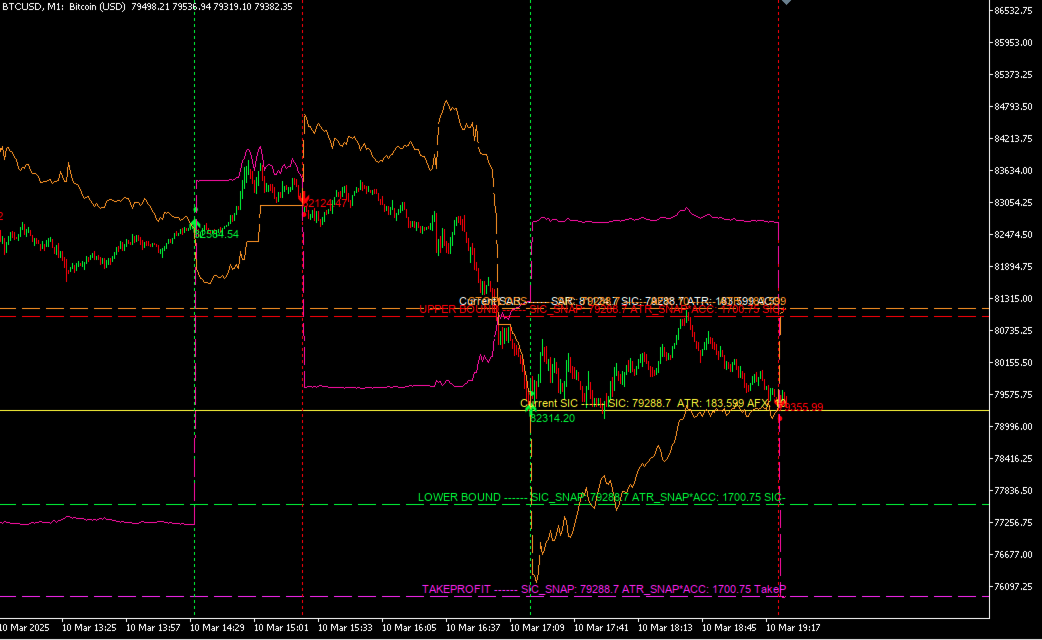
## 视觉元素

该指标在图表上创建几个视觉元素:

### 箭头和线条

- **多头/空头箭头**:绿色(多头)或红色(空头)箭头,指示仓位变化
- **SAR 线**:显示当前 SAR 水平的水平线
- **SIC 线**:显示当前显著收盘价水平的水平线
- **上/下边界线**:显示上下边界的水平线
- **止盈线**:显示计算的止盈水平的洋红色虚线
- **止损线**:显示计算的止损水平的橙色虚线
- **垂直线**:标记仓位变化点的点状垂直线

### 文本注释

该指标在图表上添加解释各种值的文本注释:

- SAR 水平和计算详情
- SIC 值和相关参数
- 上下边界值
- 止盈和止损水平及计算详情

## 输入参数

| 参数 | 默认值 | 描述 |
|-----------|---------|-------------|
| Timeframe | PERIOD_M1 | 运行指标的时间框架 |
| UseATRSnap | true | 使用 ATR 快照(true)或实时 ATR(false)进行计算 |
| UseGlobalATRTR | false | 使用全局 TF1_ATRTR_TR 和 TF1_ATRTR_ATR 变量 |
| SARLineColor | clrWhite | SAR 线颜色 |
| SICLineColor | clrYellow | SIC 线颜色 |
| ACC | 10.0 | 基础加速因子 |
| Alpha | 1.0/7.0 | ATR 平滑因子 |
| ArrowSize | 3 | 箭头符号大小 |
| LongColor | clrLime | 多头信号颜色 |
| ShortColor | clrRed | 空头信号颜色 |
| LongArrowCode | 233 | 多头箭头符号代码 |
| ShortArrowCode | 234 | 空头箭头符号代码 |
| AF_MIN | 1.0 | AFX 计算的最小加速因子 |
| AF_MAX | 15.0 | AFX 计算的最大加速因子 |
| K_Smooth | 3.0 | AFX 计算的平滑参数 |
| StopLossColor | clrOrange | 止损线颜色 |

## 全局变量

该指标导出几个可被其他指标或 EA 使用的全局变量:

| 全局变量 | 描述 |
|-----------------|-------------|
| TF_TF_O_[ChartID]_currentPrice | 当前价格 |
| TF_TF_O_[ChartID]_TR | 真实波幅值 |
| TF_TF_O_[ChartID]_ATR | 真实波幅均值 |
| TF_TF_O_[ChartID]_SIC | 显著收盘价值 |
| TF_TF_O_[ChartID]_SIC_SNAP | 仓位变化时的 SIC 值 |
| TF_TF_O_[ChartID]_ATR_SNAP | 仓位变化时的 ATR 值 |
| TF_TF_O_[ChartID]_ACC | 加速因子 |
| TF_TF_O_[ChartID]_afx | 自适应加速因子 |
| TF_TF_O_[ChartID]_FLIP | 仓位方向(1 或 -1) |
| TF_TF_O_[ChartID]_CurrentPosition | 当前仓位(多头为 1,空头为 -1) |
| TF_TF_O_[ChartID]_K | 平滑参数 |
| TF_TF_O_[ChartID]_SAR | 停止和反转水平 |
| TF_TF_O_[ChartID]_upperBound | 上边界值 |
| TF_TF_O_[ChartID]_upperBoundBreached | 指示上边界是否被突破的标志 |
| TF_TF_O_[ChartID]_lowerBound | 下边界值 |
| TF_TF_O_[ChartID]_lowerBoundBreached | 指示下边界是否被突破的标志 |
| TF_TF_O_[ChartID]_TakeProfit | 止盈水平 |
| TF_TF_O_[ChartID]_StopLoss | 止损水平 |

## 交易信号解释

### 入场信号

- **多头入场**:当价格在空头仓位时向上穿越 SAR 水平,或当价格在空头仓位时向上穿越止损水平
- **空头入场**:当价格在多头仓位时向下穿越 SAR 水平,或当价格在多头仓位时向下穿越止损水平

### 出场信号

- **多头出场**:当价格向下穿越 SAR 水平或止损水平
- **空头出场**:当价格向上穿越 SAR 水平或止损水平

### 风险管理

该指标提供适应市场条件的动态止损和止盈水平:

- **止损**:最初设置在距离 SIC 为 ATR * ACC 的距离,但随着交易进展使用 AFX 计算进行调整
- **止盈**:使用平滑过渡函数计算,从最小水平开始,随着交易向有利方向移动而增加

## 高级概念

### 基于 S 型曲线的过渡

AFX 计算使用 S 型函数创建加速因子值之间的平滑过渡:

```
sigmoid_x = ((1 / (1 + MathExp(-k * (2*normalized_x - 1)))) - (1 / (1 + MathExp(k)))) / t
```

这创建了一个 S 形曲线,避免止损水平的突然变化,提供更自然和有效的交易管理。

### 双曲正切平滑

止盈计算使用自定义双曲正切实现:

```
CustomTanh(x) = (exp2x - 1.0) / (exp2x + 1.0)
```

这为止盈水平创建平滑过渡,使其更自然和有效。

### 追踪止损实现

该指标实现了智能追踪止损机制,它:

1. 跟踪上下边界是否被突破
2. 一旦边界被突破,只允许止损向有利方向移动
3. 使用自适应加速因子(AFX)确定止损距离

## 实际使用

### 趋势跟踪策略

1. 等待指标生成多头或空头信号(箭头)
2. 按信号方向进入仓位
3. 在指标的止损水平(橙色线)设置止损
4. 在指标的止盈水平(洋红色线)设置止盈
5. 监控仓位,同时指标更新止损和止盈水平
6. 当指标生成反转信号时退出

### 与其他工具集成

该指标可与其他技术分析工具一起使用:

- **支撑/阻力水平**:用关键支撑和阻力水平确认信号
- **成交量指标**:用成交量确认验证信号
- **振荡器**:使用 RSI 或随机指标等振荡器确认超买/超卖条件

## 结论

Wilders Volatility Trend Following Optimised 指标提供了一个具有高级自适应功能的综合趋势跟踪系统。通过动态适应市场条件并提供清晰的视觉反馈,它帮助交易者识别和管理基于趋势的交易,优化风险参数。

该指标用于计算自适应加速因子、平滑止盈水平和智能追踪止损的复杂算法,使其成为寻求优化交易方法的趋势跟踪者的强大工具。

---

*Copyright 2025, TradeFlags*


推荐产品
Noize Absorption Index
Ekaterina Saltykova
Noize Absorption Index - is the manual trading system that measures the difference of pressure between bears forces and bulls forces. Green line - is a noize free index that showing curent situation. Zero value of index shows totally choppy/flat market.Values above zero level shows how powerfull bullish wave is and values below zero measures bearish forces.Up arrow appears on bearish market when it's ready to reverse, dn arrow appears on weak bullish market, as a result of reverse expectation.
Liquidity Oscillator
Paolo Scopazzo
3 (2)
A powerful oscillator that provide Buy and Sell signals by calculating the investor liquidity. The more liquidity the more buy possibilities. The less liquidity the more sell possibilities. Please download the demo and run a backtest! HOW IT WORKS: The oscillator will put buy and sell arrow on the chart in runtime only . Top value is 95 to 100 -> Investors are ready to buy and you should follow. Bottom value is 5 to 0 -> Investors are ready to sell and you should follow. Alert + sound will appe
Antique Trend
Nadiya Mirosh
The Antique Trend Indicator is a revolutionary trend trading and filtering solution with all the important features of a trend tool built into one tool! The Antique Trend indicator is good for any trader, suitable for any trader both for Forex and binary options. There is no need to configure anything, everything has been perfected by time and experience, it works great during flats and trends. The Antique Trend indicator is a tool for technical analysis of financial markets, reflecting curren
The new update makes this indicator a complete tool for studying, analyzing and operating probabilistic patterns. It includes: On-chart Multi-asset percentage monitor. Configurable martingales. Twenty-one pre-configured patterns, including Mhi patterns and C3. An advanced pattern editor to store up to 5 custom patterns. Backtest mode to test results with loss reports. Trend filter. Hit operational filter. Martingale Cycles option. Various types of strategies and alerts. Confluence between patter
Limitless MT5
Dmitriy Kashevich
Limitless MT5 is a universal indicator suitable for every beginner and experienced trader. works on all currency pairs, cryptocurrencies, raw stocks Limitless MT5 - already configured and does not require additional configuration And now the main thing Why Limitless MT5? 1 complete lack of redrawing 2 two years of testing by the best specialists in trading 3 the accuracy of correct signals exceeds 80% 4 performed well in trading during news releases Trading rules 1 buy signal - the ap
Ichimoku Aiko MTF
Michael Jonah Randriamampionontsoa
Ichimoku Aiko MTF is a collection of technical indicators that show support and resistance levels, as well as momentum and trend direction. It is a multi-timeframe indicator so you don't need to change the chart timeframe when you want to see the ichimoku clouds on a higher timeframe.  eg. The chart timeframe is M15 and you want to see on the M15 timeframe chart the H1 ichimoku indicators (the ichimoku in Metatrader can't do that) that's why you need to use Ichimoku Aiko MTF.
Master Calendar Osw
William Oswaldo Mayorga Urduy
OSW 主日历 该指标最初是为了我个人使用而创建的,但我一直在一点一点地改进它,并实现一些功能来帮助我的日常交易,如果有用的话,我们将继续实现这些功能。 日历详细信息。 >接近当前日期的移动和详细新闻日历,其中包含以下数据:日期、国家/地区、货币、新闻部门、新闻名称以及上一个、预测和当前数据。 >日历每 5 分钟自动更新一次。 >从菜单中,您可以根据重要性,通过配置新闻的颜色以及交易时段及其开始时间来选择要查看的新闻。 颜色变化 >日历有内部变色功能,如果当前值大于上一个值,则变为蓝色,否则变为红色,中性为灰色。 >根据新闻的颜色和重要性更改新闻描述文本的颜色,可从菜单进行配置。 >如果消息导致货币走强,则货币名称和国家/地区将设置为蓝色,否则为红色,中性为灰色。 (这是一个概率) 日期 >显示交易服务器的日期。 >显示当前蜡烛完成的剩余时间。 纽扣 >线条:在新闻的确切小时和分钟处创建和删除垂直线条和标志,并使用菜单的颜色。 >会话:在菜单中配置的会话时间中创建和删除垂直线以及颜色。 >开始周:移至表中一周的开始处。 >开始日:移至表中一天的开始。
Daily Active Fractals AO
Elvin Entero Tomolin
### **Product Title:** **Daily Active Fractals AO - Smart Support & Resistance**  ### **Tagline:** High-probability reversal levels validated by Momentum. Filters false breakouts automatically.   ---   ### **Description: ** Stop cluttering your charts with weak fractals. **Daily Active Fractals AO** is a professional price action tool that identifies the most significant Support and Resistance levels for the current trading day.   Unlike standard indicators, this tool doesn’t just show every
Long&Short Cointegration Analyzer An advanced tool for traders looking to profit from cointegration. Analyzes any asset pair for Long&Short strategies. What does the Long&Short Cointegration Analyzer do? Identifies cointegrated pairs that revert to the mean, ideal for profitable trades. Provides a detailed panel with statistical data for confident decisions. Works with any currency pair, on any timeframe. Find buying and selling opportunities based on cointegration. Minimize risks with a relia
Your Trend Friend
Luigi Nunes Labigalini
5 (1)
The trend is your friend! Look at the color of the indicator and trade on that direction. It does not  repaint. After each candle is closed, that's the color of the trend. You can focus on shorter faster trends or major trends, just test what's most suitable for the symbol and timeframe you trade. Simply change the "Length" parameter and the indicator will automatically adapt. You can also change the color, thickness and style of the lines. Download and give it a try! There are big movements w
Maximum Trend Arrows OT MT5
Mulweli Valdaz Makulana
STRICTLY FOR BOOM INDEX ONLY!!!!! Here I bring the Maximum Trend Arrows OT1.0 MT5 indicator. This indicator is made up of a combination of different trend indicators for entries and exits, for entries an orange arrow will paint on the chart below the current market and a red flag for closing of trades and it produces buy arrows only. When the orange arrow appears, it will appear along with it's sound to notify you. The 1H timeframe is recommended, don't use it anywhere else than on the 1H timefr
Owl Smart Levels MT5
Sergey Ermolov
4.03 (32)
MT4版本  |   FAQ Owl Smart Levels Indicator 是一個完整的交易系統,包含 Bill Williams 的高級分形、構建正確的市場波浪結構的 Valable ZigZag 以及標記準確入場水平的斐波那契水平等流行的市場分析工具 進入市場和地方獲利。 策略的详细说明 指示灯使用说明 顾问-贸易猫头鹰助手助理 私人用户聊天 ->购买后写信给我,我会将您添加到私人聊天中,您可以在那里下载所有奖金 力量在於簡單! Owl Smart Levels 交易系統非常易於使用,因此適合專業人士和剛開始研究市場並為自己選擇交易策略的人。 策略和指標中沒有隱藏的秘密公式和計算方法,所有策略指標都是公開的。 Owl Smart Levels 允許您快速查看進入交易的信號,突出顯示下訂單的水平並向您發送有關已出現信號的通知。 優點很明顯: 清楚地顯示主要和更高時間框架的趨勢方向。 指示儀器信號的出現。 標記開單、止損設置和固定利潤的水平。 沒有多餘的,只有必要的結構! ZigZag 表示全球趨勢的方向,因此也表示貿易方向。 市場反轉點的短線清楚地表明在什麼水平上構建斐波那
ROMAN5 时间突破指标自动绘制日线的支撑和阻力突破箱体。它可帮助用户识别何处进行买入、卖出。当新信号出现时,它可发出提示和声音。它还具有发送邮件功能。您的邮件地址和 SMTP 服务器设置应该在 MetaTrader 5 的 "邮箱" 标栏里的设置窗口里指定。 蓝色向上箭头 = 买。 红色向下箭头 = 卖。 您可以使用一款我的移动止损产品,来自动移动止损,并包括设置盈亏平衡。 ROMAN5 分型移动止损   ROMAN5 抛物线SAR 移动止损 ROMAN5 布林带移动止损 ROMAN5 HeikenAshi 移动止损 ROMAN5 均线移动止损 ROMAN5 高级移动止损 如果您希望尝试 EA, 参见 ROMAN5 时间突破 EA 。 版本 1.2: 发送推送通知至移动终端。
FREE
Candle Pattern Finder MT5
Pavel Zamoshnikov
4.2 (5)
This indicator searches for candlestick patterns. Its operation principle is based on Candlestick Charting Explained: Timeless Techniques for Trading Stocks and Futures by Gregory L. Morris. If a pattern is detected, the indicator displays a message at a bar closure. If you trade using the MetaTrader 4 terminal, then you can download the full analogue of the " Candle Pattern Finder for MT4 " indicator It recognizes the following patterns: Bullish/Bearish (possible settings in brackets) : Hammer
Gecko EA MT5
Profalgo Limited
5 (1)
NEW PROMO: Only a few copies copies available at 349$ Next price: 449$ Make sure to check out our " Ultimate EA combo package " in our   promo blog ! Gecko runs a simple, yet very effective, proven strategy.  It looks for important recent support and resistance levels and will trade the breakouts.  This is a "real" trading system, which means it will use a SL to protect the account.  It also means it will not use any dangerous techniques like martingale, grid or averaging down. The EA shows its
SMMA Bands Indicator
Elie Baptiste Granger
The SMMA Bands indicator is an advanced volatility-based trading tool that creates 6 dynamic support and resistance levels around an envelope formed by two Smoothed Moving Averages (SMMA).  This indicator combines the reliability of SMMA trend identification with the precision of standard deviation-based volatility bands, making it suitable for both trend-following and mean-reversion strategies. Every band has its own buffer for use in EA. feel free to make suggestions and add reviews , i will
Visual Range Directional Force Indicator
AL MOOSAWI ABDULLAH JAFFER BAQER
Range Directional Force Indicator – Designed for You to Optimize! The Range Directional Force Indicator is a cutting-edge tool designed to empower traders by visualizing market dynamics and directional strength. Built to offer insights into market trends and reversals, this indicator is an invaluable asset for traders seeking precision in their strategies. However, it is important to note that this indicator is not optimized, leaving room for you to tailor it to your unique trading preferences.
其中一个数字序列称为“森林火灾序列”。它被公认为最美丽的新序列之一。它的主要特点是该序列避免了线性趋势,即使是最短的趋势。正是这一属性构成了该指标的基础。 在分析金融时间序列时,该指标试图拒绝所有可能的趋势选项。只有当他失败时,他才会认识到趋势的存在并给出适当的信号。这种方法可以让人们正确地确定新趋势开始的时刻。然而,误报也是可能的。为了减少它们的数量,该指标添加了一个额外的过滤器。当新柱打开时会生成信号。在任何情况下都不会发生重绘。 指标参数: Applied Price   - 应用价格常数; Period Main   - 指标的主要周期,其有效值在 5 - 60 之间; Period Additional   - 附加周期,此参数的有效值为 5 - 40; Signal Filter   - 附加信号滤波器,有效值 0 - 99; Alerts   - 启用后,指示器会在出现新信号时提醒您; Send Mail   - 允许指标向电子邮件发送消息; Push   - 允许您发送 Push 消息。
Riko Trend mt5
Nadiya Mirosh
The Riko Trend indicator is a revolutionary trend trading and filtering solution with all the important features of a trend tool built into one tool! The Riko Trend indicator is good for any trader, suitable for any trader for both forex and binary options. You don’t need to configure anything, everything is perfected by time and experience, it works great during a flat and in a trend. The Riko Trend indicator is a technical analysis tool for financial markets that reflects the current price f
MTF Candles Overlay MT5
Prafull Manohar Nikam
MTF Candles Overlay - Professional Multi-Timeframe Analysis Tool (Now with Yearly Y1 timeframe!) The MTF  Candles Overlay is a powerful and visually intuitive indicator that allows traders to view candles from higher timeframes directly overlaid on their current chart. This eliminates the need to constantly switch between multiple timeframe charts, enabling faster analysis and better trading decisions. Key Features Complete Timeframe Coverage All Standard Timeframes : M1, M2, M3, M4, M5, M6, M1
Unlock the Market's Hidden Blueprint with Advanced Pattern Recognizer Tired of staring at charts, struggling to spot high-probability trading opportunities? What if you had a professional analyst scanning the markets 24/7, drawing perfect trendlines, and calculating precise profit targets for you? Introducing Advanced Pattern Recognizer for MetaTrader 5 – Your Automated Technical Analysis Powerhouse. This isn't just another indicator. It's a sophisticated algorithmic engine designed to do the he
PipFinite Breakout EDGE MT5
Karlo Wilson Vendiola
4.81 (93)
The Missing Edge You Need To Catch Breakouts Like A Pro. Follow a step-by-step system that detects the most powerful breakouts! Discover market patterns that generate massive rewards based on a proven and tested strategy. Unlock Your Serious Edge Important information here www.mql5.com/en/blogs/post/723208 The Reliable Expert Advisor Version Automate Breakout EDGE signals using "EA Breakout EDGE" Click Here Have access to the game changing strategy that will take your trading to the next l
概述 本指标是经典 Donchian 通道 的增强版,增加了多种实用的交易功能。 除了标准的三条线(最高、最低和中线),系统能够检测 突破 ,并在图表上用箭头进行可视化标记,同时只显示 与当前趋势方向相反的那条线 ,让图表更加简洁。 功能包括: 可视化信号 :突破时在图表上绘制彩色箭头 自动通知 :弹窗、Push 推送和 Email 邮件 RSI 过滤 :根据市场相对强弱验证信号 个性化设置 :颜色、线条粗细、箭头符号、RSI 阈值等 工作原理 Donchian 通道计算: 上轨线 :最近 N 根已收盘 K 线的最高价 下轨线 :最近 N 根已收盘 K 线的最低价 中线 :最高价和最低价的平均值 看涨突破 :收盘价高于上轨线 看跌突破 :收盘价低于下轨线 指标会: 绘制三条 Donchian 通道线 仅在 方向变化后的首次突破 绘制箭头 隐藏顺应趋势方向的那条线(上涨趋势: 只显示红色下轨线;下跌趋势: 只显示绿色上轨线) 可选用 RSI 过滤突破信号,减少虚假突破 支持实时发送通知 参数说明 Donchian 通道设置 indPeriod :计算通道高低点的已收盘 K 线数量 Lin
FREE
WanaScalper
Isaac Wanasolo
1 (1)
A scalping indicator based on mathematical patterns, which on average gives signals with relatively small SL, and also occasionally helps to catch big moves in the markets (more information in the video) This indicator has three main types of notifications: The first type warns of a possible/upcoming signal on the next bar The second type indicates the presence of a ready signal to enter the market/open a position The third type is for SL and TP levels - you will be notified every time price re
Gann 9 plus
Yin Zhong Peng
Gann 9+ 指标简介 江恩矩阵图( Gann Squares ),又称江恩四方图,或甘氏矩阵,它是江恩理论中最简易明确的技术分析,也是江恩一直致力使用的推算工具,堪称是江恩一生的精华和精髓。Gann 9+指标是使用矩阵图找出股票或期货的未来高点或低点。 指标输入 1 基数和步数可以默认设置为1; 2 倍数为-1时自动获得倍数,当然也可以自行填写;(价格除以倍数就是起算值) 3 多与空表示从起算点往上或往下算目标价; 4 表示要不要显示基准线; 5  价格除以倍数是起算值,是否对起算值进行四舍五入; 6 表示要展示多少个目标价。 交易方法建议: 1、画出来的线会有明显的支撑和压力,甚至是反转;突破后加仓,到达后减仓; 2、配合其它头皮和振荡指标,成功率大大增加; 3、尽量当主/辅助指标使用,但不能只看一个指标。 特别说明:此指标针对对江恩理论有一定了解的人使用。
##   ONLY GOLD ##   Тiльки Золото ## **Mercaria Professional Trading Zones - Complete Guide** ## **Mercaria Professional Trading Zones - Повний посібник** ### **How Mercaria Zones Work / Як працюють зони Mercaria** **English:** Mercaria Zones is an advanced trading indicator that identifies high-probability support and resistance areas using ZigZag extremes combined with mathematical zone calculations. The indicator works on multiple timeframes simultaneously, providing a comprehensive view
Fibaction
Abdelkhalek Orabi
Indicator Name: Fibaction – price action candle Detector Description: Fibo Signal Boxes is a powerful Smart Money Concept (SMC)-inspired indicator that auto-detects price action candles. bullish hammers and shooting stars, then draws precise Fibonacci entry zones and multiple take-profit levels directly on the chart. as for the SL personally i use 40 pips rules  Key Features: Detects bullish hammer and shooting star reversal candles. Automatically draws Fibonacci entry and TP boxes. as
Wave Trend MT5
Diego Arribas Lopez
MT4 Version Wave Trend MT5 Wave Trend is an oscillator, which helps identifing in a extremely accurate manner market reversals. The Oscillator being obove the overbought level and a cross down of the fast into the slow MA usually indicates a good SELL signal. If the oscillators is below the oversold level and the fast MA crosses over the slower MA usually highlights a good BUY signal. The Wave Trend indicator can be also used when divergences appear against the price, indicating the current move
Trade Extender
Loncey Duwarkah
5 (1)
Autonomously executes trades, overseeing the entire process from initiation to completion.  Free support via chat, email and remote assistance Originally built for XAUUSD (Gold). Settings changes for other symbols Powerful rules management Enhanced positioning features Risk Management / Dynamic lot sizing Quick Setup Symbols : XAUUSD Investment for all: Our trading bot is crafted to serve traders of all investment levels, ensuring accessibility to the forex market even for those with limited fu
该产品的买家也购买
Divergence Bomber
Ihor Otkydach
4.99 (77)
购买该指标的每位用户将额外免费获得以下内容: 原创工具“Bomber Utility”,该工具会自动跟踪每一笔交易,设置止损和止盈点,并根据策略规则自动平仓; 适用于不同交易品种的指标设置文件(Set 文件); 三种不同风险模式下的 Bomber Utility 设置文件:“最低风险”、“平衡风险” 和 “观望策略”; 一套详细的 视频操作手册,帮助您快速完成安装、配置并开始使用本交易系统。 注意: 要获取以上所有赠品,请通过 MQL5 的私人消息系统联系卖家。 我为您介绍原创的自定义指标 “Divergence Bomber”(背离轰炸机),它是一套基于 MACD 背离交易策略 的“全功能”交易系统。 该技术指标的主要任务是识别 价格与 MACD 指标之间的背离,并发出交易信号(包括推送通知),指示未来价格可能的运动方向。平均而言,这些信号的准确率超过 98%。有关该指标如何工作的详细说明,请观看本页面上的视频演示。 该系统使用 止损订单 和 动态回撤平仓机制 来管理交易。 Divergence Bomber 指标的主要特点: 支持交易的品种: AUDCAD、AUDCHF、AUDSG
ARIPoint
Temirlan Kdyrkhan
1 (1)
ARIPoint is a powerful trading companion designed to generate high-probability entry signals with dynamic TP/SL/DP levels based on volatility. Built-in performance tracking shows win/loss stats, PP1/PP2 hits, and success rates all updated live. Key Features: Buy/Sell signals with adaptive volatility bands Real-time TP/SL/DP levels based on ATR Built-in MA Filter with optional ATR/StdDev volatility Performance stats panel (Success, Profit/Loss, PP1/PP2) Alerts via popup, sound, push, or email Cu
首先,值得强调的是,这个交易工具是非重绘、非重画和非滞后的指标,非常适合专业交易。 在线课程,用户手册和演示。 智能价格行动概念指标是一个非常强大的工具,既适用于新手,也适用于经验丰富的交易者。它将超过20个有用的指标合并到一个指标中,结合了高级交易思想,如内圈交易员分析和智能资金概念交易策略。该指标侧重于智能资金概念,提供有关大型机构交易方式的见解,帮助预测它们的动向。 它在流动性分析方面尤其擅长,有助于理解机构的交易方式。它擅长预测市场趋势,并仔细分析价格波动。通过将您的交易与机构策略对齐,您可以更准确地预测市场走向。该指标多才多艺,擅长分析市场结构,识别重要的订单区块,并识别各种模式。 它擅长识别BOS和CHoCH等模式,理解动量的转变,并突出显示供需强劲的关键区域。它还擅长发现强大的不平衡,并分析价格创造更高高点或更低低点的模式。如果您使用斐波那契回撤工具,该指标可以满足您的需求。它还可以识别相等的高点和低点,分析不同的时间框架,并通过仪表板显示数据。 对于使用更高级策略的交易者,该指标提供了工具,如公平价值差指标和优惠和折扣区域的识别。它特别关注高时间框架订单区块,并
Grabber System MT5
Ihor Otkydach
5 (19)
向您介绍一款优秀的技术指标——Grabber,它是一套即开即用的“全包式”交易策略。 在一个代码中集成了强大的市场技术分析工具、交易信号(箭头)、提醒功能和推送通知。 每位购买该指标的用户还可免费获得以下内容: Grabber辅助工具:用于自动管理已开仓位 视频操作指南:逐步教学如何安装、设置和使用该指标进行交易 原创Set文件:可快速自动配置,帮助实现最佳交易效果 忘掉其他策略吧!只有Grabber能够真正激励你在交易中攀登新高峰! Grabber策略的主要特点: 交易周期:从M5到H4 适用资产:任意,但我推荐我亲自测试过的品种(GBPUSD、GBPCAD、GBPCHF、AUDCAD、AUDUSD、AUDSGD、AUDCHF、NZDUSD、NZDCAD、EURCAD、EURUSD、EURAUD、EURGBP、EURCHF、USDCAD、USDSGD) 交易时间:全天候 24/7 交易效果:我分享自己的真实交易结果,并在此教学如何操作: https://www.mql5.com/ru/market/product/134563?source=Site+Market+MT5+Indic
Quantum TrendPulse
Bogdan Ion Puscasu
5 (19)
介绍 Quantum TrendPulse   ,这是一款终极交易工具,它将 SuperTrend   、   RSI 和 Stochastic 的强大功能整合到一个综合指标中,以最大限度地发挥您的交易潜力。该指标专为追求精准和效率的交易者而设计,可帮助您自信地识别市场趋势、动量变化以及最佳进入和退出点。 主要特点: 超级趋势整合: 轻松跟随当前的市场趋势并乘上盈利浪潮。 RSI 精度: 检测超买和超卖水平,非常适合把握市场逆转时机,可用作 SuperTrend 的过滤器 随机精度: 利用随机振荡在波动的市场中寻找隐藏的机会, 用作超级趋势的过滤器 多时间范围分析: 从 M5 到 H1 或 H4,在不同时间范围内关注市场动态。 可定制的警报: 当您的自定义交易条件得到满足时收到通知,这样您就不会错过任何交易。 无论您是新手还是经验丰富的交易员,   Quantum TrendPulse 都能为您提供所需的优势,帮助您增强策略并自信地进行交易。借助这一强大的指标,将洞察力转化为利润 — 掌控您的交易! ***购买 Quantum TrendPulse,即可免费获得 Quantum Tr
Quantum Trend Sniper
Bogdan Ion Puscasu
4.74 (53)
介绍   量子趋势狙击指标 ,突破性的 MQL5 指标,正在改变您识别和交易趋势反转的方式!由拥有超过13年交易经验的资深交易员团队开发,     量子趋势狙击指标   旨在通过其创新的方式以极高的准确度识别趋势反转,将您的交易之旅推向新的高度。 ***购买量子趋势狙击指标,即可免费获得量子突破指标!*** 当量子突破指标识别出趋势反转时,它会向您发出警报和信号箭头,并建议您三个止盈水平。 它既适合新手交易者,也适合专业交易者。 量子 EA 通道:       点击这里 MT4版本:       点击这里 建议: 时间范围: 所有时间范围。为了获得最佳结果,我们建议在 M15、M30 和 H1 时间范围内使用它。 货币对:欧元兑美元、英镑兑美元、澳元兑美元、欧元兑英镑、, EURAUD,  XAUUSD 账户类型:ECN、Raw 或 Razor,点差极低 经纪时间:任意 经纪商:IC Markets、Pepperstone with Raw 和 Razor 的点差最低 建议止损:50 点 建议止盈水平:20 点、50 点和 100 点 规格: 不重漆! 最
TPSproTREND PrO MT5
Roman Podpora
4.72 (18)
立即购买 TREND PRO 并免费获得另一个高级趋势指标 如需接收,请写私人消息。 VERSION MT4     -     ИНСТРУКЦИЯ RUS       -     INSTRUCTIONS  ENG 主要功能: 准确的输入信号,无需渲染! 如果出现信号,它仍然相关!这是与重提指标的一个重要区别,重提指标可以提供信号然后改变信号,这可能导致存款资金的损失。现在您可以以更高的概率和准确度进入市场。还有一个功能是在箭头出现后为蜡烛着色,直到达到目标(止盈)或出现反转信号。 显示止损/获利区域 为了提高搜索切入点时的视觉清晰度,创建了一个模块,该模块最初显示买入/卖出区域,在该区域中搜索进入市场的最佳点。用于处理止损水平的附加智能逻辑有助于随着时间的推移减小其大小,从而降低进入交易(移动 sl)时的初始风险。 显示较高时间范围内的最小值/最大值(MTF 模式) 添加了一项功能,可以显示较高时间间隔的最小/最大校正位置,并显示趋势变化。此外,MIN/MAX 现在有编号,显示修正内容。 风险回报率 (RR) 使用指标算法,可以检测精确的入场点,平均风险回报比超过1k2。
Entry Points Pro for MT5
Yury Orlov
4.47 (136)
这款指标用于 MT5,可提供准确的入场交易信号,且无重绘。 它可应用在任何金融资产:外汇、加密货币、贵金属、股票、指数。 它将提供极其精准的评估,并告诉您何时开仓和平仓的最佳时机。 观看 视频 (6:22),其中包含一个仅处理单一信号的示例,该信号即可值回指标购价! 大多数交易者在 Entry Points Pro 指标的帮助下,在第一个交易周内即改善了他们的交易结果。 订阅我们的 Telegram 群 ! Entry Points Pro 指标的益处。 入场信号无重绘 如果信号出现,并得到确认,则它不会再消失;不像是重绘指标,它会导致重大的财产损失,因为它们可以在显示信号后再将其删除。 无差错开仓 指标算法可令您找到入场交易(买入或卖出资产)的理想时机,从而提高每位交易者的成功率。 Entry Points Pro 可操作任何资产 它允许您在 MT5 平台上交易任何经纪商的加密货币、股票、贵金属、指数、大宗商品和货币。 提供任何方向的信号 Entry Points Pro 指标提供针对任意价格走势的入场交易信号 - 上涨、下跌或横盘(横向)。 最大盈利潜力 离场信号
RelicusRoad Pro MT5
Relicus LLC
5 (24)
您购买了多少次交易指标,它们拥有 出色的回测, 真实账户表现证明 拥有惊人的数字和 各种统计数据, 但使用后您却 账户爆仓? 您不应该只相信一个信号本身,您需要知道它最初出现的原因,这正是 RelicusRoad Pro 的最佳之处! 用户手册 + 策略 + 培训视频 + 带 VIP 访问权限的私人群组 + 提供移动版本 观察市场的新方式 RelicusRoad 是 全球最强大、最好的交易指标 ,适用于外汇、期货、加密货币、股票和指数,为交易者提供发展账户所需的所有信息和工具。我们提供 技术分析 和 交易计划 ,帮助 每位交易者取得成功 ,无论是 初学者 还是 高级交易者 。 它是一个 关键交易指标 ,提供足够的信息来 预测 未来市场。我们相信一个 完整的解决方案 ,而不是图表上几个没有意义的不同指标。这是一个 一体化指标 ,显示 信号 、 箭头 + 价格行为 信息,这是 无与伦比 且 非常准确的 。   RelicusRoad 利用机器学习 (AI) 技术,为交易者提供必要的信息和工具,帮助他们成为成功的、知情的交易者。   通过领先指标预测未来价格 几乎 所有技术指标都滞后 ,
Berma Bands
Muhammad Elbermawi
5 (7)
Berma 波段 (BBs) 指标对于寻求识别和利用市场趋势的交易者来说是一种有价值的工具。通过分析价格与 BBs 之间的关系,交易者可以辨别市场是处于趋势阶段还是区间波动阶段。 访问[ Berma Home Blog ] 了解更多信息。 Berma 带由三条不同的线组成:上 Berma 带、中 Berma 带和下 Berma 带。这些线围绕价格绘制,直观地表示价格相对于整体趋势的变动。这些带之间的距离可以洞察波动性和潜在的趋势逆转。 当 Berma Bands 线相互分离时,通常表明市场正在进入横盘或区间波动时期。这表明缺乏明确的方向性。交易者可能会发现在这些时期内很难识别趋势,因此可能需要等待更清晰的趋势出现。 当 Berma Bands 线汇聚成一条线时,通常表示趋势环境强劲。这种汇聚表明存在明显的方向性偏差,因为价格波动性足以随趋势而变化。交易者可能会发现在这些时期更容易识别潜在的入场点和出场点,因为趋势的势头可以提供有利的交易机会。然而,重要的是要注意整体趋势中的潜在回调或修正。 Berma 带根据价格蜡烛图与上带和下带的相互作用提供明确的买入和卖出信号。当价格蜡烛图首
SynaptixQuant Dominance Matrix
Devie Arevalo Montemayor
5 (1)
SynaptixQuant Dominance Matrix: Institutional-Grade Market State Extraction Engineered for traders who require a data-driven view of market behaviour beyond surface-level indicators. The Synaptix Quant (SQ) Dominance Matrix is not a conventional currency strength display. Behind its intentionally streamlined interface runs a sophisticated analytical architecture designed to quantify market conditions with precision. Every output is generated through layered signal processing built to identify d
Trend Forecaster
Alexey Minkov
5 (7)
The Trend Forecaster indicator utilizes a unique proprietary algorithm to determine entry points for a breakout trading strategy. The indicator identifies price clusters, analyzes price movement near levels, and provides a signal when the price breaks through a level. The Trend Forecaster indicator is suitable for all financial assets, including currencies (Forex), metals, stocks, indices, and cryptocurrencies. You can also adjust the indicator to work on any time frames, although it is recommen
AriX
Temirlan Kdyrkhan
1 (4)
AriX Indicator for MT5 A powerful trend-following and signal-evaluation tool AriX is a custom MT5 indicator that combines Moving Averages and ATR-based risk/reward logic to generate clear buy/sell signals. It visualizes dynamic SL/TP levels, evaluates past trade outcomes, and displays win/loss statistics in a clean on-chart panel. Key features include: Buy/Sell signals based on MA crossovers ATR-based SL/TP1/TP2/TP3 levels with visual lines and labels Signal outcome tracking with real-time stat
Advanced Currency Strength28 MT5
Bernhard Schweigert
5 (3)
任何新手或专家交易者的最佳解决方案! 这个指标是一个独特的、高质量的、可负担得起的交易工具,因为我们纳入了一些专有的功能和一个新的公式。只需一个图表,你就可以读出28个外汇对的货币强度!想象一下,你的交易将如何得到改善,因为你的交易是在你的手中进行的。想象一下,你的交易将如何改善,因为你能够准确地确定新趋势或剥头皮机会的触发点? 用户手册:点击这里  https://www.mql5.com/en/blogs/post/697384 这是第一本,原版的! 不要买一个毫无价值的崇拜者的克隆品。 特别的 子窗口中的箭头显示强劲的货币势头GAP将指导你的交易! 当基础货币或报价货币处于超卖/超买区域(外盘斐波那契水平)时,在个人图表的主窗口中出现警告信号。 当货币力量从外围区间回落时,回撤/反转警报。 十字星模式的特别警报 可选择多个时间框架,以快速查看趋势! 货币强度线在所有的时间框架中都非常平稳,当使用较高的时间框架来识别总体趋势,然后使用较短的时间框架来确定精确的入口时,效果非常好。你可以根据自己的意愿选择任何时间框架。每个时间框架都由其自身进行了优化。 建立在新的基础算法
The Golden PainX and GainX Spike Indicator is a cutting-edge, AI-powered trading tool engineered exclusively for the synthetic indices market. It masterfully combines proprietary spike detection algorithms and real-time price action analysis to generate high-probability, non-repainting trade signals with exceptional accuracy. Important( Use only on  PainX 400and GainX 400 (M1 one minute timeframe) Identifies high-probability spikes with non-repainting buy/sell arrows. Automatically sets profit t
Shock Pullback
Suleiman Alhawamdah
5 (1)
简单来说,当白色数字(称为“点”)开始出现在当前蜡烛图旁边时,您就可以开始交易了。白色“点”表示当前的买入或卖出交易正在进行,并且方向正确,其白色即为标志。当白色点的移动停止并变为静态绿色时,这表示当前动能已结束。绿色数字表示以“点”为单位的总利润,无论是来自买入还是卖出交易。 此外,还可以通过指标中的其他高级专业分析工具来开仓。通过观察指标中显示的信号和颜色,您可以高精度地捕捉大量剥头皮交易机会。只需确保在测试或实时图表中理解该指标的运作方式。 适用于大多数外汇市场:非常适合交易黄金和热门指数市场——道琼斯、标普500、纳斯达克、DAX等,以及外汇货币对如欧元/美元、英镑/美元、美元/日元等众多强势货币对。也支持主要加密货币如比特币、以太坊和稳定币——非常适合在数字资产与传统市场之间进行多元化策略。 限时特价优惠。 Shock Pullback 指标在识别回调和积累区域方面是一项真正的突破。它基于完全创新的算法构建,使交易者能够轻松而清晰地识别交易机会、跟踪价格走势,并检测回调、积累区域、缺口和突破。 Shock Pullback V 3.3 新版本更新 Shock Pullbac
ARICoins
Temirlan Kdyrkhan
ARICoin is a powerful trading companion designed to generate high-probability entry signals with dynamic TP/SL/DP levels based on volatility. Built-in performance tracking shows win/loss stats, PP1/PP2 hits, and success rates all updated live. Key Features: Buy/Sell signals with adaptive volatility bands Real-time TP/SL/DP levels based on ATR Built-in MA Filter with optional ATR/StdDev volatility Performance stats panel (Success, Profit/Loss, PP1/PP2) Alerts via popup, sound, push, or email Cust
TPSpro RFI Levels MT5
Roman Podpora
4.53 (19)
俄语说明 /  英文 说明    -  MT4 版本 主要功能: 显示卖家和买家的活跃区域! 该指标显示所有正确的买入和卖出的初始脉冲水平/区域。当这些水平/区域被激活时,即开始寻找入场点的位置,水平线会改变颜色,并填充特定颜色。此外,还会显示箭头,以便更直观地了解情况。 LOGIC AI - 激活模板时显示用于搜索入口点的区域(圆圈) 为了提高视觉清晰度,添加了使用人工智能搜索入口点的显示区域的功能。 显示更高时间范围内的级别/区域(MTF 模式) 新增使用更高时间间隔显示级别/区域的功能。此外,该指标还具备自动趋势检测功能 (   TPSproTREND PRO   )。 独立的专业分步交易算法 该算法专为顺势和逆势的日内交易而设计。每个活动模板均提供详细的说明。 适用于不同的时间范围 TPSpro RFI 水平指标可用于图表上的任何时间间隔,从分钟(M1)到每月(MN)。 图形和声音警报 该指标提供图形和声音提示,让您不会错过交易信号。此外,还支持手机通知。 简单有效的活性模板扫描器 这是一个非常紧凑的主动模式扫描仪,当在一个方向上的所有时间间隔内激活模式时,它会自动发出警报并
Step into the world of Forex trading with confidence, clarity, and precision using Gold Indicator a next-generation tool engineered to take your trading performance to the next level. Whether you’re a seasoned professional or just beginning your journey in the currency markets, Gold Indicator equips you with powerful insights and help you trade smarter, not harder. Built on the proven synergy of three advanced indicators, Gold Indicator focuses exclusively on medium and long-term trends elimina
获取免费的 AUX 指标、EA 支持和完整指南,请访问 – https://www.mql5.com/en/blogs/post/763955 发现趋势。读取模式。把握入场时机。 三步只需30秒!轻松交易 — 无需分析,您的智能助手已准备好简化您的工作流程 不再因图表信息过载而困扰。 通过智能趋势偏向检测自信交易。 兼容所有货币、加密货币、股票、贵金属、指数及任意时间框架。 只需点击并执行 — 就这么简单。 非常适合希望快速清晰交易的忙碌交易者。 TPTSyncX 是一款强大的全能 MetaTrader 5 指标,可无缝同步 趋势、图形模式 与 K线触发 分析,并以清晰智能的可视化系统呈现。专为追求清晰度、精确性和速度的交易者设计,它通过结合价格行为、结构模式和市场时机工具,帮助识别高概率交易机会。 主要功能: 智能可视化显示: 自动绘制价格结构模式,并清晰标注高点高 (HH)、低点高 (HL)、高点低 (LH) 与低点低 (LL) 于图表上 — 实时展现市场结构变化与潜在反转区域,对识别趋势转换与价格突破至关重要。 动态移动平均线: 根据所选目标K线范围自动调整周期,适用于短线剥
Frontier Pivots
Nestor Jose Mendez Boza
FRONTIER PIVOTS - Geometric Levels Indicator This indicator plots support and resistance levels/ranges on the chart using mathematical calculations. It helps traders identify potential price reaction zones based on geometric patterns. Main Features: Automatically calculates and displays key price levels Plots both support and resistance lines Uses daily price data for level calculation Clean visual presentation with different colors for different level types No repainting - levels remain static
Are you ready to dominate the volatile world of synthetic indices trading? The   Golden Boom and Crash Spike Indicator  is the revolutionary MT5 indicator designed exclusively for high-stakes traders targeting explosive spikes in   Boom 300  and  Crash 300 . Optimized for the   M1 (one-minute) timeframe , this advanced tool leverages proprietary AI-driven spike detection  and precise price action analysis to generate   non-repainting buy/sell arrows   with unparalleled accuracy. Whether you're s
介绍     Quantum Breakout PRO   ,突破性的 MQL5 指标,正在改变您交易突破区域的方式!由拥有超过13年交易经验的资深交易员团队开发,     量子突破 PRO     旨在通过其创新和动态的突破区域策略将您的交易之旅推向新的高度。 量子突破指标将为您提供带有 5 个利润目标区域的突破区域的信号箭头,以及基于突破框的止损建议。 它既适合新手交易者,也适合专业交易者。 量子 EA 通道:       点击这里 重要的!购买后请私信我领取安装手册。 建议: 时间范围:M15 货币对:GBPJPY、EURJPY、USDJPY、NZDUSD、XAUUSD 账户类型:ECN、Raw 或 Razor,点差极低 经纪商时间:GMT +3 经纪商:IC Markets、Pepperstone with Raw 和 Razor 的点差最低 规格: 不重漆! 最多 5 个建议利润目标区域 建议止损水平 可定制的盒子。您可以设置自己的 Box Time Start 和 Box Time End。 接触 如果您有任何疑问或需要帮助,请通过私人消息与我联系。
Advanced Supply Demand MT5
Bernhard Schweigert
4.5 (14)
任何新手或专业交易者的最佳解决方案! 该指标是一款独特、高质量、且价格合理的交易工具,因为我们已经整合了许多专有功能和新公式。 依据此更新,您将能够显示双重时间帧区域。 您不仅可以显示一个较高的时间帧,还可以同时显示图表时间帧,加上更高的时间帧:显示嵌套时区。 供需双方所有交易者都会喜欢它。 :) 重要信息披露 高级供需的最大潜力,请访问 https://www.mql5.com/zh/blogs/post/720245   想象您的交易如何得以改善,是因为您能够精准定位入场或目标位吗? 构建于新的底层算法,它可以更轻松地识别出买卖双方之间的潜在失衡。 这是因为它以图形方式展示供需最强劲区域,及其过去的表现(显示旧区域)。 这些功能旨在帮助您更轻松地发现最佳入场区域和价位。 现在您可以针对您的交易品种和时间帧来优化和编辑区域强度! 高级供需指标适用于所有产品和时间帧。 它是一个新的公式,非常新的功能是两个区域强度函数可由用户输入进行调整! 这在交易中是一大优势。 当您学习如何使用专有功能,例如带有价格游离最小 X 因子的区域强度时,您能够判断该区域强劲与否。 供需区域用作警报触发器。
MTF Supply Demand Zones MT5
Georgios Kalomoiropoulos
5 (1)
下一代自动化供需区。适用于任何图表的创新算法。所有区域都是根据市场的价格行为动态创建的。 两种类型的警报 --> 1) 当价格触及区域时 2) 当新区域形成时 你不会再得到一个无用的指标。您将获得一个完整的交易策略和经过验证的结果。     新的功能:     价格触及供需区时发出警报     创建新的供应/需求区时发出警报     推送通知警报     以点为单位的区域宽度标签     关于 MTF 的又一个时间表。因此,现在您将能够看到高于当前 3 个时间帧,而不是高于当前 2 个时间帧     启用/禁用警报/区域/MTF 功能的按钮 您获得的优势:     消除交易中的情绪。     客观化您的交易条目。     通过高概率设置提高您的利润。     节省绘图区域的时间。     像专业人士一样交易金融市场。     任何市场的即时多时间框架分析。 你在图表上看到了什么?     蓝色和红色矩形是当前时间范围的供需区。     虚线样式线是当前上方第一个时间范围内的供需区域。     实线样式线是当前上方第二个时间范围内的
This indicator uses support and resistance, volume and some special formula to calculate the volume to filter the candles. If the volume reaches a specific value, And at the same time, Candle breaks the support/resistance line, There would be a signal and we can enter the market. Signals appear when the current candle closes. then you can enter the trade when a new candle appears. Please don't forget to follow your money management plan. MT4 Version Support/Resistance Breakout MT4 :   https:/
描述 ICSM(脉冲-修正SCOB映射器)是一个分析价格走势并识别有效脉冲、修正和SCOB(单蜡烛订单块)的指标。它是一个强大的工具,可以与任何类型的技术分析一起使用,因为它灵活、信息丰富、易于使用,并且能显著提高交易者对最具流动性的兴趣区域的认识。 设置 常规 | 视觉 颜色主题 — 定义ICSM的颜色主题。 SCOB | 视觉 显示SCOB — 启用/禁用SCOB; 标记SCOB — 代表SCOB表示的样式选项列表; SCOB颜色 — 定义SCOB的颜色; ICM | 视觉 显示ICM线 — 启用/禁用ICM(脉冲-修正映射器)线; 显示IC趋势 — 通过图表底部的彩色分隔线启用/禁用脉冲-修正趋势的可视化; 线条颜色 — 定义ICM线的颜色; 线条样式 — 定义ICM线的样式; 警报 ICM — 启用/禁用突破ICM线的警报; SCOB — 启用/禁用SCOB创建的警报; ICM+SCOB — 启用/禁用在单个脉冲/修正结束时出现SCOB的警报,该SCOB抓取ICM线的流动性。 ICM+SCOB(同一蜡烛) — 启用/禁用在抓取ICM线流动性
Advanced Market Analysis Tool. Full Documentation: Download Free Professional Education Course: After purchasing, contact me to receive access to the complete CDV Professional Training Video Course. — It will help you master CDV , Aggressive Buyer & Seller dynamics , and Volume Microstructure concepts through a clear, step-by-step learning process. Overview The Professional CDV with Aggressive Score is a comprehensive volume analysis tool that combines visual Cumulative Delta Volume (CDV)
PZ Trend Trading MT5
PZ TRADING SLU
3.8 (5)
许多盈利交易者不仅知道如何识别市场趋势,而且也能把握趋势建立后的交易机会。 Pz 趋势交易 指标设计用来在趋势行情中尽可能的赚取利润。 已建立的趋势提供了一揽子交易机会,但大多数趋势交易指标完全忽视了它们,让交易者在趋势行情时完全不知道该如何做!一般趋势指标只通知有关的趋势变化,但根本不足以得到卓越的回报. Pz 趋势交易 指标比一般趋势指标显示多达 20 倍的交易 , 因为它注重所谓的市场时机。它不仅显示当前的市场趋势,也有回调,内柱线的突破和调整。它令您在趋势回调之后介入,安全的柱线内突破金字塔加仓,以及发现潜在的反转,和已知的调整。 趋势改变 一个趋势改变在市场方向变化时发生。趋势变化在图表上用带数字的彩色圆圈显示。蓝色 (1) 信号为上涨开始, 而红色 (1) 信号为下跌开始。趋势变化并非评估当前价格动作的结果, 它意味着交易设置是不定时地。如果您正确使用本指标, 在趋势变化时, 您将将已经入场 (参看下面的调整)。 回调 但凡趋势在运动中,行情上下抖动,盈利者收割利润,且其它参与者入场。趋势回调代表好的买入机会,通常是由主力获利离场导致。如果行情在回调后回归上行, 指标将
Spike detector Rider
Francisco Mandomo Simbine
Spike Detector Rider – Intelligent Trading in Volatile Markets Introduction The Spike Detector Rider  is an advanced system for MetaTrader 5 designed to detect explosive price movements in high-volatility assets such as synthetic indices and commodities. It combines volatility filters, trend analysis, and automated risk management to provide intelligent trade confirmations. After purchase, please send me a private message via MQL5 to receive the installation manual and setup instructions. Asset
作者的更多信息
# Power Assisted Trend Following Indicator ## Overview The PowerIndicator is an implementation of the "Power Assisted Trend Following" methodology developed by Dr. Andreas A. Aigner and Walter Schrabmair. This indicator builds upon and improves J. Welles Wilder's trend following concepts by applying principles from signal analysis to financial markets. The core insight of this indicator is that successful trend following requires price movements to exceed a certain threshold (typically a mul
FREE
# 优化版威尔德趋势跟踪自动调整VIX控制专家顾问 ## 概述 优化版威尔德趋势跟踪自动调整VIX控制专家顾问是一个先进的MetaTrader 5交易系统,它实现了基于威尔斯·威尔德概念的复杂趋势跟踪策略,并结合了现代风险管理技术。这个EA结合了多种创新功能,以适应不断变化的市场条件,同时保持严格的风险控制参数。 ## 应用与优化 优化版威尔德趋势跟踪EA需要针对每种特定金融工具(标的资产)进行仔细优化,因为不同资产的市场行为可能有显著差异。使用MetaTrader策略测试器对每种工具的EA参数进行精细调整是至关重要的。 ### 优化过程 每种标的资产可能对市场条件和参数设置有不同的反应。对代表各种市场条件的历史数据进行彻底回测至关重要。以下是优化EA的详细方法: 1. **自动调整ACC功能测试** : - 测试AutoAdjustAcc = true与false的情况 - 启用时,尝试不同的AtrHigherTimeframe设置(H1、H4、H12、D1) - 优化AutoAdjustPeriod参数(范围:100-300) - 调整AtrRefreshPerio
Hidden Markov Model 4
Andreas Alois Aigner
HMM4 Indicator Documentation HMM4 Indicator Documentation Introduction The HMM4 indicator is a powerful technical analysis tool that uses a 4-Gaussian Hidden Markov Model (HMM) to identify market regimes and predict potential market direction. This indicator applies advanced statistical methods to price data, allowing traders to recognize bull and bear market conditions with greater accuracy. The indicator displays a stacked line chart in a separate window, representing the mixture weights of f
筛选:
无评论
回复评论