Wilders Volatility Trend Following Optimised

# Wilders Volatility Trend Following Optimised Gösterge Dokümantasyonu

## Giriş

Wilders Volatility Trend Following Optimised göstergesi, MetaTrader 5 için gelişmiş bir trend takip teknik analiz aracıdır. Piyasa koşullarına dinamik olarak uyum sağlayan gelişmiş bir adaptif trend takip sistemi uygular, tüccarlara net giriş ve çıkış sinyalleri sağlarken aynı zamanda optimal kar alma ve zarar durdurma seviyelerini otomatik olarak hesaplar.

Bu gösterge, trend bazlı stratejileri takip eden ve değişen piyasa oynaklığına yanıt veren adaptif risk parametreleri ile ticaret yönetimini optimize etmeyi amaçlayan tüccarlar için tasarlanmıştır.

## Temel Özellikler

- **Adaptif Trend Takibi**: Piyasa trendlerini otomatik olarak tanımlar ve takip eder
- **Dinamik Pozisyon Yönetimi**: Optimal giriş, çıkış, zarar durdurma ve kar alma seviyelerini hesaplar
- **Oynaklık Bazlı Parametreler**: Piyasa oynaklığına uyum sağlamak için Ortalama Gerçek Aralık (ATR) kullanır
- **Adaptif Hızlanma Faktörü (AFX)**: Hızlanma faktörleri arasında sigmoid tabanlı geçiş uygular
- **Pürüzsüz Kar Alma Hesaplaması**: Doğal kar hedefi geçişleri için hiperbolik tanjant fonksiyonu kullanır
- **Trailing Stop**: Karları koruyan akıllı bir trailing stop mekanizması uygular
- **Görsel Geri Bildirim**: Oklar, çizgiler ve metin açıklamaları dahil kapsamlı görsel öğeler sağlar
- **Global Değişken Dışa Aktarımı**: Anahtar değerleri diğer göstergeler ve EA'lar için kullanılabilir hale getirir

## Teknik Yaklaşım

### Trend Takip Metodolojisi

Gösterge, Dur ve Tersine Çevir (SAR) mekanizması kullanan trend bazlı bir yaklaşım izler. Mevcut pozisyonu (uzun veya kısa) korur ve mevcut pozisyona girişten bu yana en avantajlı fiyatı temsil eden Önemli Kapanış (SIC) değerini takip eder.

SAR seviyesi şu şekilde hesaplanır:
```
SAR = SIC - FLIP * ACC * ATR
```
Burada:
- `SIC` Önemli Kapanış değeridir
- `FLIP` pozisyon yönüdür (uzun için 1, kısa için -1)
- `ACC` Hızlanma Faktörüdür
- `ATR` Ortalama Gerçek Aralıktır

Fiyat, mevcut pozisyonun ters yönünde SAR seviyesini geçtiğinde, gösterge pozisyonu tersine çevirmek için bir sinyal üretir.

### Adaptif Hızlanma Faktörü (AFX)

Bu göstergenin en yenilikçi yönlerinden biri, Adaptif Hızlanma Faktörü (AFX) hesaplamasıdır. Bu, fiyat hareketine dayalı olarak farklı hızlanma faktörü değerleri arasında pürüzsüz bir geçiş oluşturmak için sigmoid fonksiyonu kullanır:

```
AF_X = af_start + (af_end - af_start) * sigmoid_x
```

Sigmoid fonksiyonu, geçişleri ani değil pürüzsüz hale getiren S şeklinde bir eğri oluşturur. Bu adaptif yaklaşım, göstergenin şunları yapmasına olanak tanır:

1. İşlemlere nefes alma alanı vermek için daha geniş stoplarla başlamak
2. İşlem avantajlı hareket ettikçe kademeli olarak sıkılaştırmak
3. Belirli eşikleri aştıktan sonra trailing mekanizması ile karları korumak
4. ATR aracılığıyla piyasa oynaklığına uyum sağlamak

### Dinamik Kar Alma Hesaplaması

Gösterge, hiperbolik tanjant fonksiyonu kullanan sofistike bir kar alma hesaplaması uygular:

```
profitMultiplier = 1.0 + profitRange * transitionFactor
```

Burada `transitionFactor` özel bir hiperbolik tanjant uygulaması kullanılarak hesaplanır. Bu, şu özelliklere sahip dinamik bir kar alma oluşturur:

- Minimum seviyeden başlar (SIC_SNAP ± ATR * ACC * PROFIT_MIN)
- Maksimum seviyeye doğru kademeli olarak artar (SIC_SNAP ± ATR * ACC * PROFIT_MAX)
- Fiyatın temel seviyeden ne kadar uzaklaştığına bağlı olarak pürüzsüz bir geçiş kullanır
- ATR değeri aracılığıyla piyasa oynaklığına uyum sağlar

## Temel Bileşenler

### Önemli Kapanış (SIC)

Önemli Kapanış (SIC), bu göstergedeki anahtar bir kavramdır. Mevcut pozisyona girişten bu yana en avantajlı fiyat seviyesini temsil eder:

- Uzun pozisyonlar için: SIC, pozisyona girişten bu yana en yüksek kapanış fiyatıdır
- Kısa pozisyonlar için: SIC, pozisyona girişten bu yana en düşük kapanış fiyatıdır

SIC, SAR seviyesi ve diğer önemli değerleri hesaplamak için bir referans noktası görevi görür.

### Ortalama Gerçek Aralık (ATR)

Gösterge, piyasa oynaklığını ölçmek ve çeşitli hesaplamaları buna göre ölçeklendirmek için ATR kullanır. ATR, yumuşatma yaklaşımı kullanılarak hesaplanır:

```
ATR = Alpha * TR + (1 - Alpha) * previous_ATR
```

Burada:
- `TR` (Gerçek Aralık), şunların maksimumudur: mevcut yüksek-düşük aralığı, mevcut yüksek-önceki kapanış veya mevcut düşük-önceki kapanış
- `Alpha` yumuşatma faktörüdür (varsayılan 1/7)

### Pozisyon Takibi ve Sinyal Üretimi

Gösterge, mevcut piyasa pozisyonunu (uzun, kısa veya yok) takip eder ve dört koşula dayalı olarak sinyaller üretir:

1. Uzun pozisyon ve mevcut fiyat Zarar Durdurma'ya eşit veya altındaysa, kısaya geç
2. Kısa pozisyon ve mevcut fiyat Zarar Durdurma'ya eşit veya üstündeyse, uzuna geç
3. Uzun pozisyon ve mevcut fiyat SAR'a eşit veya altındaysa, kısaya geç
4. Kısa pozisyon ve mevcut fiyat SAR'a eşit veya üstündeyse, uzuna geç

Pozisyon değişikliği meydana geldiğinde, gösterge şunları yapar:
- SIC ve ATR_SNAP değerlerini günceller
- Sınır kırılma bayraklarını sıfırlar
- Grafikte oklar ve dikey çizgiler çizer
- Tüm görsel öğeleri günceller

### Sınır Kırılma Mekanizması

Gösterge, üst ve alt sınır sistemi uygular:

```
upperBound = SIC_SNAP + ATR_SNAP * ACC
lowerBound = SIC_SNAP - ATR_SNAP * ACC
```

Fiyat bu sınırları avantajlı bir yönde kırdığında, gösterge sadece avantajlı yönde hareket eden bir trailing stop mekanizmasını etkinleştirir, böylece karları korur.
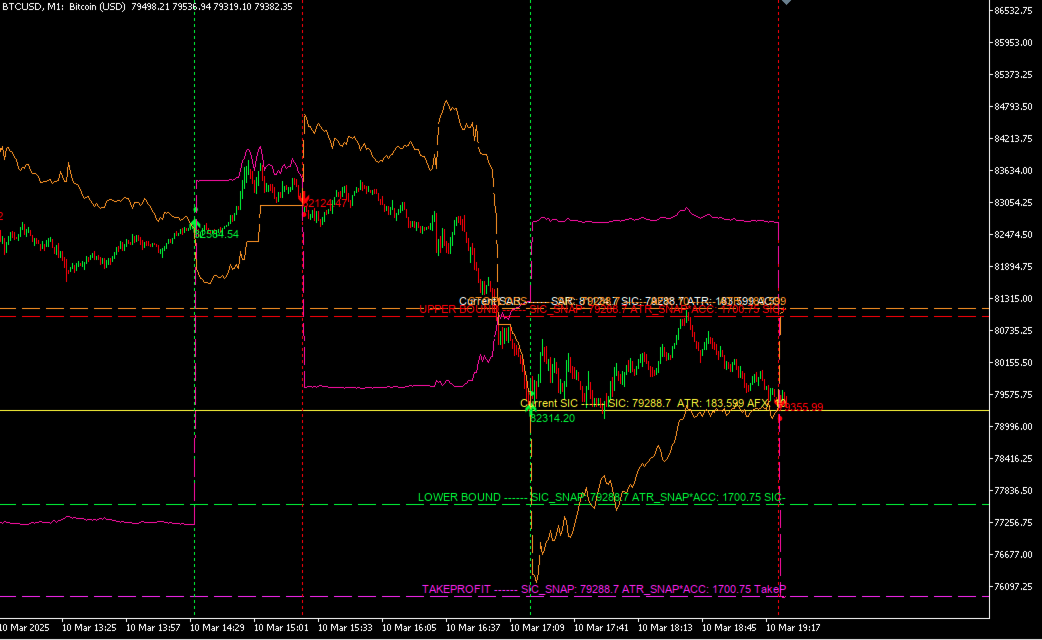
## Görsel Öğeler

Gösterge, grafikte çeşitli görsel öğeler oluşturur:

### Oklar ve Çizgiler

- **Uzun/Kısa Oklar**: Pozisyon değişikliklerini gösteren yeşil (uzun) veya kırmızı (kısa) oklar
- **SAR Çizgisi**: Mevcut SAR seviyesini gösteren yatay çizgi
- **SIC Çizgisi**: Mevcut Önemli Kapanış seviyesini gösteren yatay çizgi
- **Üst/Alt Sınır Çizgileri**: Üst ve alt sınırları gösteren yatay çizgiler
- **Kar Alma Çizgisi**: Hesaplanan kar alma seviyesini gösteren macenta kesikli çizgi
- **Zarar Durdurma Çizgisi**: Hesaplanan zarar durdurma seviyesini gösteren turuncu kesikli çizgi
- **Dikey Çizgiler**: Pozisyon değişim noktalarını işaretleyen noktalı dikey çizgiler

### Metin Açıklamaları

Gösterge, grafiğe çeşitli değerleri açıklayan metin açıklamaları ekler:

- SAR seviyesi ve hesaplama detayları
- SIC değeri ve ilgili parametreler
- Üst ve alt sınır değerleri
- Kar alma ve zarar durdurma seviyeleri ile hesaplama detayları

## Giriş Parametreleri

| Parametre | Varsayılan | Açıklama |
|-----------|---------|-------------|
| Timeframe | PERIOD_M1 | Göstergenin çalışacağı zaman dilimi |
| UseATRSnap | true | Hesaplamalar için ATR anlık görüntüsü (true) veya Canlı ATR (false) kullanımı |
| UseGlobalATRTR | false | Global TF1_ATRTR_TR ve TF1_ATRTR_ATR değişkenlerini kullan |
| SARLineColor | clrWhite | SAR çizgisi rengi |
| SICLineColor | clrYellow | SIC çizgisi rengi |
| ACC | 10.0 | Temel Hızlanma Faktörü |
| Alpha | 1.0/7.0 | ATR yumuşatma faktörü |
| ArrowSize | 3 | Ok sembollerinin boyutu |
| LongColor | clrLime | Uzun sinyaller için renk |
| ShortColor | clrRed | Kısa sinyaller için renk |
| LongArrowCode | 233 | Uzun ok sembol kodu |
| ShortArrowCode | 234 | Kısa ok sembol kodu |
| AF_MIN | 1.0 | AFX hesaplaması için minimum hızlanma faktörü |
| AF_MAX | 15.0 | AFX hesaplaması için maksimum hızlanma faktörü |
| K_Smooth | 3.0 | AFX hesaplaması için yumuşatma parametresi |
| StopLossColor | clrOrange | Zarar Durdurma çizgisi rengi |

## Global Değişkenler

Gösterge, diğer göstergeler veya EA'lar tarafından kullanılabilecek çeşitli global değişkenleri dışa aktarır:

| Global Değişken | Açıklama |
|-----------------|-------------|
| TF_TF_O_[ChartID]_currentPrice | Mevcut fiyat |
| TF_TF_O_[ChartID]_TR | Gerçek Aralık değeri |
| TF_TF_O_[ChartID]_ATR | Ortalama Gerçek Aralık değeri |
| TF_TF_O_[ChartID]_SIC | Önemli Kapanış değeri |
| TF_TF_O_[ChartID]_SIC_SNAP | Pozisyon değişimindeki SIC değeri |
| TF_TF_O_[ChartID]_ATR_SNAP | Pozisyon değişimindeki ATR değeri |
| TF_TF_O_[ChartID]_ACC | Hızlanma Faktörü |
| TF_TF_O_[ChartID]_afx | Adaptif Hızlanma Faktörü |
| TF_TF_O_[ChartID]_FLIP | Pozisyon yönü (1 veya -1) |
| TF_TF_O_[ChartID]_CurrentPosition | Mevcut pozisyon (uzun için 1, kısa için -1) |
| TF_TF_O_[ChartID]_K | Yumuşatma parametresi |
| TF_TF_O_[ChartID]_SAR | Dur ve Tersine Çevir seviyesi |
| TF_TF_O_[ChartID]_upperBound | Üst sınır değeri |
| TF_TF_O_[ChartID]_upperBoundBreached | Üst sınırın kırılıp kırılmadığını gösteren bayrak |
| TF_TF_O_[ChartID]_lowerBound | Alt sınır değeri |
| TF_TF_O_[ChartID]_lowerBoundBreached | Alt sınırın kırılıp kırılmadığını gösteren bayrak |
| TF_TF_O_[ChartID]_TakeProfit | Kar Alma seviyesi |
| TF_TF_O_[ChartID]_StopLoss | Zarar Durdurma seviyesi |

## Ticaret Sinyallerinin Yorumlanması

### Giriş Sinyalleri

- **Uzun Giriş**: Kısa pozisyondayken fiyat SAR seviyesinin üzerine çıktığında veya kısa pozisyondayken fiyat zarar durdurma seviyesinin üzerine çıktığında
- **Kısa Giriş**: Uzun pozisyondayken fiyat SAR seviyesinin altına düştüğünde veya uzun pozisyondayken fiyat zarar durdurma seviyesinin altına düştüğünde

### Çıkış Sinyalleri

- **Uzun Çıkış**: Fiyat SAR seviyesi veya zarar durdurma seviyesinin altına düştüğünde
- **Kısa Çıkış**: Fiyat SAR seviyesi veya zarar durdurma seviyesinin üzerine çıktığında

### Risk Yönetimi

Gösterge, piyasa koşullarına uyum sağlayan dinamik zarar durdurma ve kar alma seviyeleri sağlar:

- **Zarar Durdurma**: Başlangıçta SIC'den ATR * ACC mesafesinde ayarlanır, ancak işlem ilerledikçe AFX hesaplaması kullanılarak adapte olur
- **Kar Alma**: Minimum seviyeden başlayan ve işlem avantajlı hareket ettikçe artan pürüzsüz bir geçiş fonksiyonu kullanılarak hesaplanır

## Gelişmiş Kavramlar

### Sigmoid Tabanlı Geçişler

AFX hesaplaması, hızlanma faktörü değerleri arasında pürüzsüz geçişler oluşturmak için sigmoid fonksiyonu kullanır:

```
sigmoid_x = ((1 / (1 + MathExp(-k * (2*normalized_x - 1)))) - (1 / (1 + MathExp(k)))) / t
```

Bu, zarar durdurma seviyelerinde ani değişikliklerden kaçınan, daha doğal ve etkili ticaret yönetimi sağlayan S şeklinde bir eğri oluşturur.

### Hiperbolik Tanjant Yumuşatma

Kar alma hesaplaması, özel bir hiperbolik tanjant uygulaması kullanır:

```
CustomTanh(x) = (exp2x - 1.0) / (exp2x + 1.0)
```

Bu, kar alma seviyeleri için pürüzsüz bir geçiş oluşturarak daha doğal ve etkili hale getirir.

### Trailing Stop Uygulaması

Gösterge, şu özelliklere sahip akıllı bir trailing stop mekanizması uygular:

1. Üst veya alt sınırların kırılıp kırılmadığını takip eder
2. Bir sınır kırıldığında, zarar durdurmanın yalnızca avantajlı yönde hareket etmesine izin verir
3. Zarar durdurma mesafesini belirlemek için adaptif hızlanma faktörünü (AFX) kullanır

## Pratik Kullanım

### Trend Takip Stratejisi

1. Göstergenin uzun veya kısa sinyal (oklar) üretmesini bekleyin
2. Sinyalin yönünde pozisyon alın
3. Göstergenin zarar durdurma seviyesinde (turuncu çizgi) zarar durdurma ayarlayın
4. Göstergenin kar alma seviyesinde (macenta çizgi) kar alma ayarlayın
5. Gösterge zarar durdurma ve kar alma seviyelerini güncellerken pozisyonu izleyin
6. Gösterge tersine çevirme sinyali ürettiğinde çıkın

### Diğer Araçlarla Entegrasyon

Gösterge, diğer teknik analiz araçlarıyla birlikte kullanılabilir:

- **Destek/Direnç Seviyeleri**: Sinyalleri anahtar destek ve direnç seviyeleriyle doğrulayın
- **Hacim Göstergeleri**: Sinyalleri hacim doğrulamasıyla onaylayın
- **Osilatörler**: Aşırı alım/aşırı satım koşullarını doğrulamak için RSI veya Stokastik gibi osilatörleri kullanın

## Sonuç

Wilders Volatility Trend Following Optimised göstergesi, gelişmiş adaptif özelliklere sahip kapsamlı bir trend takip sistemi sağlar. Piyasa koşullarına dinamik olarak uyum sağlayarak ve net görsel geri bildirim sağlayarak, tüccarların optimize edilmiş risk parametreleriyle trend bazlı işlemleri tanımlamasına ve yönetmesine yardımcı olur.

Göstergenin adaptif hızlanma faktörleri, pürüzsüz kar alma seviyeleri ve akıllı trailing stopları hesaplamak için kullanılan sofistike algoritmaları, ticaret yaklaşımlarını optimize etmek isteyen trend takipçileri için güçlü bir araç haline getirir.

---

*Telif Hakkı 2025, TradeFlags*


Önerilen ürünler
Noize Absorption Index - is the manual trading system that measures the difference of pressure between bears forces and bulls forces. Green line - is a noize free index that showing curent situation. Zero value of index shows totally choppy/flat market.Values above zero level shows how powerfull bullish wave is and values below zero measures bearish forces.Up arrow appears on bearish market when it's ready to reverse, dn arrow appears on weak bullish market, as a result of reverse expectation.
A powerful oscillator that provide Buy and Sell signals by calculating the investor liquidity. The more liquidity the more buy possibilities. The less liquidity the more sell possibilities. Please download the demo and run a backtest! HOW IT WORKS: The oscillator will put buy and sell arrow on the chart in runtime only . Top value is 95 to 100 -> Investors are ready to buy and you should follow. Bottom value is 5 to 0 -> Investors are ready to sell and you should follow. Alert + sound will appe
The Antique Trend Indicator is a revolutionary trend trading and filtering solution with all the important features of a trend tool built into one tool! The Antique Trend indicator is good for any trader, suitable for any trader both for Forex and binary options. There is no need to configure anything, everything has been perfected by time and experience, it works great during flats and trends. The Antique Trend indicator is a tool for technical analysis of financial markets, reflecting curren
The new update makes this indicator a complete tool for studying, analyzing and operating probabilistic patterns. It includes: On-chart Multi-asset percentage monitor. Configurable martingales. Twenty-one pre-configured patterns, including Mhi patterns and C3. An advanced pattern editor to store up to 5 custom patterns. Backtest mode to test results with loss reports. Trend filter. Hit operational filter. Martingale Cycles option. Various types of strategies and alerts. Confluence between patter
Limitless MT5
Dmitriy Kashevich
Limitless MT5 is a universal indicator suitable for every beginner and experienced trader. works on all currency pairs, cryptocurrencies, raw stocks Limitless MT5 - already configured and does not require additional configuration And now the main thing Why Limitless MT5? 1 complete lack of redrawing 2 two years of testing by the best specialists in trading 3 the accuracy of correct signals exceeds 80% 4 performed well in trading during news releases Trading rules 1 buy signal - the ap
Ichimoku Aiko MTF
Michael Jonah Randriamampionontsoa
Ichimoku Aiko MTF is a collection of technical indicators that show support and resistance levels, as well as momentum and trend direction. It is a multi-timeframe indicator so you don't need to change the chart timeframe when you want to see the ichimoku clouds on a higher timeframe.  eg. The chart timeframe is M15 and you want to see on the M15 timeframe chart the H1 ichimoku indicators (the ichimoku in Metatrader can't do that) that's why you need to use Ichimoku Aiko MTF.
Master Calendar Osw
William Oswaldo Mayorga Urduy
OSW ANA TAKVİMİ Bu gösterge başlangıçta kişisel kullanımım için oluşturuldu, ancak onu yavaş yavaş geliştiriyorum ve günlük ticaretime yardımcı olacak işlevler uyguluyorum ve yararlı olmaları durumunda işlevler uygulanmaya devam edecek. TAKVİM DETAYLARI. >Tarih, Ülke, Para Birimi, Haberin Sektörü, Haberin Adı ve Önceki, tahmin ve Güncel veriler gibi verilerle güncel tarihe yakın mobil ve ayrıntılı haber takvimi. >Takvim her 5 dakikada bir otomatik olarak güncellenir. >Menüden hangi haberi
L'indicatore SMC Venom Model BPR è uno strumento professionale per i trader che operano nell'ambito del concetto di Smart Money (SMC). Identifica automaticamente due modelli chiave sul grafico dei prezzi: FVG   (Fair Value Gap) è una combinazione di tre candele, in cui c'è un gap tra la prima e la terza candela. Forma una zona tra livelli in cui non c'è supporto di volume, il che spesso porta a una correzione dei prezzi. BPR   (Balanced Price Range) è una combinazione di due modelli FVG che for
MT5 Arrow Indicator   is a momentum-based technical indicator for   MetaTrader 5 , designed to provide   clear buy and sell arrow signals   based on market momentum. The indicator generates   non-repainting signals   and includes a   built-in alert system   to notify traders when new signals appear. Key Features  Non-Repainting Arrow Signals Signals are confirmed after candle close Historical arrows do not change Suitable for backtesting and live trading  Buy & Sell Logic Buy Arrow   appears whe
This trading indicator is non-repainting, non-redrawing, and non-lagging, making it an ideal choice for both manual and automated trading. It is a Price Action–based system that leverages price strength and momentum to give traders a real edge in the market. With advanced filtering techniques to eliminate noise and false signals, it enhances trading accuracy and potential. By combining multiple layers of sophisticated algorithms, the indicator scans the chart in real-time and translates comple
Prizmal Logic
Vladimir Lekhovitser
5 (1)
Canlı işlem sinyali İşlem faaliyetlerinin herkese açık gerçek zamanlı takibi: https://www.mql5.com/tr/signals/2353471 Resmî bilgiler Satıcı profili Resmî kanal Kullanıcı kılavuzu Kurulum talimatları ve kullanım yönergeleri: Kullanıcı kılavuzunu aç Bu Expert Advisor kurallara dayalı bir işlem stratejisine dayanır. Strateji, piyasada sürekli aktif olmak yerine belirli piyasa koşullarını tespit etmeye odaklanır. Sistem fiyat davranışını, volatilite özelliklerini ve zaman faktörlerini ana
Long&Short Cointegration Analyzer An advanced tool for traders looking to profit from cointegration. Analyzes any asset pair for Long&Short strategies. What does the Long&Short Cointegration Analyzer do? Identifies cointegrated pairs that revert to the mean, ideal for profitable trades. Provides a detailed panel with statistical data for confident decisions. Works with any currency pair, on any timeframe. Find buying and selling opportunities based on cointegration. Minimize risks with a relia
Your Trend Friend
Luigi Nunes Labigalini
5 (1)
The trend is your friend! Look at the color of the indicator and trade on that direction. It does not  repaint. After each candle is closed, that's the color of the trend. You can focus on shorter faster trends or major trends, just test what's most suitable for the symbol and timeframe you trade. Simply change the "Length" parameter and the indicator will automatically adapt. You can also change the color, thickness and style of the lines. Download and give it a try! There are big movements w
STRICTLY FOR BOOM INDEX ONLY!!!!! Here I bring the Maximum Trend Arrows OT1.0 MT5 indicator. This indicator is made up of a combination of different trend indicators for entries and exits, for entries an orange arrow will paint on the chart below the current market and a red flag for closing of trades and it produces buy arrows only. When the orange arrow appears, it will appear along with it's sound to notify you. The 1H timeframe is recommended, don't use it anywhere else than on the 1H timefr
Owl Smart Levels MT5
Sergey Ermolov
4.03 (32)
MT4 versiyonu  |  FAQ Owl Smart Levels Indicator , Bill Williams'ın gelişmiş fraktalları , piyasanın doğru dalga yapısını oluşturan Valable ZigZag ve kesin giriş seviyelerini gösteren Fibonacci seviyeleri gibi popüler piyasa analiz araçlarını içeren tek gösterge içinde eksiksiz bir ticaret sistemidir. pazara ve kar elde edilecek yerlere. Stratejinin ayrıntılı açıklaması Gösterge ile çalışma talimatı Baykuş Yardımcısı ticaretinde Danışman Yardımcısı Kullanıcıların özel sohbeti -> Satın aldıktan
ROMAN5 Time Breakout Indicator automatically draws the boxes for daily support and resistance breakouts. It helps the user identifying whether to buy or sell. It comes with an alert that will sound whenever a new signal appears. It also features an email facility. Your email address and SMTP Server settings should be specified in the settings window of the "Mailbox" tab in your MetaTrader 5. Blue arrow up = Buy. Red arrow down = Sell. You can use one of my Trailing Stop products that automatical
FREE
Candle Pattern Finder MT5
Pavel Zamoshnikov
4.2 (5)
This indicator searches for candlestick patterns. Its operation principle is based on Candlestick Charting Explained: Timeless Techniques for Trading Stocks and Futures by Gregory L. Morris. If a pattern is detected, the indicator displays a message at a bar closure. If you trade using the MetaTrader 4 terminal, then you can download the full analogue of the " Candle Pattern Finder for MT4 " indicator It recognizes the following patterns: Bullish/Bearish (possible settings in brackets) : Hammer
Gecko EA MT5
Profalgo Limited
5 (1)
NEW PROMO: Only a few copies copies available at 349$ Next price: 449$ Make sure to check out our " Ultimate EA combo package " in our   promo blog ! Gecko runs a simple, yet very effective, proven strategy.  It looks for important recent support and resistance levels and will trade the breakouts.  This is a "real" trading system, which means it will use a SL to protect the account.  It also means it will not use any dangerous techniques like martingale, grid or averaging down. The EA shows its
Bollinger Trend Lines – MT4 & MT5 Bollinger Trend Lines is a professional volatility-based trend indicator designed to clearly identify trend direction and dynamic stop levels using Bollinger Bands. Fuses on one core principle: follow the trend, ignore noise, and let volatility define the stop. How it works The indicator builds trailing trend lines using Bollinger Bands: In an uptrend , the lower band trails price and can only rise In a downtrend , the upper band trails price and can only
Range Directional Force Indicator – Designed for You to Optimize! The Range Directional Force Indicator is a cutting-edge tool designed to empower traders by visualizing market dynamics and directional strength. Built to offer insights into market trends and reversals, this indicator is an invaluable asset for traders seeking precision in their strategies. However, it is important to note that this indicator is not optimized, leaving room for you to tailor it to your unique trading preferences.
Sayı dizilerinden birine "Orman Yangını Dizisi" denir. En güzel yeni dizilerden biri olarak kabul edildi. Başlıca özelliği, bu dizinin lineer trendlerden, hatta en kısa olanlardan kaçınmasıdır. Bu göstergenin temelini oluşturan bu özelliktir. Bir finansal zaman serisini analiz ederken, bu gösterge tüm olası trend seçeneklerini reddetmeye çalışır. Ve ancak başarısız olursa, bir trendin varlığını tanır ve uygun sinyali verir. Bu yaklaşım, yeni trendlerin başladığı anların doğru bir şekilde belirl
The Riko Trend indicator is a revolutionary trend trading and filtering solution with all the important features of a trend tool built into one tool! The Riko Trend indicator is good for any trader, suitable for any trader for both forex and binary options. You don’t need to configure anything, everything is perfected by time and experience, it works great during a flat and in a trend. The Riko Trend indicator is a technical analysis tool for financial markets that reflects the current price f
MTF Candles Overlay - Professional Multi-Timeframe Analysis Tool (Now with Yearly Y1 timeframe!) The MTF  Candles Overlay is a powerful and visually intuitive indicator that allows traders to view candles from higher timeframes directly overlaid on their current chart. This eliminates the need to constantly switch between multiple timeframe charts, enabling faster analysis and better trading decisions. Key Features Complete Timeframe Coverage All Standard Timeframes : M1, M2, M3, M4, M5, M6, M1
PipFinite Breakout EDGE MT5
Karlo Wilson Vendiola
4.81 (93)
The Missing Edge You Need To Catch Breakouts Like A Pro. Follow a step-by-step system that detects the most powerful breakouts! Discover market patterns that generate massive rewards based on a proven and tested strategy. Unlock Your Serious Edge Important information here www.mql5.com/en/blogs/post/723208 The Reliable Expert Advisor Version Automate Breakout EDGE signals using "EA Breakout EDGE" Click Here Have access to the game changing strategy that will take your trading to the next l
Probability Advanced Indicator
Dioney De Jesus Batista Alves
The   ProbabilityAdvancedIndicator   is a sophisticated trend probability analysis tool designed for scalping and day trading. It combines multiple technical indicators and multi-timeframe analysis to generate clear visual signals for buy/sell probabilities. The   ProbabilityAdvancedIndicator   is a comprehensive tool for traders looking for: Probability-based decision-making Consolidated technical analysis Flexibility for different trading styles Intuitive and customizable interface Pro Tip:  
The Super Arrow Indicator provides non-repainting buy and sell signals with exceptional accuracy. Key Features No repainting – confirmed signals remain fixed Clear visual arrows: green for buy, red for sell Real-time alerts via pop-up, sound, and optional email Clean chart view with no unnecessary clutter Works on all markets: Forex, gold, oil, indices, crypto Adjustable Parameters TimeFrame Default:   "current time frame" Function:   Sets the time frame for indicator calculation Options:   Can
Genel Açıklama Bu gösterge, klasik Donchian Kanalı ’nın geliştirilmiş bir versiyonudur ve gerçek işlem için pratik işlevlerle zenginleştirilmiştir. Standart üç çizgiye (üst, alt ve orta çizgi) ek olarak sistem breakout (fiyat kırılımı) noktalarını tespit eder ve bunları grafikte oklarla görsel olarak gösterir. Ayrıca grafiği sadeleştirmek için mevcut trend yönünün tersindeki çizgi yalnızca görüntülenir. Gösterge şunları içerir: Görsel sinyaller : Kırılım sırasında renkli oklar Otomatik bildiriml
FREE
WanaScalper
Isaac Wanasolo
1 (1)
A scalping indicator based on mathematical patterns, which on average gives signals with relatively small SL, and also occasionally helps to catch big moves in the markets (more information in the video) This indicator has three main types of notifications: The first type warns of a possible/upcoming signal on the next bar The second type indicates the presence of a ready signal to enter the market/open a position The third type is for SL and TP levels - you will be notified every time price re
Gann 9+ Indicator Introduction The "Gann Matrix Chart" is the most simple and clear technical analysis in Gann theory, which is the calculation tool that Gann has always been committed to using. It is the essence of Gann's whole life. The Gann 9+ indicator uses the matrix chart to find the future high or low points of stocks or futures. Indicator Input: The base and step size can be set as 1 by default; When the multiple is -1, the multiple will be automatically obtained, or it can be filled in
##   ONLY GOLD ##   Тiльки Золото ## **Mercaria Professional Trading Zones - Complete Guide** ## **Mercaria Professional Trading Zones - Повний посібник** ### **How Mercaria Zones Work / Як працюють зони Mercaria** **English:** Mercaria Zones is an advanced trading indicator that identifies high-probability support and resistance areas using ZigZag extremes combined with mathematical zone calculations. The indicator works on multiple timeframes simultaneously, providing a comprehensive view
Bu ürünün alıcıları ayrıca şunları da satın alıyor
Divergence Bomber
Ihor Otkydach
4.9 (81)
Bu göstergeyi satın alan herkese aşağıdaki ekstra içerikler ücretsiz olarak sunulmaktadır: Her işlemi otomatik olarak yöneten, Stop Loss ve Take Profit seviyelerini ayarlayan ve işlemleri strateji kurallarına göre kapatan özel yardımcı araç: "Bomber Utility" Göstergenin farklı varlıklar üzerinde kullanılmasına yönelik ayar dosyaları (set dosyaları) Bomber Utility için 3 farklı modda kullanım sunan ayar dosyaları: "Minimum Risk", "Dengeli Risk" ve "Bekle-Gör Stratejisi" Bu ticaret stratejisini hı
Azimuth Pro
Ottaviano De Cicco
5 (1)
LAUNCH PROMO Azimuth Pro price is initially set at 299$ for the first 100 buyers. Final price will be 499$ . THE DIFFERENCE BETWEEN RETAIL AND INSTITUTIONAL ENTRIES ISN'T THE INDICATOR — IT'S THE LOCATION. Most traders enter at arbitrary price levels, chasing momentum or reacting to lagging signals. Institutions wait for price to reach structured levels where supply and demand actually shift. Azimuth Pro maps these levels automatically: swing-anchored VWAP, multi-timeframe structure lines, an
Super Signal – Skyblade Edition Profesyonel No-Repaint / Gecikmesiz Trend Sinyal Sistemi, Olağanüstü Kazanma Oranı ile | MT4 / MT5 için 1 dakika, 5 dakika ve 15 dakika gibi daha düşük zaman dilimlerinde en iyi şekilde çalışır. Temel Özellikler: Super Signal – Skyblade Edition, özellikle trend bazlı işlemler için geliştirilmiş akıllı bir sinyal sistemidir. Yalnızca güçlü, yönlü ve gerçek momentum destekli piyasa hareketlerini tespit etmek amacıyla çok katmanlı bir filtreleme yapısı kullanır.
Öncelikle, bu Ticaret Aracının Non-Repainting, Non-Redrawing ve Non-Lagging Gösterge olduğunu vurgulamakta fayda var, bu da onu profesyonel ticaret için ideal hale getiriyor. Çevrimiçi kurs, kullanıcı kılavuzu ve demo. Akıllı Fiyat Hareketi Kavramları Göstergesi, hem yeni hem de deneyimli tüccarlar için çok güçlü bir araçtır. İleri ticaret fikirlerini, Inner Circle Trader Analizi ve Smart Money Concepts Ticaret Stratejileri gibi 20'den fazla kullanışlı göstergeyi bir araya getirerek bir araya
Trend Screener Pro MT5
STE S.S.COMPANY
4.84 (100)
Trend Göstergesi, Trend Alım Satım ve Filtreleme için Çığır Açan Benzersiz Çözüm, Tüm Önemli Trend Özellikleriyle Tek Bir Araç İçinde Yerleştirildi! Forex, emtialar, kripto para birimleri, endeksler ve hisse senetleri gibi tüm sembollerde/araçlarda kullanılabilen %100 yeniden boyamayan çoklu zaman çerçevesi ve Çoklu para birimi göstergesidir. Trend Screener, grafikte noktalarla ok trend sinyalleri sağlayan etkili bir trend trend göstergesidir. Trend analizörü göstergesinde bulunan özellikler: 1.
Grabber System MT5
Ihor Otkydach
4.82 (22)
Size mükemmel bir teknik gösterge olan Grabber’ı tanıtıyorum. Bu araç, kullanıma hazır bir “her şey dahil” işlem stratejisi olarak çalışır. Tek bir yazılım kodu içinde güçlü piyasa teknik analiz araçları, işlem sinyalleri (oklar), uyarı işlevleri ve push bildirimleri entegre edilmiştir. Bu göstergeyi satın alan herkes aşağıdaki hediyeleri ücretsiz olarak alır: Açık emirleri otomatik yönetmek için Grabber Yardımcı Aracı Kurulum, yapılandırma ve nasıl işlem yapılacağını adım adım anlatan video kıl
Gold Sniper Scalper Pro
Ich Khiem Nguyen
3.5 (8)
Gold Sniper Scalper Pro, trader'ların giriş noktalarını belirlemesine ve riski etkili bir şekilde yönetmesine destek olmak için tasarlanmış MetaTrader 5 için profesyonel bir göstergedir. Gösterge, sinyal tespit sistemi, otomatik Entry/SL/TP yönetimi, hacim analizi ve gerçek zamanlı performans istatistikleri içeren kapsamlı bir analiz araçları seti sunar. Sistemi anlamak için kullanım kılavuzu   |   Diğer diller için kullanım kılavuzu ANA ÖZELLİKLER Sinyal tespit sistemi Gösterge, price action a
AriX
Temirlan Kdyrkhan
1 (4)
AriX Indicator for MT5 A powerful trend-following and signal-evaluation tool AriX is a custom MT5 indicator that combines Moving Averages and ATR-based risk/reward logic to generate clear buy/sell signals. It visualizes dynamic SL/TP levels, evaluates past trade outcomes, and displays win/loss statistics in a clean on-chart panel. Key features include: Buy/Sell signals based on MA crossovers ATR-based SL/TP1/TP2/TP3 levels with visual lines and labels Signal outcome tracking with real-time stat
Shock Pullback
Suleiman Alhawamdah
5 (1)
Basitçe söylemek gerekirse, mevcut mum çubuğunun yanında “pip” olarak bilinen beyaz sayıların hareketi görünmeye başladığında işlem yapmaya başlayabilirsiniz. Beyaz “pip”ler, bir alım veya satım işleminin şu anda aktif olduğunu ve beyaz renkleriyle belirtildiği gibi doğru yönde ilerlediğini gösterir. Beyaz pip hareketi durduğunda ve sabit yeşil renge dönüştüğünde, bu mevcut ivmenin sona erdiğini gösterir. Sayıların yeşil rengi, alım veya satım işlemiyle elde edilen toplam kârı “pip” cinsinden t
Protect against whipsaws: revolutionize your swing trading approach Swing Trading is the first indicator designed to detect swings in the direction of the trend and possible reversal swings. It uses the baseline swing trading approach, widely described in trading literature. The indicator studies several price and time vectors to track the aggregate trend direction and detects situations in which the market is oversold or overbought and ready to correct. [ Installation Guide | Update Guide | Tro
Trend Forecaster
Alexey Minkov
5 (7)
The Trend Forecaster indicator utilizes a unique proprietary algorithm to determine entry points for a breakout trading strategy. The indicator identifies price clusters, analyzes price movement near levels, and provides a signal when the price breaks through a level. The Trend Forecaster indicator is suitable for all financial assets, including currencies (Forex), metals, stocks, indices, and cryptocurrencies. You can also adjust the indicator to work on any time frames, although it is recommen
ÜCRETSİZ AUX Göstergesi ve EA Desteğini Alın  Doğrudan indirme — Buraya tıklayın [ D.I.C.E ] The DICE Indicator  Divergence in Chaos Environment, Elliott Dalga Teorisi’ni Trading Chaos teknikleriyle birleştiren trader’lar için geliştirilmiş özel bir MT5 aracıdır. Bill Williams’ın tanımladığı kaotik piyasa ortamıyla senkronize olarak fiyat hareketlerindeki gizli ve normal uyumsuzlukları tespit eder. Ana Özellikler Elliott Dalgası Uyumlu Uyumsuzluk: Dalga yapılarıyla uyumlu boğa ve ayı uyumsuzluk
Advanced Supply Demand MT5
Bernhard Schweigert
4.5 (14)
Herhangi bir Acemi veya Uzman Tüccar için En İyi Çözüm! Bu gösterge benzersiz, yüksek kaliteli ve uygun fiyatlı bir ticaret aracıdır çünkü bir dizi tescilli özelliği ve yeni bir formülü bir araya getirdik. Bu güncelleme ile çift zaman dilimi dilimlerini gösterebileceksiniz. Yalnızca daha yüksek bir TF gösteremeyeceksiniz, aynı zamanda TF grafiğini ve ARTIK daha yüksek TF'yi de gösterebileceksiniz: YUVARLAK BÖLGELERİ GÖSTERMEK. Tüm Arz Talebi tüccarları buna bayılacak. :) Önemli Bilgiler Açıkland
Berma Bands
Muhammad Elbermawi
5 (7)
Berma Bantları (BB'ler) göstergesi, piyasa trendlerini belirlemeyi ve bunlardan yararlanmayı amaçlayan yatırımcılar için değerli bir araçtır. Fiyat ile BB'ler arasındaki ilişkiyi analiz ederek, yatırımcılar bir piyasanın trend veya aralıklı fazda olup olmadığını ayırt edebilir. Daha fazla bilgi edinmek için [ Berma Home Blog ] adresini ziyaret edin. Berma Bantları üç belirgin çizgiden oluşur: Üst Berma Bandı, Orta Berma Bandı ve Alt Berma Bandı. Bu çizgiler fiyatın etrafına çizilir ve genel tren
WVAP Scalping
Domantas Juodenis
VWAP Scalping Pro – Advanced VWAP & Market Profile System Professional-Grade VWAP + Market Profile Technology for Precision Trading VWAP Scalping Pro is an advanced analytical tool that integrates Volume-Weighted Average Price (VWAP) analysis with professional Market Profile visualization. It provides traders with institutional-style insights into price structure, volume distribution, and session dynamics — ideal for scalping, intraday, and swing trading strategies. Key Features Triple VWAP St
MetaForecast M5
Vahidreza Heidar Gholami
5 (3)
MetaForecast, fiyat verilerindeki harmonileri kullanarak herhangi bir piyasanın geleceğini tahmin eder ve görselleştirir. Piyasa her zaman tahmin edilemezken, fiyatlarda bir desen varsa, MetaForecast geleceği mümkün olduğunca doğru bir şekilde tahmin edebilir. Benzer ürünlere göre, MetaForecast piyasa eğilimlerini analiz ederek daha kesin sonuçlar üretebilir. Giriş Parametreleri Past size (Geçmiş boyut) MetaForecast'ın gelecekteki tahminler oluşturmak için kullandığı çubuk sayısını belirtir. Mo
Trade smarter, not harder: Empower your trading with Harmonacci Patterns This is arguably the most complete harmonic price formation auto-recognition indicator you can find for the MetaTrader Platform. It detects 19 different patterns, takes fibonacci projections as seriously as you do, displays the Potential Reversal Zone (PRZ) and finds suitable stop-loss and take-profit levels. [ Installation Guide | Update Guide | Troubleshooting | FAQ | All Products ] It detects 19 different harmonic pri
Weis Wave with Alert MT5
Trade The Volume Waves Single Member P.C.
4.94 (17)
Rental/Lifetime Package Options and Privileges  Rent Monthly Six Months   Yearly/Lifetime Weis Wave with Speed with Alert+Speed Index x x x Manual  x x x Quick Set up Video x x x Blog x x x Lifetime Updates x x x Setup and Training Material x x Discord Access Channel "The SI traders"          x Rectangle Break Alert Tool      x How to trade with it:    http://www.tradethevolumewaves.com   ** If you purchase please contact me to setup your  : Training Room and  complete manual access.  Wei
Rtc ML Ai Predictor
Muhammad Faisal Sagala
Rtc ML Ai | Predictor CORE MACHINE LEARNING ENGINE Adaptive ML Market Predictor – Multi-Bar Trend & Candle Forecast What This Indicator Does This indicator is a  real-time market prediction engine  designed to analyze price behavior and estimate  future market tendencies . Unlike conventional indicators, this system  does not rely on static parameters or historical curve-fitting , but adapts its internal state dynamically during live market operation. Instead of using static rules, the indic
Quantum TrendPulse
Bogdan Ion Puscasu
5 (20)
SuperTrend   ,   RSI   ve   Stochastic'in   gücünü tek bir kapsamlı göstergede birleştirerek işlem potansiyelinizi en üst düzeye çıkaran nihai işlem aracı olan   Quantum TrendPulse'u   tanıtıyoruz. Hassasiyet ve verimlilik arayan yatırımcılar için tasarlanan bu gösterge, piyasa trendlerini, momentum değişimlerini ve en uygun giriş ve çıkış noktalarını güvenle belirlemenize yardımcı olur. Temel Özellikler: SuperTrend Entegrasyonu:   Güncel piyasa trendlerini kolayca takip edin ve karlılık dalgası
Ultimate Boom and Crash Indicator The Ultimate Boom and Crash Indicator is a cutting-edge tool developed by  Coetsee Digital , designed to identify potential spike opportunities in the market. Crafted for traders focusing on Deriv and Weltrade synthetic markets, this indicator is optimized to operate exclusively on the 3-minute (M3), 5-minute (M5), 15-minute (M15), 30-minute (M30), and 1-hour (H1) timeframes and supports only the following pairs: PainX 1200, PainX 999, PainX 800, PainX 600, Pai
Top indicator for MT5   providing accurate signals to enter a trade without repainting! It can be applied to any financial assets:   forex, cryptocurrencies, metals, stocks, indices .  Watch  the video  (6:22) with an example of processing only one signal that paid off the indicator! MT4 version is here It will provide pretty accurate trading signals and tell you when it's best to open a trade and close it. Most traders improve their trading results during the first trading week with the help of
PZ Day Trading MT5
PZ TRADING SLU
2.83 (6)
Effortless trading: non-repainting indicator for accurate price reversals This indicator detects price reversals in a zig-zag fashion, using only price action analysis and a donchian channel. It has been specifically designed for short-term trading, without repainting or backpainting at all. It is a fantastic tool for shrewd traders aiming to increase the timing of their operations. [ Installation Guide | Update Guide | Troubleshooting | FAQ | All Products ] Amazingly easy to trade It provides
" Dynamic Scalper System MT5 " göstergesi, trend dalgaları içinde işlem yapmak için scalping yöntemi için tasarlanmıştır. Başlıca döviz çiftleri ve altın üzerinde test edilmiştir, diğer işlem araçlarıyla uyumluluğu mümkündür. Ek fiyat hareketi desteğiyle trend boyunca pozisyonların kısa vadeli açılması için sinyaller sağlar. Göstergenin prensibi. Büyük oklar trend yönünü belirler. Küçük oklar şeklinde scalping için sinyaller üreten bir algoritma trend dalgaları içinde çalışır. Kırmızı oklar yü
MT4 / MT5 için Astronomi Göstergesini Tanıtıyoruz: En İleri Göksel Ticaret Arkadaşınız Ticaret deneyiminizi göksel seviyelere yükseltmeye hazır mısınız? MT4 için devrim niteliğindeki Astronomi Göstergemizi arayın. Bu yenilikçi araç karmaşık algoritmaları kullanarak eşsiz astronomik içgörüler ve hassas hesaplamalar sunmak için geleneksel ticaret göstergelerini aşmaktadır. Bilgi Evreni Parmaklarınızın Ucunda:   Göksel verilerin hazinelerini açığa çıkaran kapsamlı bir paneli gözlemleyin. Gezegenl
Unlock hidden profits: accurate divergence trading for all markets Tricky to find and scarce in frequency, divergences are one of the most reliable trading scenarios. This indicator finds and scans for regular and hidden divergences automatically using your favourite oscillator. [ Installation Guide | Update Guide | Troubleshooting | FAQ | All Products ] Easy to trade Finds regular and hidden divergences Supports many well known oscillators Implements trading signals based on breakouts Displays
RelicusRoad Pro: Kantitatif Piyasa İşletim Sistemi ÖMÜR BOYU ERİŞİMDE %70 İNDİRİM (SINIRLI SÜRE) - 2.000+ TRADER'A KATILIN Neden çoğu trader "mükemmel" indikatörlere rağmen başarısız olur? Çünkü tekil kavramları boşlukta trade ederler. Bağlamı olmayan bir sinyal kumardır. Sürekli kazanmak için KONFLÜANS (UYUM) gerekir. RelicusRoad Pro basit bir ok indikatörü değildir. Tam bir Kantitatif Piyasa Ekosistemi dir. Tescilli volatilite modellemesini kullanarak fiyatın ilerlediği "Adil Değer Yolu"nu har
MTF Supply Demand Zones MT5
Georgios Kalomoiropoulos
5 (1)
Yeni Nesil Otomatik Arz ve Talep Bölgeleri. Her Grafikte Çalışan Yeni ve Yenilikçi Algoritma. Tüm Bölgeler Piyasanın Fiyat Hareketine Göre Dinamik Olarak Oluşturulmaktadır. İKİ TÜR UYARI --> 1) FİYAT BİR BÖLGEYE ÇIKTIĞINDA 2) YENİ BİR BÖLGE OLUŞTURDUĞUNDA Bir tane daha işe yaramaz gösterge almazsın. Kanıtlanmış Sonuçlarla eksiksiz bir Ticaret Stratejisi elde edersiniz.     Yeni özellikler:     Fiyat Arz/Talep Bölgesine ulaştığında uyarılar     Yeni bir Arz/Talep Bölgesi oluşturulduğunda
FOOTPRINTORDERFLOW: The Authoritative Guide ( This indicator is also compatible with economic providers that do not offer DOM data and BID/ASK data, It also supports various foreign exchange transactions, DEMO version,modleling must choose " Every tick based on real ticks"  ) Important notice: Before placing an order, please contact me first, and I will provide you with professional answers and services 1. Overview FOOTPRINTORDERFLOW  is an advanced Order Flow analysis tool designed for MetaTra
Elliott Wave Trend was designed for the scientific wave counting. This tool focuses to get rid of the vagueness of the classic Elliott Wave Counting using the guideline from the template and pattern approach. In doing so, firstly Elliott Wave Trend offers the template for your wave counting. Secondly, it offers Wave Structural Score to assist to identify accurate wave formation. It offers both impulse wave Structural Score and corrective wave Structure Score. Structural Score is the rating to sh
Yazarın diğer ürünleri
# Power Assisted Trend Following Indicator ## Overview The PowerIndicator is an implementation of the "Power Assisted Trend Following" methodology developed by Dr. Andreas A. Aigner and Walter Schrabmair. This indicator builds upon and improves J. Welles Wilder's trend following concepts by applying principles from signal analysis to financial markets. The core insight of this indicator is that successful trend following requires price movements to exceed a certain threshold (typically a mul
FREE
# Optimised Wilders Trend Following AutoAdjusting VixControlled Expert Advisor ## Overview The Optimised Wilders Trend Following AutoAdjusting VixControlled Expert Advisor is an advanced trading system for MetaTrader 5 that implements a sophisticated trend following strategy based on Welles Wilder's concepts, enhanced with modern risk management techniques. This EA combines multiple innovative features to adapt to changing market conditions while maintaining strict risk control parameters. #
HMM4 Indicator Documentation HMM4 Indicator Documentation Introduction The HMM4 indicator is a powerful technical analysis tool that uses a 4-Gaussian Hidden Markov Model (HMM) to identify market regimes and predict potential market direction. This indicator applies advanced statistical methods to price data, allowing traders to recognize bull and bear market conditions with greater accuracy. The indicator displays a stacked line chart in a separate window, representing the mixture weights of f
Filtrele:
İnceleme yok
İncelemeye yanıt