Wilders Volatility Trend Following Optimised

A Trend Following Indicator that switches directions based on a Stop-and-Reverse Price (based on Wilders algorithm) and in parallel a Stop-Loss that contracts when the profit exceeds the risk capital (ACC*ATR) progressively up to user defined max % level (AF_MAX).

The basis of this indicator is the Volatility method described in Wilders book from 1975 "New Concepts in Technical Trading Systems". 

I have used this on Crypto and Stocks and Forex. The ACC (Acceleration Factor) is setup to run on Crypto (BTC,ETH) M1, but it also works on all other timeframes. It works well on Forex as well as Stocks. Ideally you want to trade when the volatility is higher as to avoid side ways trading. So you want to look at other indicators to provide you a good idea of when it is worthwhile to trade.

My main motivation for improving the existing indicator by Wilders was that while it serves as a good entry point to trades its exit of the trades is usually way too relaxed and needs to be more precise and aggressive. This is why I have included an adaptive Stop-Loss that tightens aggressively once the Risk-Reward ratio breaches 1.0 up to a user set max RR. This is what we want to be doing if we are trading manually once your RR has exceeded 1:1. While the original Wilder algorithm leaves the ACC factor constant we are instead reducing the ACC factor using a smooth function to start increasingly tighten the StopLoss towards our set max RR.

# Wilders Volatility Trend Following Optimised Indicator Documentation

## Introduction

The Wilders Volatility Trend Following Optimised indicator is a sophisticated trend-following technical analysis tool for MetaTrader 5. It implements an advanced adaptive trend-following system that dynamically adjusts to market conditions, providing traders with clear entry and exit signals while automatically calculating optimal take profit and stop loss levels.

This indicator is designed for traders who follow trend-based strategies and seek to optimize their trade management with adaptive risk parameters that respond to changing market volatility.

## Key Features

- **Adaptive Trend Following**: Automatically identifies and follows market trends
- **Dynamic Position Management**: Calculates optimal entry, exit, stop loss, and take profit levels
- **Volatility-Based Parameters**: Uses Average True Range (ATR) to adapt to market volatility
- **Adaptive Acceleration Factor (AFX)**: Implements a sigmoid-based transition between acceleration factors
- **Smooth Take Profit Calculation**: Uses hyperbolic tangent function for natural profit target transitions
- **Trailing Stop Loss**: Implements an intelligent trailing stop mechanism that locks in profits
- **Visual Feedback**: Provides comprehensive visual elements including arrows, lines, and text annotations
- **Global Variable Export**: Makes key values available to other indicators and EAs

## Technical Approach

### Trend Following Methodology

The indicator follows a trend-based approach using a Stop-And-Reverse (SAR) mechanism. It maintains a current position (long or short) and tracks a Significant Close (SIC) value, which represents the most extreme favorable price since entering the current position.

The SAR level is calculated as:
```
SAR = SIC - FLIP * ACC * ATR
```
Where:
- `SIC` is the Significant Close value
- `FLIP` is the position direction (1 for long, -1 for short)
- `ACC` is the Acceleration Factor
- `ATR` is the Average True Range

When price crosses the SAR level in the opposite direction of the current position, the indicator generates a signal to reverse the position.

### Adaptive Acceleration Factor (AFX)

One of the most innovative aspects of this indicator is the Adaptive Acceleration Factor (AFX) calculation. This uses a sigmoid function to create a smooth transition between different acceleration factor values based on price movement:

```
AF_X = af_start + (af_end - af_start) * sigmoid_x
```

The sigmoid function creates an S-shaped curve that makes transitions smooth rather than abrupt. This adaptive approach allows the indicator to:

1. Start with wider stops to give trades room to breathe
2. Gradually tighten as the trade moves favorably
3. Lock in profits with a trailing mechanism once certain thresholds are crossed
4. Adapt to market volatility through ATR

### Dynamic Take Profit Calculation

The indicator implements a sophisticated take profit calculation using a hyperbolic tangent function:

```
profitMultiplier = 1.0 + profitRange * transitionFactor
```

Where `transitionFactor` is calculated using a custom hyperbolic tangent implementation. This creates a dynamic take profit that:

- Starts at a minimum level (SIC_SNAP ± ATR * ACC * PROFIT_MIN)
- Gradually increases toward a maximum level (SIC_SNAP ± ATR * ACC * PROFIT_MAX)
- Uses a smooth transition based on how far price has moved from the base level
- Adapts to market volatility through the ATR value

## Key Components

### Significant Close (SIC)

The Significant Close (SIC) is a key concept in this indicator. It represents the most favorable price level since entering the current position:

- For long positions: SIC is the highest close price since entering the position
- For short positions: SIC is the lowest close price since entering the position

The SIC serves as a reference point for calculating the SAR level and other important values.

### Average True Range (ATR)

The indicator uses ATR to measure market volatility and scale various calculations accordingly. The ATR is calculated using a smoothed approach:

```
ATR = Alpha * TR + (1 - Alpha) * previous_ATR
```

Where:
- `TR` (True Range) is the maximum of: current high-low range, current high-previous close, or current low-previous close
- `Alpha` is the smoothing factor (default 1/7)

### Position Tracking and Signal Generation

The indicator tracks the current market position (long, short, or none) and generates signals based on four conditions:

1. If long position and current price is less than or equal to StopLoss, switch to short
2. If short position and current price is greater than or equal to StopLoss, switch to long
3. If long position and current price is less than or equal to SAR, switch to short
4. If short position and current price is greater than or equal to SAR, switch to long

When a position change occurs, the indicator:
- Updates the SIC and ATR_SNAP values
- Resets bound breach flags
- Draws arrows and vertical lines on the chart
- Updates all visual elements

### Bound Breaching Mechanism

The indicator implements an upper and lower bound system:

```
upperBound = SIC_SNAP + ATR_SNAP * ACC
lowerBound = SIC_SNAP - ATR_SNAP * ACC
```

When price breaches these bounds in a favorable direction, the indicator activates a trailing stop mechanism that only moves in the favorable direction, locking in profits.
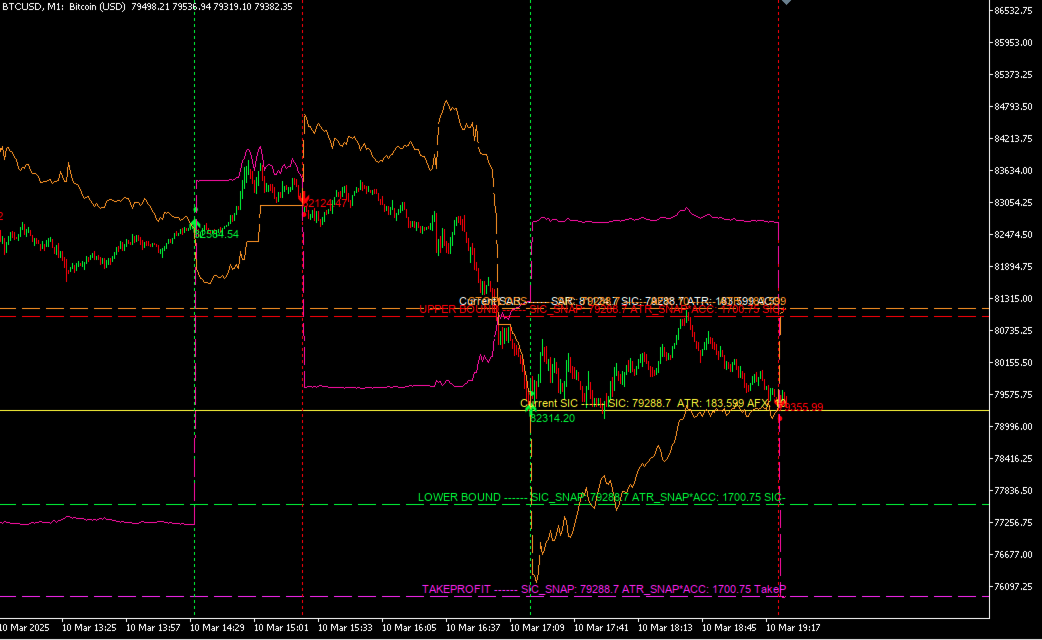
## Visual Elements

The indicator creates several visual elements on the chart:

### Arrows and Lines

- **Long/Short Arrows**: Green (long) or red (short) arrows indicating position changes
- **SAR Line**: A horizontal line showing the current SAR level
- **SIC Line**: A horizontal line showing the current Significant Close level
- **Upper/Lower Bound Lines**: Horizontal lines showing the upper and lower bounds
- **Take Profit Line**: A magenta dashed line showing the calculated take profit level
- **Stop Loss Line**: An orange dashed line showing the calculated stop loss level
- **Vertical Lines**: Dotted vertical lines marking position change points

### Text Annotations

The indicator adds text annotations to the chart explaining various values:

- SAR level and calculation details
- SIC value and related parameters
- Upper and lower bound values
- Take profit and stop loss levels with calculation details

## Input Parameters

| Parameter | Default | Description |
|-----------|---------|-------------|
| Timeframe | PERIOD_M1 | Time frame to run the indicator on |
| UseATRSnap | true | Use ATR Snapshot (true) or Live ATR (false) for calculations |
| UseGlobalATRTR | false | Use global TF1_ATRTR_TR and TF1_ATRTR_ATR variables |
| SARLineColor | clrWhite | Color of the SAR line |
| SICLineColor | clrYellow | Color of the SIC line |
| ACC | 10.0 | Base Acceleration Factor |
| Alpha | 1.0/7.0 | ATR smoothing factor |
| ArrowSize | 3 | Size of arrow symbols |
| LongColor | clrLime | Color for long signals |
| ShortColor | clrRed | Color for short signals |
| LongArrowCode | 233 | Long arrow symbol code |
| ShortArrowCode | 234 | Short arrow symbol code |
| AF_MIN | 1.0 | Minimum acceleration factor for AFX calculation |
| AF_MAX | 15.0 | Maximum acceleration factor for AFX calculation |
| K_Smooth | 3.0 | Smoothing parameter for AFX calculation |
| StopLossColor | clrOrange | StopLoss line color |

## Global Variables

The indicator exports several global variables that can be used by other indicators or EAs:

| Global Variable | Description |
|-----------------|-------------|
| TF_TF_O_[ChartID]_currentPrice | Current price |
| TF_TF_O_[ChartID]_TR | True Range value |
| TF_TF_O_[ChartID]_ATR | Average True Range value |
| TF_TF_O_[ChartID]_SIC | Significant Close value |
| TF_TF_O_[ChartID]_SIC_SNAP | SIC value at position change |
| TF_TF_O_[ChartID]_ATR_SNAP | ATR value at position change |
| TF_TF_O_[ChartID]_ACC | Acceleration Factor |
| TF_TF_O_[ChartID]_afx | Adaptive Acceleration Factor |
| TF_TF_O_[ChartID]_FLIP | Position direction (1 or -1) |
| TF_TF_O_[ChartID]_CurrentPosition | Current position (1 for long, -1 for short) |
| TF_TF_O_[ChartID]_K | Smoothing parameter |
| TF_TF_O_[ChartID]_SAR | Stop and Reverse level |
| TF_TF_O_[ChartID]_upperBound | Upper bound value |
| TF_TF_O_[ChartID]_upperBoundBreached | Flag indicating if upper bound is breached |
| TF_TF_O_[ChartID]_lowerBound | Lower bound value |
| TF_TF_O_[ChartID]_lowerBoundBreached | Flag indicating if lower bound is breached |
| TF_TF_O_[ChartID]_TakeProfit | Take profit level |
| TF_TF_O_[ChartID]_StopLoss | Stop loss level |

## Trading Signals Interpretation

### Entry Signals

- **Long Entry**: When price crosses above the SAR level while in a short position, or when price crosses above the stop loss level while in a short position
- **Short Entry**: When price crosses below the SAR level while in a long position, or when price crosses below the stop loss level while in a long position

### Exit Signals

- **Long Exit**: When price crosses below the SAR level or the stop loss level
- **Short Exit**: When price crosses above the SAR level or the stop loss level

### Risk Management

The indicator provides dynamic stop loss and take profit levels that adapt to market conditions:

- **Stop Loss**: Initially set at a distance of ATR * ACC from the SIC, but adapts using the AFX calculation as the trade progresses
- **Take Profit**: Calculated using a smooth transition function that starts at a minimum level and increases as the trade moves favorably

## Advanced Concepts

### Sigmoid-Based Transitions

The AFX calculation uses a sigmoid function to create smooth transitions between acceleration factor values:

```
sigmoid_x = ((1 / (1 + MathExp(-k * (2*normalized_x - 1)))) - (1 / (1 + MathExp(k)))) / t
```

This creates an S-shaped curve that avoids abrupt changes in stop loss levels, providing more natural and effective trade management.

### Hyperbolic Tangent Smoothing

The take profit calculation uses a custom hyperbolic tangent implementation:

```
CustomTanh(x) = (exp2x - 1.0) / (exp2x + 1.0)
```

This creates a smooth transition for take profit levels, making them more natural and effective.

### Trailing Stop Loss Implementation

The indicator implements an intelligent trailing stop mechanism that:

1. Tracks whether upper or lower bounds have been breached
2. Once a bound is breached, only allows the stop loss to move in the favorable direction
3. Uses the adaptive acceleration factor (AFX) to determine the stop loss distance

## Practical Usage

### Trend Following Strategy

1. Wait for the indicator to generate a long or short signal (arrows)
2. Enter a position in the direction of the signal
3. Set stop loss at the indicator's stop loss level (orange line)
4. Set take profit at the indicator's take profit level (magenta line)
5. Monitor the position as the indicator updates stop loss and take profit levels
6. Exit when the indicator generates a reversal signal

### Integration with Other Tools

The indicator can be used alongside other technical analysis tools:

- **Support/Resistance Levels**: Confirm signals with key support and resistance levels
- **Volume Indicators**: Validate signals with volume confirmation
- **Oscillators**: Use oscillators like RSI or Stochastic to confirm overbought/oversold conditions

## Conclusion

The Wilders Volatility Trend Following Optimised indicator provides a comprehensive trend-following system with advanced adaptive features. By dynamically adjusting to market conditions and providing clear visual feedback, it helps traders identify and manage trend-based trades with optimized risk parameters.

The indicator's sophisticated algorithms for calculating adaptive acceleration factors, smooth take profit levels, and intelligent trailing stops make it a powerful tool for trend followers seeking to optimize their trading approach.

---


Prodotti consigliati
RBreaker
Zhong Long Wu
RBreaker Gold Indicators is a short-term intraday trading strategy for gold futures that combines trend following and intraday reversal approaches. It not only captures profits during trending markets but also enables timely profit-taking and counter-trend trading during market reversals. This strategy has been ranked among the top ten most profitable trading strategies by the American magazine   Futures Truth   for 15 consecutive years. It boasts a long lifecycle and remains widely used and st
Noize Absorption Index - is the manual trading system that measures the difference of pressure between bears forces and bulls forces. Green line - is a noize free index that showing curent situation. Zero value of index shows totally choppy/flat market.Values above zero level shows how powerfull bullish wave is and values below zero measures bearish forces.Up arrow appears on bearish market when it's ready to reverse, dn arrow appears on weak bullish market, as a result of reverse expectation.
FiveStarFX Gold Reversal Edge Professional automated trading solution designed for structured execution and controlled risk management in the Gold market. Built for traders who value discipline, precision, and consistency. Key Features Fully automated trading One trade at a time (controlled exposure) Fixed Stop Loss and Take Profit Smart Break-Even protection Profit lock with buffer Step-based trailing management Spread protection system Works on any broker Trade Management The E
FREE
This indicator builds a Pivot Anchored Volume Profile (VAP/VPOC approximation using tick volume) and automatically splits the profile into pivot-to-pivot segments , giving you a clean, TradingView-like view of where volume concentrated during each swing. It draws a horizontal histogram for every segment and highlights the Value Area and key levels, making it easy to spot acceptance/rejection zones, high-volume nodes, and potential support/resistance. Key Features Segmented Volume Profile (Pivot-
Liquidity Oscillator
Paolo Scopazzo
3 (2)
A powerful oscillator that provide Buy and Sell signals by calculating the investor liquidity. The more liquidity the more buy possibilities. The less liquidity the more sell possibilities. Please download the demo and run a backtest! HOW IT WORKS: The oscillator will put buy and sell arrow on the chart in runtime only . Top value is 95 to 100 -> Investors are ready to buy and you should follow. Bottom value is 5 to 0 -> Investors are ready to sell and you should follow. Alert + sound will appe
The Antique Trend Indicator is a revolutionary trend trading and filtering solution with all the important features of a trend tool built into one tool! The Antique Trend indicator is good for any trader, suitable for any trader both for Forex and binary options. There is no need to configure anything, everything has been perfected by time and experience, it works great during flats and trends. The Antique Trend indicator is a tool for technical analysis of financial markets, reflecting curren
The new update makes this indicator a complete tool for studying, analyzing and operating probabilistic patterns. It includes: On-chart Multi-asset percentage monitor. Configurable martingales. Twenty-one pre-configured patterns, including Mhi patterns and C3. An advanced pattern editor to store up to 5 custom patterns. Backtest mode to test results with loss reports. Trend filter. Hit operational filter. Martingale Cycles option. Various types of strategies and alerts. Confluence between patter
Overview This Dashboard provides comprehensive market analysis across 9 timeframes (D1 to M1) for ICT-based trading strategies. It identifies Order Blocks, Fair Value Gaps, candlestick patterns, breakouts, trend direction, RSI levels, and volume conditions simultaneously - solving the problem of monitoring multiple timeframes and setups manually. Key Features • Complete 9-timeframe analysis (D1, H4, H1, M30, M15, M5, M1) in one compact dashboard • Precision Order Block detection with rejection
Limitless MT5
Dmitriy Kashevich
Limitless MT5 is a universal indicator suitable for every beginner and experienced trader. works on all currency pairs, cryptocurrencies, raw stocks Limitless MT5 - already configured and does not require additional configuration And now the main thing Why Limitless MT5? 1 complete lack of redrawing 2 two years of testing by the best specialists in trading 3 the accuracy of correct signals exceeds 80% 4 performed well in trading during news releases Trading rules 1 buy signal - the ap
Ichimoku Aiko MTF
Michael Jonah Randriamampionontsoa
Ichimoku Aiko MTF is a collection of technical indicators that show support and resistance levels, as well as momentum and trend direction. It is a multi-timeframe indicator so you don't need to change the chart timeframe when you want to see the ichimoku clouds on a higher timeframe.  eg. The chart timeframe is M15 and you want to see on the M15 timeframe chart the H1 ichimoku indicators (the ichimoku in Metatrader can't do that) that's why you need to use Ichimoku Aiko MTF.
Indicatore Balance of Power (BOP) con supporto multi-timeframe, segnali visivi personalizzabili e sistema di avvisi configurabile. I servizi di programmazione freelance, gli aggiornamenti e altri prodotti TrueTL sono disponibili nel mio profilo MQL5 . Feedback e recensioni sono molto apprezzati! Cos'è il BOP? Balance of Power (BOP) è un oscillatore che misura la forza degli acquirenti rispetto ai venditori confrontando la variazione del prezzo con il range della candela. L'indicatore viene ca
FREE
L'indicateur SMC Venom Model BPR est un outil professionnel pour les traders travaillant dans le concept Smart Money (SMC). Il identifie automatiquement deux modèles clés sur le graphique des prix: FVG   (Fair Value Gap) est une combinaison de trois bougies, dans laquelle il y a un écart entre la première et la troisième bougie. Forme une zone entre les niveaux où il n'y a pas de support de volume, ce qui conduit souvent à une correction des prix. BPR   (Balanced Price Range) est une combinaiso
Tma Poc Gold
Ignacio Agustin Mene Franco
POC + TMA SCALPER GOLD - Expert Advisor Professional DESCRIPTION: Automated trading system designed specifically for XAU/USD, combining Point of Control (POC) with Triangular Moving Average (TMA) to identify high-volume and trending zones. It uses advanced risk management with dynamic trailing stops and an intelligent grid system. TECHNICA
MT5 Arrow Indicator   is a momentum-based technical indicator for   MetaTrader 5 , designed to provide   clear buy and sell arrow signals   based on market momentum. The indicator generates   non-repainting signals   and includes a   built-in alert system   to notify traders when new signals appear. Key Features  Non-Repainting Arrow Signals Signals are confirmed after candle close Historical arrows do not change Suitable for backtesting and live trading  Buy & Sell Logic Buy Arrow   appears whe
This trading indicator is non-repainting, non-redrawing, and non-lagging, making it an ideal choice for both manual and automated trading. It is a Price Action–based system that leverages price strength and momentum to give traders a real edge in the market. With advanced filtering techniques to eliminate noise and false signals, it enhances trading accuracy and potential. By combining multiple layers of sophisticated algorithms, the indicator scans the chart in real-time and translates comple
Prizmal Logic
Vladimir Lekhovitser
5 (1)
Segnale di trading in tempo reale Monitoraggio pubblico in tempo reale dell’attività di trading: https://www.mql5.com/it/signals/2353471 Informazioni ufficiali Profilo del venditore Canale ufficiale Manuale utente Istruzioni di configurazione e utilizzo: Apri manuale utente Questo Expert Advisor si basa su una strategia di trading guidata da regole. La strategia è orientata a identificare condizioni di mercato specifiche, anziché mantenere una presenza costante sul mercato. Il sistema
Long&Short Cointegration Analyzer An advanced tool for traders looking to profit from cointegration. Analyzes any asset pair for Long&Short strategies. What does the Long&Short Cointegration Analyzer do? Identifies cointegrated pairs that revert to the mean, ideal for profitable trades. Provides a detailed panel with statistical data for confident decisions. Works with any currency pair, on any timeframe. Find buying and selling opportunities based on cointegration. Minimize risks with a relia
Your Trend Friend
Luigi Nunes Labigalini
5 (1)
The trend is your friend! Look at the color of the indicator and trade on that direction. It does not  repaint. After each candle is closed, that's the color of the trend. You can focus on shorter faster trends or major trends, just test what's most suitable for the symbol and timeframe you trade. Simply change the "Length" parameter and the indicator will automatically adapt. You can also change the color, thickness and style of the lines. Download and give it a try! There are big movements w
STRICTLY FOR BOOM INDEX ONLY!!!!! Here I bring the Maximum Trend Arrows OT1.0 MT5 indicator. This indicator is made up of a combination of different trend indicators for entries and exits, for entries an orange arrow will paint on the chart below the current market and a red flag for closing of trades and it produces buy arrows only. When the orange arrow appears, it will appear along with it's sound to notify you. The 1H timeframe is recommended, don't use it anywhere else than on the 1H timefr
All-in-One Chart Patterns Professional Level: The Ultimate 36-Pattern Trading System All-in-One Chart Patterns Professional Level is a comprehensive 36-pattern indicator well known by retail traders, but significantly enhanced with superior accuracy through integrated news impact analysis and proper market profile positioning. This professional-grade trading tool transforms traditional pattern recognition by combining advanced algorithmic detection with real-time market intelligence.  CORE FEATU
FREE
Owl Smart Levels MT5
Sergey Ermolov
4.03 (32)
Versione MT4  |  FAQ L' indicatore Owl Smart Levels è un sistema di trading completo all'interno dell'unico indicatore che include strumenti di analisi di mercato popolari come i frattali avanzati di Bill Williams , Valable ZigZag che costruisce la corretta struttura a onde del mercato, e i livelli di Fibonacci che segnano i livelli esatti di entrata nel mercato e luoghi per prendere profitti. Descrizione dettagliata della strategia Istruzioni per lavorare con l'indicatore Consulente-assistente
ROMAN5 Time Breakout Indicator automatically draws the boxes for daily support and resistance breakouts. It helps the user identifying whether to buy or sell. It comes with an alert that will sound whenever a new signal appears. It also features an email facility. Your email address and SMTP Server settings should be specified in the settings window of the "Mailbox" tab in your MetaTrader 5. Blue arrow up = Buy. Red arrow down = Sell. You can use one of my Trailing Stop products that automatical
FREE
Candle Pattern Finder MT5
Pavel Zamoshnikov
4.2 (5)
This indicator searches for candlestick patterns. Its operation principle is based on Candlestick Charting Explained: Timeless Techniques for Trading Stocks and Futures by Gregory L. Morris. If a pattern is detected, the indicator displays a message at a bar closure. If you trade using the MetaTrader 4 terminal, then you can download the full analogue of the " Candle Pattern Finder for MT4 " indicator It recognizes the following patterns: Bullish/Bearish (possible settings in brackets) : Hammer
Gecko EA MT5
Profalgo Limited
5 (1)
NEW PROMO: Only a few copies copies available at 349$ Next price: 449$ Make sure to check out our " Ultimate EA combo package " in our   promo blog ! Gecko runs a simple, yet very effective, proven strategy.  It looks for important recent support and resistance levels and will trade the breakouts.  This is a "real" trading system, which means it will use a SL to protect the account.  It also means it will not use any dangerous techniques like martingale, grid or averaging down. The EA shows its
Bollinger Trend Lines – MT4 & MT5 Bollinger Trend Lines is a professional volatility-based trend indicator designed to clearly identify trend direction and dynamic stop levels using Bollinger Bands. Fuses on one core principle: follow the trend, ignore noise, and let volatility define the stop. How it works The indicator builds trailing trend lines using Bollinger Bands: In an uptrend , the lower band trails price and can only rise In a downtrend , the upper band trails price and can only
Range Directional Force Indicator – Designed for You to Optimize! The Range Directional Force Indicator is a cutting-edge tool designed to empower traders by visualizing market dynamics and directional strength. Built to offer insights into market trends and reversals, this indicator is an invaluable asset for traders seeking precision in their strategies. However, it is important to note that this indicator is not optimized, leaving room for you to tailor it to your unique trading preferences.
Una delle sequenze numeriche è chiamata "Sequenza di incendi boschivi". È stata riconosciuta come una delle nuove sequenze più belle. La sua caratteristica principale è che questa sequenza evita andamenti lineari, anche quelli più brevi. È questa proprietà che ha costituito la base di questo indicatore. Quando si analizza una serie temporale finanziaria, questo indicatore cerca di rifiutare tutte le possibili opzioni di tendenza. E solo se fallisce, riconosce la presenza di una tendenza e dà il
The Riko Trend indicator is a revolutionary trend trading and filtering solution with all the important features of a trend tool built into one tool! The Riko Trend indicator is good for any trader, suitable for any trader for both forex and binary options. You don’t need to configure anything, everything is perfected by time and experience, it works great during a flat and in a trend. The Riko Trend indicator is a technical analysis tool for financial markets that reflects the current price f
MTF Candles Overlay - Professional Multi-Timeframe Analysis Tool (Now with Yearly Y1 timeframe!) The MTF  Candles Overlay is a powerful and visually intuitive indicator that allows traders to view candles from higher timeframes directly overlaid on their current chart. This eliminates the need to constantly switch between multiple timeframe charts, enabling faster analysis and better trading decisions. Key Features Complete Timeframe Coverage All Standard Timeframes : M1, M2, M3, M4, M5, M6, M1
PipFinite Breakout EDGE MT5
Karlo Wilson Vendiola
4.81 (93)
The Missing Edge You Need To Catch Breakouts Like A Pro. Follow a step-by-step system that detects the most powerful breakouts! Discover market patterns that generate massive rewards based on a proven and tested strategy. Unlock Your Serious Edge Important information here www.mql5.com/en/blogs/post/723208 The Reliable Expert Advisor Version Automate Breakout EDGE signals using "EA Breakout EDGE" Click Here Have access to the game changing strategy that will take your trading to the next l
Gli utenti di questo prodotto hanno anche acquistato
Divergence Bomber
Ihor Otkydach
4.89 (83)
Ogni acquirente dell’indicatore riceverà inoltre gratuitamente: L’utilità esclusiva “Bomber Utility”, che gestisce automaticamente ogni operazione, imposta i livelli di Stop Loss e Take Profit e chiude le posizioni secondo le regole della strategia I file di configurazione (set file) per adattare l’indicatore a diversi asset I set file per configurare il Bomber Utility in tre modalità: “Rischio Minimo”, “Rischio Bilanciato” e “Strategia di Attesa” Una guida video passo-passo per installare, conf
Azimuth Pro
Ottaviano De Cicco
5 (4)
LAUNCH PROMO Azimuth Pro price is initially set at 299$ for the first 100 buyers. Final price will be 499$ . THE DIFFERENCE BETWEEN RETAIL AND INSTITUTIONAL ENTRIES ISN'T THE INDICATOR — IT'S THE LOCATION. Most traders enter at arbitrary price levels, chasing momentum or reacting to lagging signals. Institutions wait for price to reach structured levels where supply and demand actually shift. Azimuth Pro maps these levels automatically: swing-anchored VWAP, multi-timeframe structure lines, an
Trend Screener Pro MT5
STE S.S.COMPANY
4.84 (101)
Indicatore di tendenza, soluzione unica rivoluzionaria per il trading di tendenze e il filtraggio con tutte le importanti funzionalità di tendenza integrate in un unico strumento! È un indicatore multi-timeframe e multi-valuta al 100% non ridipingibile che può essere utilizzato su tutti i simboli/strumenti: forex, materie prime, criptovalute, indici e azioni. Trend Screener è un indicatore di tendenza che segue un indicatore efficiente che fornisce segnali di tendenza a freccia con punti nel gra
Grabber System MT5
Ihor Otkydach
4.82 (22)
Ti presento un eccellente indicatore tecnico: Grabber, che funziona come una strategia di trading "tutto incluso", pronta all’uso. In un solo codice sono integrati strumenti potenti per l’analisi tecnica del mercato, segnali di trading (frecce), funzioni di allerta e notifiche push. Ogni acquirente di questo indicatore riceve anche gratuitamente: L’utility Grabber: per la gestione automatica degli ordini aperti Video tutorial passo dopo passo: per imparare a installare, configurare e utilizzare
AriX
Temirlan Kdyrkhan
1 (4)
AriX Indicator for MT5 A powerful trend-following and signal-evaluation tool AriX is a custom MT5 indicator that combines Moving Averages and ATR-based risk/reward logic to generate clear buy/sell signals. It visualizes dynamic SL/TP levels, evaluates past trade outcomes, and displays win/loss statistics in a clean on-chart panel. Key features include: Buy/Sell signals based on MA crossovers ATR-based SL/TP1/TP2/TP3 levels with visual lines and labels Signal outcome tracking with real-time stat
OmniSync Projection
Antonio-alin Teculescu
5 (1)
Chronos Fractal Engine is an innovative price projection indicator for MetaTrader 5, designed to transform your technical analysis by intelligently identifying and projecting historical price patterns. Built upon an advanced correlation algorithm and the fractal principles of the market, this powerful tool visualizes potential future price movements, giving you a unique edge in your trading decisions. What is Chronos Fractal Engine? At its core, the Chronos Fractal Engine employs a sophisticat
RFI levels PRO MT5
Roman Podpora
3.67 (3)
L'indicatore mostra accuratamente i punti di inversione e le zone di ritorno dei prezzi in cui il       Principali attori   . Vedi dove si formano le nuove tendenze e prendi decisioni con la massima precisione, mantenendo il controllo su ogni operazione. VERSION MT4     -    Rivela il suo massimo potenziale se combinato con l'indicatore   TREND LINES PRO Cosa mostra l'indicatore: Strutture di inversione e livelli di inversione con attivazione all'inizio di un nuovo trend. Visualizzazione dei li
Innanzitutto, vale la pena sottolineare che questo Strumento di Trading è un Indicatore Non-Ridipingente, Non-Ridisegnante e Non-Laggante, il che lo rende ideale per il trading professionale. Corso online, manuale utente e demo. L'Indicatore Smart Price Action Concepts è uno strumento molto potente sia per i nuovi che per i trader esperti. Racchiude più di 20 utili indicatori in uno solo, combinando idee di trading avanzate come l'Analisi del Trader del Circolo Interno e le Strategie di Tradin
Presentazione       Quantum Breakout PRO   , l'innovativo indicatore MQL5 che sta trasformando il modo in cui scambi le zone di breakout! Sviluppato da un team di trader esperti con un'esperienza di trading di oltre 13 anni,       Quantum Breakout PRO       è progettato per spingere il tuo viaggio di trading a nuovi livelli con la sua strategia innovativa e dinamica della zona di breakout. Quantum Breakout Indicator ti fornirà frecce di segnalazione sulle zone di breakout con 5 zone target di
ARIPoint
Temirlan Kdyrkhan
ARIPoint is a powerful trading companion designed to generate high-probability entry signals with dynamic TP/SL/DP levels based on volatility. Built-in performance tracking shows win/loss stats, PP1/PP2 hits, and success rates all updated live. Key Features: Buy/Sell signals with adaptive volatility bands Real-time TP/SL/DP levels based on ATR Built-in MA Filter with optional ATR/StdDev volatility Performance stats panel (Success, Profit/Loss, PP1/PP2) Alerts via popup, sound, push, or email Cu
RelicusRoad Pro: Sistema Operativo Quantitativo di Mercato 70% DI SCONTO ACCESSO A VITA (TEMPO LIMITATO) - UNISCITI A 2.000+ TRADER Perché la maggior parte dei trader fallisce anche con indicatori "perfetti"? Perché operano su Singoli Concetti isolati. Un segnale senza contesto è una scommessa. Per vincere serve CONFLUENZA . RelicusRoad Pro non è un semplice indicatore. È un Ecosistema Quantitativo completo . Mappa la "Fair Value Road", distinguendo tra rumore e rotture strutturali. Smetti di in
Quantum TrendPulse
Bogdan Ion Puscasu
5 (22)
Ecco   Quantum TrendPulse   , lo strumento di trading definitivo che combina la potenza di   SuperTrend   ,   RSI   e   Stocastico   in un unico indicatore completo per massimizzare il tuo potenziale di trading. Progettato per i trader che cercano precisione ed efficienza, questo indicatore ti aiuta a identificare con sicurezza le tendenze di mercato, i cambiamenti di momentum e i punti di entrata e uscita ottimali. Caratteristiche principali: Integrazione SuperTrend:   segui facilmente l'andame
PZ Swing Trading MT5
PZ TRADING SLU
5 (5)
Protect against whipsaws: revolutionize your swing trading approach Swing Trading is the first indicator designed to detect swings in the direction of the trend and possible reversal swings. It uses the baseline swing trading approach, widely described in trading literature. The indicator studies several price and time vectors to track the aggregate trend direction and detects situations in which the market is oversold or overbought and ready to correct. [ Installation Guide | Update Guide | Tro
Btmm state engine pro
Garry James Goodchild
5 (2)
Get the user guide here  https://g-labs.software/guides/BTMM_State_Engine_Welcome_Pack.html BTMM State Engine Pro — the   all-in-one Banks   & Institutions Market Maker indicator for Meta Trader 5. Built for   BTMM traders who follow the Asian   session breakout methodology with Kill Zone timing , level stacking, peak formation detection , and multi-pair scanning — all   from a single chart. Combines   a full BTMM State Engine   with a built-in multi-pair Scanner dashboard, eliminating the need
Easy SMC Trading
Israr Hussain Shah
4 (1)
Structure Trend con Auto RR e Scanner BOS Versione: 1.0 Panoramica Structure Trend con Auto RR è un sistema di trading completo progettato per i trader che si affidano all'azione del prezzo e alla struttura del mercato. Combina un filtro di tendenza levigato con il rilevamento dei punti swing e i segnali di rottura della struttura (BOS) per generare configurazioni di trading ad alta probabilità. La caratteristica distintiva di questo strumento è la gestione automatica del rischio. Al rilevame
Trade smarter, not harder: Empower your trading with Harmonacci Patterns This is arguably the most complete harmonic price formation auto-recognition indicator you can find for the MetaTrader Platform. It detects 19 different patterns, takes fibonacci projections as seriously as you do, displays the Potential Reversal Zone (PRZ) and finds suitable stop-loss and take-profit levels. [ Installation Guide | Update Guide | Troubleshooting | FAQ | All Products ] It detects 19 different harmonic pri
L'indicatore " Dynamic Scalper System MT5 " è progettato per il metodo di scalping, ovvero per il trading all'interno di onde di trend. Testato sulle principali coppie di valute e sull'oro, è compatibile con altri strumenti di trading. Fornisce segnali per l'apertura di posizioni a breve termine lungo il trend, con ulteriore supporto al movimento dei prezzi. Il principio dell'indicatore. Le frecce grandi determinano la direzione del trend. Un algoritmo per generare segnali per lo scalping sott
Meta Cipher B
SILICON HALLWAY PTY LTD
Meta Cipher B: la suite di oscillatori tutto-in-uno per MT5 Meta Cipher B porta il popolare concetto di Market Cipher B su MetaTrader 5, ottimizzato per velocità e precisione. Progettato da zero per offrire prestazioni elevate, fornisce segnali di livello professionale senza ritardi o rallentamenti. Sebbene sia potente anche da solo, Meta Cipher B è stato creato per combinarsi naturalmente con Meta Cipher A , offrendo una visione completa del mercato e una conferma più profonda delle analisi. C
Top indicator for MT5   providing accurate signals to enter a trade without repainting! It can be applied to any financial assets:   forex, cryptocurrencies, metals, stocks, indices .  Watch  the video  (6:22) with an example of processing only one signal that paid off the indicator! MT4 version is here It will provide pretty accurate trading signals and tell you when it's best to open a trade and close it. Most traders improve their trading results during the first trading week with the help of
TPSpro RFI Levels MT5
Roman Podpora
4.53 (19)
ISTRUZIONI RUS  /  ISTRUZIONI   ENG  /  Versione MT4 Funzioni principali: Visualizza le zone attive di venditori e acquirenti! L'indicatore mostra tutti i livelli/zone di primo impulso corretti per acquisti e vendite. Quando questi livelli/zone vengono attivati, ovvero dove inizia la ricerca dei punti di ingresso, i livelli cambiano colore e vengono riempiti con colori specifici. Vengono visualizzate anche delle frecce per una percezione più intuitiva della situazione. LOGIC AI - Visualizzazion
TPA True Price Action indicator reveals the true price action of the market makers through 100% non-repainting signals strictly at the close of a candle! TPA shows entries and re-entries, every time the bulls are definitely stronger than the bears and vice versa. Not to confuse with red/green candles. The shift of power gets confirmed at the earliest stage and is ONE exit strategy of several. There are available now two free parts of the TPA User Guide for our customers. The first "The Basics"
Trend Forecaster
Alexey Minkov
5 (7)
The Trend Forecaster indicator utilizes a unique proprietary algorithm to determine entry points for a breakout trading strategy. The indicator identifies price clusters, analyzes price movement near levels, and provides a signal when the price breaks through a level. The Trend Forecaster indicator is suitable for all financial assets, including currencies (Forex), metals, stocks, indices, and cryptocurrencies. You can also adjust the indicator to work on any time frames, although it is recommen
CGE Trading Suite
Carl Gustav Johan Ekstrom
5 (1)
CGE Trading Suite delivers the analytical edge typically reserved for professional trading desks. The platform integrates a full suite of analytical tools into one seamless workflow: dynamic grid mapping, liquidity behavior analysis, ECM, trend lines, MIDAS, trade cycles, and directional channel projections. Together, these provide a unified view of market structure and momentum. Directional clarity is further enhanced by the capital flow index, which measures currency basket strength to identif
Order Block Pro MT5
N'da Lemissa Kouame
Order Block Pro (MQL5) – Versione 1.0 Autore: KOUAME N'DA LEMISSA Piattaforma: MetaTrader 5 Descrizione: Order Block Pro è un indicatore avanzato progettato per rilevare automaticamente Order Block rialzisti e ribassisti sul tuo grafico. Analizzando candele di consolidamento seguite da candele impulsive forti, l’indicatore evidenzia le aree chiave dove il prezzo è destinato a muoversi rapidamente. Ideale per trader che vogliono: Identificare punti di ingresso e uscita precisi. Rilevare zone din
Berma Bands
Muhammad Elbermawi
5 (8)
L'indicatore Berma Bands (BBs) è uno strumento prezioso per i trader che cercano di identificare e capitalizzare i trend di mercato. Analizzando la relazione tra il prezzo e le BBs, i trader possono discernere se un mercato è in una fase di trend o di range. Visita il [ Berma Home Blog ] per saperne di più. Le Berma Bands sono composte da tre linee distinte: la Upper Berma Band, la Middle Berma Band e la Lower Berma Band. Queste linee sono tracciate attorno al prezzo, creando una rappresentazion
Advanced Supply Demand MT5
Bernhard Schweigert
4.53 (15)
La migliore soluzione per qualsiasi principiante o trader esperto! Questo indicatore è uno strumento di trading unico, di alta qualità e conveniente perché abbiamo incorporato una serie di funzionalità proprietarie e una nuova formula. Con questo aggiornamento, sarai in grado di mostrare fusi orari doppi. Non solo potrai mostrare una TF più alta, ma anche entrambe, la TF del grafico, PIÙ la TF più alta: SHOWING NESTED ZONES. Tutti i trader di domanda di offerta lo adoreranno. :) Informazioni imp
Ultimate SMC Indicator
Hicham Mahmoud Almoustafa
1 (1)
Ultimate SMC PRO – Smart Money Concepts Indicator (Order Blocks, FVG, Liquidity, BOS) for MetaTrader 5   After purchasing the product, you will receive an additional copy for free. Just contact me after your purchase. Ultimate SMC PRO is a professional trading indicator designed to visualize Smart Money Concepts directly on the chart. The indicator combines several institutional trading tools in one system to help traders identify potential high-probability trading zones. ULTIMATE SMC INDICATO
FootprintOrderflow
Jingfeng Luo
5 (3)
FOOTPRINTORDERFLOW: The Authoritative Guide ( This indicator is also compatible with economic providers that do not offer DOM data and BID/ASK data, It also supports various foreign exchange transactions, DEMO version,modleling must choose " Every tick based on real ticks"  ) Important notice: Before placing an order, please contact me first, and I will provide you with professional answers and services 1. Overview FOOTPRINTORDERFLOW  is an advanced Order Flow analysis tool designed for MetaTra
Gartley Hunter Multi
Siarhei Vashchylka
5 (11)
Gartley Hunter Multi - An indicator for searching for harmonic patterns simultaneously on dozens of trading instruments and on all possible timeframes. Manual (Be sure to read before purchasing) | Version for MT4 Advantages 1. Patterns: Gartley, Butterfly, Shark, Crab. Bat, Alternate Bat, Deep Crab, Cypher 2. Simultaneous search for patterns on dozens of trading instruments and on all possible timeframes 3. Search for patterns of all possible sizes. From the smallest to the largest 4. All fou
Scalping Lines System MT5 - è un sistema di trading scalping specificamente progettato per il trading dell'oro, l'asset XAUUSD, su timeframe M1-H1. Combina indicatori per l'analisi di trend, volatilità e ipercomprato/ipervenduto, riuniti in un unico oscillatore per l'identificazione di segnali a breve termine. I principali parametri interni per le linee di segnale sono preconfigurati. Alcuni parametri possono essere modificati manualmente: "Durata dell'onda di tendenza", che regola la durata di
Altri dall’autore
# Power Assisted Trend Following Indicator ## Overview The PowerIndicator is an implementation of the "Power Assisted Trend Following" methodology developed by Dr. Andreas A. Aigner and Walter Schrabmair. This indicator builds upon and improves J. Welles Wilder's trend following concepts by applying principles from signal analysis to financial markets. The core insight of this indicator is that successful trend following requires price movements to exceed a certain threshold (typically a mul
FREE
# Expert Advisor di Trend Following di Wilders Ottimizzato con Regolazione Automatica e Controllo VIX ## Panoramica L'Expert Advisor di Trend Following di Wilders Ottimizzato con Regolazione Automatica e Controllo VIX è un sistema di trading avanzato per MetaTrader 5 che implementa una sofisticata strategia di trend following basata sui concetti di Welles Wilder, arricchita con moderne tecniche di gestione del rischio. Questo EA combina diverse funzionalità innovative per adattarsi alle mutev
Hidden Markov Model 4
Andreas Alois Aigner
HMM4 Indicator Documentation HMM4 Indicator Documentation Introduction The HMM4 indicator is a powerful technical analysis tool that uses a 4-Gaussian Hidden Markov Model (HMM) to identify market regimes and predict potential market direction. This indicator applies advanced statistical methods to price data, allowing traders to recognize bull and bear market conditions with greater accuracy. The indicator displays a stacked line chart in a separate window, representing the mixture weights of f
Filtro:
Nessuna recensione
Rispondi alla recensione