Wilders Volatility Trend Following Optimised

# Wilders Volatility Trend Following Optimised 지표 문서

## 소개

Wilders Volatility Trend Following Optimised 지표는 MetaTrader 5를 위한 정교한 추세 추종 기술 분석 도구입니다. 이 지표는 시장 상황에 동적으로 적응하는 고급 적응형 추세 추종 시스템을 구현하여 트레이더에게 명확한 진입 및 퇴출 신호를 제공하는 동시에 최적의 이익 실현 및 손절매 수준을 자동으로 계산합니다.

이 지표는 추세 기반 전략을 따르는 트레이더를 위해 설계되었으며, 시장 변동성 변화에 대응하는 적응형 리스크 매개변수를 통해 거래 관리를 최적화하는 것을 목표로 합니다.

## 주요 기능

- **적응형 추세 추종**: 시장 추세를 자동으로 식별하고 추적
- **동적 포지션 관리**: 최적의 진입, 퇴출, 손절매 및 이익 실현 수준 계산
- **변동성 기반 매개변수**: 평균 실제 범위(ATR)를 사용하여 시장 변동성에 적응
- **적응형 가속 요소(AFX)**: 가속 요소 간의 시그모이드 기반 전환 구현
- **부드러운 이익 실현 계산**: 자연스러운 이익 목표 전환을 위한 쌍곡선 탄젠트 함수 사용
- **트레일링 스톱**: 이익을 확보하는 지능형 트레일링 스톱 메커니즘 구현
- **시각적 피드백**: 화살표, 선, 텍스트 주석을 포함한 포괄적인 시각적 요소 제공
- **글로벌 변수 내보내기**: 주요 값을 다른 지표 및 EA에서 사용 가능하게 함

## 기술적 접근 방식

### 추세 추종 방법론

이 지표는 정지 및 반전(SAR) 메커니즘을 사용하는 추세 기반 접근 방식을 따릅니다. 현재 포지션(롱 또는 숏)을 유지하고 현재 포지션에 진입한 이후 가장 유리한 가격을 나타내는 중요 종가(SIC) 값을 추적합니다.

SAR 수준은 다음과 같이 계산됩니다:
```
SAR = SIC - FLIP * ACC * ATR
```
여기서:
- `SIC`는 중요 종가 값
- `FLIP`은 포지션 방향(롱의 경우 1, 숏의 경우 -1)
- `ACC`는 가속 요소
- `ATR`은 평균 실제 범위

가격이 현재 포지션과 반대 방향으로 SAR 수준을 교차할 때, 지표는 포지션을 반전시키는 신호를 생성합니다.

### 적응형 가속 요소(AFX)

이 지표의 가장 혁신적인 측면 중 하나는 적응형 가속 요소(AFX) 계산입니다. 이는 가격 움직임에 기반하여 다른 가속 요소 값 사이의 부드러운 전환을 만들기 위해 시그모이드 함수를 사용합니다:

```
AF_X = af_start + (af_end - af_start) * sigmoid_x
```

시그모이드 함수는 S자 모양의 곡선을 만들어 전환이 갑작스럽지 않고 부드럽게 합니다. 이 적응형 접근 방식은 지표가 다음을 수행할 수 있게 합니다:

1. 거래에 숨쉴 공간을 주기 위해 더 넓은 스톱으로 시작
2. 거래가 유리하게 움직임에 따라 점차 조여짐
3. 특정 임계값을 넘으면 트레일링 메커니즘으로 이익 확보
4. ATR을 통해 시장 변동성에 적응

### 동적 이익 실현 계산

이 지표는 쌍곡선 탄젠트 함수를 사용한 정교한 이익 실현 계산을 구현합니다:

```
profitMultiplier = 1.0 + profitRange * transitionFactor
```

여기서 `transitionFactor`는 사용자 정의 쌍곡선 탄젠트 구현을 사용하여 계산됩니다. 이는 다음과 같은 동적 이익 실현을 만듭니다:

- 최소 수준(SIC_SNAP ± ATR * ACC * PROFIT_MIN)에서 시작
- 최대 수준(SIC_SNAP ± ATR * ACC * PROFIT_MAX)을 향해 점차 증가
- 가격이 기본 수준에서 얼마나 멀리 이동했는지에 기반한 부드러운 전환 사용
- ATR 값을 통해 시장 변동성에 적응

## 주요 구성 요소

### 중요 종가(SIC)

중요 종가(SIC)는 이 지표의 핵심 개념입니다. 현재 포지션에 진입한 이후 가장 유리한 가격 수준을 나타냅니다:

- 롱 포지션의 경우: SIC는 포지션에 진입한 이후 가장 높은 종가
- 숏 포지션의 경우: SIC는 포지션에 진입한 이후 가장 낮은 종가

SIC는 SAR 수준 및 기타 중요한 값을 계산하기 위한 참조점 역할을 합니다.

### 평균 실제 범위(ATR)

이 지표는 ATR을 사용하여 시장 변동성을 측정하고 그에 따라 다양한 계산을 조정합니다. ATR은 스무딩 접근 방식을 사용하여 계산됩니다:

```
ATR = Alpha * TR + (1 - Alpha) * previous_ATR
```

여기서:
- `TR`(실제 범위)는 현재 고가-저가 범위, 현재 고가-이전 종가, 또는 현재 저가-이전 종가의 최대값
- `Alpha`는 스무딩 요소(기본값 1/7)

### 포지션 추적 및 신호 생성

이 지표는 현재 시장 포지션(롱, 숏 또는 없음)을 추적하고 네 가지 조건에 기반하여 신호를 생성합니다:

1. 롱 포지션이고 현재 가격이 손절매 이하인 경우, 숏으로 전환
2. 숏 포지션이고 현재 가격이 손절매 이상인 경우, 롱으로 전환
3. 롱 포지션이고 현재 가격이 SAR 이하인 경우, 숏으로 전환
4. 숏 포지션이고 현재 가격이 SAR 이상인 경우, 롱으로 전환

포지션 변경이 발생하면, 지표는 다음을 수행합니다:
- SIC 및 ATR_SNAP 값 업데이트
- 경계 돌파 플래그 재설정
- 차트에 화살표 및 수직선 그리기
- 모든 시각적 요소 업데이트

### 경계 돌파 메커니즘

이 지표는 상한 및 하한 시스템을 구현합니다:

```
upperBound = SIC_SNAP + ATR_SNAP * ACC
lowerBound = SIC_SNAP - ATR_SNAP * ACC
```

가격이 유리한 방향으로 이러한 경계를 돌파하면, 지표는 유리한 방향으로만 이동하는 트레일링 스톱 메커니즘을 활성화하여 이익을 확보합니다.
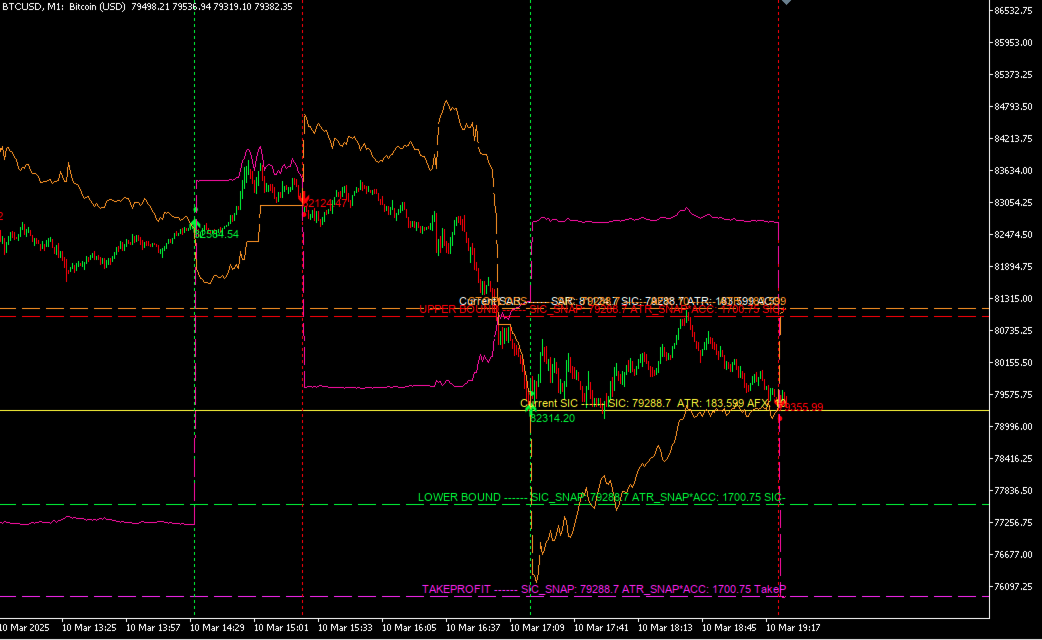
## 시각적 요소

이 지표는 차트에 여러 시각적 요소를 생성합니다:

### 화살표 및 선

- **롱/숏 화살표**: 포지션 변경을 나타내는 녹색(롱) 또는 빨간색(숏) 화살표
- **SAR 선**: 현재 SAR 수준을 보여주는 수평선
- **SIC 선**: 현재 중요 종가 수준을 보여주는 수평선
- **상한/하한 선**: 상한 및 하한을 보여주는 수평선
- **이익 실현 선**: 계산된 이익 실현 수준을 보여주는 마젠타색 점선
- **손절매 선**: 계산된 손절매 수준을 보여주는 주황색 점선
- **수직선**: 포지션 변경 지점을 표시하는 점선 수직선

### 텍스트 주석

이 지표는 차트에 다양한 값을 설명하는 텍스트 주석을 추가합니다:

- SAR 수준 및 계산 세부 정보
- SIC 값 및 관련 매개변수
- 상한 및 하한 값
- 이익 실현 및 손절매 수준 계산 세부 정보

## 입력 매개변수

| 매개변수 | 기본값 | 설명 |
|-----------|---------|-------------|
| Timeframe | PERIOD_M1 | 지표를 실행할 시간 프레임 |
| UseATRSnap | true | 계산에 ATR 스냅샷(true) 또는 실시간 ATR(false) 사용 |
| UseGlobalATRTR | false | 글로벌 TF1_ATRTR_TR 및 TF1_ATRTR_ATR 변수 사용 |
| SARLineColor | clrWhite | SAR 선 색상 |
| SICLineColor | clrYellow | SIC 선 색상 |
| ACC | 10.0 | 기본 가속 요소 |
| Alpha | 1.0/7.0 | ATR 스무딩 요소 |
| ArrowSize | 3 | 화살표 기호 크기 |
| LongColor | clrLime | 롱 신호 색상 |
| ShortColor | clrRed | 숏 신호 색상 |
| LongArrowCode | 233 | 롱 화살표 기호 코드 |
| ShortArrowCode | 234 | 숏 화살표 기호 코드 |
| AF_MIN | 1.0 | AFX 계산의 최소 가속 요소 |
| AF_MAX | 15.0 | AFX 계산의 최대 가속 요소 |
| K_Smooth | 3.0 | AFX 계산의 스무딩 매개변수 |
| StopLossColor | clrOrange | 손절매 선 색상 |

## 글로벌 변수

이 지표는 다른 지표나 EA에서 사용할 수 있는 여러 글로벌 변수를 내보냅니다:

| 글로벌 변수 | 설명 |
|-----------------|-------------|
| TF_TF_O_[ChartID]_currentPrice | 현재 가격 |
| TF_TF_O_[ChartID]_TR | 실제 범위 값 |
| TF_TF_O_[ChartID]_ATR | 평균 실제 범위 값 |
| TF_TF_O_[ChartID]_SIC | 중요 종가 값 |
| TF_TF_O_[ChartID]_SIC_SNAP | 포지션 변경 시 SIC 값 |
| TF_TF_O_[ChartID]_ATR_SNAP | 포지션 변경 시 ATR 값 |
| TF_TF_O_[ChartID]_ACC | 가속 요소 |
| TF_TF_O_[ChartID]_afx | 적응형 가속 요소 |
| TF_TF_O_[ChartID]_FLIP | 포지션 방향(1 또는 -1) |
| TF_TF_O_[ChartID]_CurrentPosition | 현재 포지션(롱의 경우 1, 숏의 경우 -1) |
| TF_TF_O_[ChartID]_K | 스무딩 매개변수 |
| TF_TF_O_[ChartID]_SAR | 정지 및 반전 수준 |
| TF_TF_O_[ChartID]_upperBound | 상한 값 |
| TF_TF_O_[ChartID]_upperBoundBreached | 상한이 돌파되었는지 여부를 나타내는 플래그 |
| TF_TF_O_[ChartID]_lowerBound | 하한 값 |
| TF_TF_O_[ChartID]_lowerBoundBreached | 하한이 돌파되었는지 여부를 나타내는 플래그 |
| TF_TF_O_[ChartID]_TakeProfit | 이익 실현 수준 |
| TF_TF_O_[ChartID]_StopLoss | 손절매 수준 |

## 거래 신호 해석

### 진입 신호

- **롱 진입**: 숏 포지션 중 가격이 SAR 수준을 위로 교차할 때, 또는 숏 포지션 중 가격이 손절매 수준을 위로 교차할 때
- **숏 진입**: 롱 포지션 중 가격이 SAR 수준을 아래로 교차할 때, 또는 롱 포지션 중 가격이 손절매 수준을 아래로 교차할 때

### 퇴출 신호

- **롱 퇴출**: 가격이 SAR 수준 또는 손절매 수준을 아래로 교차할 때
- **숏 퇴출**: 가격이 SAR 수준 또는 손절매 수준을 위로 교차할 때

### 리스크 관리

이 지표는 시장 상황에 적응하는 동적 손절매 및 이익 실현 수준을 제공합니다:

- **손절매**: 처음에는 SIC에서 ATR * ACC 거리에 설정되지만, 거래가 진행됨에 따라 AFX 계산을 사용하여 적응
- **이익 실현**: 최소 수준에서 시작하여 거래가 유리하게 움직임에 따라 증가하는 부드러운 전환 함수를 사용하여 계산

## 고급 개념

### 시그모이드 기반 전환

AFX 계산은 가속 요소 값 사이의 부드러운 전환을 만들기 위해 시그모이드 함수를 사용합니다:

```
sigmoid_x = ((1 / (1 + MathExp(-k * (2*normalized_x - 1)))) - (1 / (1 + MathExp(k)))) / t
```

이는 S자 모양의 곡선을 만들어 손절매 수준의 급격한 변화를 피하고, 더 자연스럽고 효과적인 거래 관리를 제공합니다.

### 쌍곡선 탄젠트 스무딩

이익 실현 계산은 사용자 정의 쌍곡선 탄젠트 구현을 사용합니다:

```
CustomTanh(x) = (exp2x - 1.0) / (exp2x + 1.0)
```

이는 이익 실현 수준의 부드러운 전환을 만들어 더 자연스럽고 효과적으로 만듭니다.

### 트레일링 스톱 구현

이 지표는 다음과 같은 지능형 트레일링 스톱 메커니즘을 구현합니다:

1. 상한 또는 하한이 돌파되었는지 추적
2. 경계가 돌파되면 손절매가 유리한 방향으로만 이동하도록 허용
3. 손절매 거리를 결정하기 위해 적응형 가속 요소(AFX) 사용

## 실용적 사용법

### 추세 추종 전략

1. 지표가 롱 또는 숏 신호(화살표)를 생성할 때까지 기다림
2. 신호 방향으로 포지션 진입
3. 지표의 손절매 수준(주황색 선)에 손절매 설정
4. 지표의 이익 실현 수준(마젠타색 선)에 이익 실현 설정
5. 지표가 손절매 및 이익 실현 수준을 업데이트하는 동안 포지션 모니터링
6. 지표가 반전 신호를 생성하면 퇴출

### 다른 도구와의 통합

이 지표는 다른 기술적 분석 도구와 함께 사용할 수 있습니다:

- **지지/저항 수준**: 주요 지지 및 저항 수준으로 신호 확인
- **볼륨 지표**: 볼륨 확인으로 신호 검증
- **오실레이터**: RSI 또는 스토캐스틱과 같은 오실레이터를 사용하여 과매수/과매도 조건 확인

## 결론

Wilders Volatility Trend Following Optimised 지표는 고급 적응 기능을 갖춘 포괄적인 추세 추종 시스템을 제공합니다. 시장 상황에 동적으로 적응하고 명확한 시각적 피드백을 제공함으로써, 최적화된 리스크 매개변수로 추세 기반 거래를 식별하고 관리하는 데 트레이더를 돕습니다.

이 지표의 적응형 가속 요소, 부드러운 이익 실현 수준 및 지능형 트레일링 스톱을 계산하기 위한 정교한 알고리즘은 거래 접근 방식을 최적화하려는 추세 추종자에게 강력한 도구가 됩니다.

---

*Copyright 2025, TradeFlags*


추천 제품
Noize Absorption Index
Ekaterina Saltykova
Noize Absorption Index - is the manual trading system that measures the difference of pressure between bears forces and bulls forces. Green line - is a noize free index that showing curent situation. Zero value of index shows totally choppy/flat market.Values above zero level shows how powerfull bullish wave is and values below zero measures bearish forces.Up arrow appears on bearish market when it's ready to reverse, dn arrow appears on weak bullish market, as a result of reverse expectation.
Liquidity Oscillator
Paolo Scopazzo
3 (2)
A powerful oscillator that provide Buy and Sell signals by calculating the investor liquidity. The more liquidity the more buy possibilities. The less liquidity the more sell possibilities. Please download the demo and run a backtest! HOW IT WORKS: The oscillator will put buy and sell arrow on the chart in runtime only . Top value is 95 to 100 -> Investors are ready to buy and you should follow. Bottom value is 5 to 0 -> Investors are ready to sell and you should follow. Alert + sound will appe
Antique Trend
Nadiya Mirosh
The Antique Trend Indicator is a revolutionary trend trading and filtering solution with all the important features of a trend tool built into one tool! The Antique Trend indicator is good for any trader, suitable for any trader both for Forex and binary options. There is no need to configure anything, everything has been perfected by time and experience, it works great during flats and trends. The Antique Trend indicator is a tool for technical analysis of financial markets, reflecting curren
The new update makes this indicator a complete tool for studying, analyzing and operating probabilistic patterns. It includes: On-chart Multi-asset percentage monitor. Configurable martingales. Twenty-one pre-configured patterns, including Mhi patterns and C3. An advanced pattern editor to store up to 5 custom patterns. Backtest mode to test results with loss reports. Trend filter. Hit operational filter. Martingale Cycles option. Various types of strategies and alerts. Confluence between patter
Limitless MT5
Dmitriy Kashevich
Limitless MT5 is a universal indicator suitable for every beginner and experienced trader. works on all currency pairs, cryptocurrencies, raw stocks Limitless MT5 - already configured and does not require additional configuration And now the main thing Why Limitless MT5? 1 complete lack of redrawing 2 two years of testing by the best specialists in trading 3 the accuracy of correct signals exceeds 80% 4 performed well in trading during news releases Trading rules 1 buy signal - the ap
Ichimoku Aiko MTF
Michael Jonah Randriamampionontsoa
Ichimoku Aiko MTF is a collection of technical indicators that show support and resistance levels, as well as momentum and trend direction. It is a multi-timeframe indicator so you don't need to change the chart timeframe when you want to see the ichimoku clouds on a higher timeframe.  eg. The chart timeframe is M15 and you want to see on the M15 timeframe chart the H1 ichimoku indicators (the ichimoku in Metatrader can't do that) that's why you need to use Ichimoku Aiko MTF.
Master Calendar Osw
William Oswaldo Mayorga Urduy
OSW 마스터 캘린더 이 지표는 처음에는 개인적인 용도로 만들어졌지만 조금씩 개선해 나가고 있으며 일상적인 거래에 도움이 되는 기능을 구현하고 있으며 유용하다면 계속해서 기능을 구현할 예정입니다. 달력 세부정보. > 날짜, 국가, 통화, 뉴스 분야, 뉴스 이름, 이전, 예측 및 현재 데이터와 같은 데이터가 포함된 현재 날짜에 가까운 뉴스의 모바일 및 상세 캘린더입니다. >캘린더는 5분마다 자동으로 업데이트됩니다. > 메뉴에서 색상, 거래 세션 및 시작 시간을 구성하여 중요도에 따라 보고 싶은 뉴스를 선택할 수 있습니다. 색상 변경 >캘린더에는 색상을 변경하는 내부 기능이 있습니다. 현재 값이 이전 값보다 크면 파란색으로 변하고, 그렇지 않으면 빨간색으로 변하고, 중립은 회색으로 변합니다. >뉴스의 색상과 중요도에 따라 뉴스 설명 텍스트의 색상을 메뉴에서 구성할 수 있습니다. > 뉴스로 인해 통화가 강화되면 통화 이름과 국가가 파란색으로 설정되고, 그렇지 않으면 빨간색
SMC Venom Model BPR 지표는 Smart Money(SMC) 개념 내에서 일하는 트레이더를 위한 전문 도구입니다. 가격 차트에서 두 가지 주요 패턴을 자동으로 식별합니다. FVG (공정 가치 갭)는 3개의 캔들의 조합으로, 첫 번째와 세 번째 캔들 사이에 갭이 있습니다. 이는 볼륨 지원이 없는 레벨 사이에 구역을 형성하여 종종 가격 수정으로 이어집니다. BPR (균형 가격 범위)은 두 개의 FVG 패턴의 조합으로, "브리지"를 형성합니다. 이는 가격이 낮은 볼륨 활동으로 움직일 때 브레이크아웃과 레벨로의 복귀 구역으로, 캔들 사이에 갭을 생성합니다. 이러한 패턴은 거래자가 차트에서 거래량과 가격 역학을 분석하여 주요 지지/저항 수준, 돌파 구역 및 진입 지점을 식별하는 데 도움이 되며, 여기서 대형 시장 참여자와 일반 참여자 간의 상호 작용이 발생합니다. 이 지표는 사각형과 화살표 형태로 패턴을 시각화하며 유연한 경고 설정도 지원합니다. 주요 특징: 패턴 표시 모드
MT5 Arrow Indicator   is a momentum-based technical indicator for   MetaTrader 5 , designed to provide   clear buy and sell arrow signals   based on market momentum. The indicator generates   non-repainting signals   and includes a   built-in alert system   to notify traders when new signals appear. Key Features  Non-Repainting Arrow Signals Signals are confirmed after candle close Historical arrows do not change Suitable for backtesting and live trading  Buy & Sell Logic Buy Arrow   appears whe
This trading indicator is non-repainting, non-redrawing, and non-lagging, making it an ideal choice for both manual and automated trading. It is a Price Action–based system that leverages price strength and momentum to give traders a real edge in the market. With advanced filtering techniques to eliminate noise and false signals, it enhances trading accuracy and potential. By combining multiple layers of sophisticated algorithms, the indicator scans the chart in real-time and translates comple
Prizmal Logic
Vladimir Lekhovitser
5 (1)
실시간 거래 신호 거래 활동의 공개 실시간 모니터링: https://www.mql5.com/ko/signals/2353471 공식 정보 판매자 프로필 공식 채널 사용자 매뉴얼 설정 안내 및 사용 지침: 사용자 매뉴얼 열기 이 전문가 어드바이저는 규칙 기반 거래 전략에 기반하여 설계되었습니다. 이 전략은 시장에 지속적으로 노출되기보다는 특정 시장 조건을 식별하는 데 초점을 둡니다. 시스템은 가격 움직임, 변동성 특성 및 시간 요소를 분석합니다. 이 요소들은 현재 시장 환경이 거래 참여에 적합한지 판단하는 데 사용됩니다. 여러 사전 정의된 기준이 동시에 충족될 때만 거래가 실행됩니다. 조건이 충족되지 않으면 전문가 어드바이저는 비활성 상태를 유지합니다. 그 결과 거래 활동은 일정하지 않습니다. 거래가 전혀 발생하지 않는 기간이 있을 수 있습니다. 이는 포지션이 전혀 없는 하루 전체를 포함할 수 있습니다. 반대로 적절한 시장 국면에서는 비교적 짧은 시간에 여러 거
Long&Short Cointegration Analyzer An advanced tool for traders looking to profit from cointegration. Analyzes any asset pair for Long&Short strategies. What does the Long&Short Cointegration Analyzer do? Identifies cointegrated pairs that revert to the mean, ideal for profitable trades. Provides a detailed panel with statistical data for confident decisions. Works with any currency pair, on any timeframe. Find buying and selling opportunities based on cointegration. Minimize risks with a relia
Your Trend Friend
Luigi Nunes Labigalini
5 (1)
The trend is your friend! Look at the color of the indicator and trade on that direction. It does not  repaint. After each candle is closed, that's the color of the trend. You can focus on shorter faster trends or major trends, just test what's most suitable for the symbol and timeframe you trade. Simply change the "Length" parameter and the indicator will automatically adapt. You can also change the color, thickness and style of the lines. Download and give it a try! There are big movements w
Maximum Trend Arrows OT MT5
Mulweli Valdaz Makulana
STRICTLY FOR BOOM INDEX ONLY!!!!! Here I bring the Maximum Trend Arrows OT1.0 MT5 indicator. This indicator is made up of a combination of different trend indicators for entries and exits, for entries an orange arrow will paint on the chart below the current market and a red flag for closing of trades and it produces buy arrows only. When the orange arrow appears, it will appear along with it's sound to notify you. The 1H timeframe is recommended, don't use it anywhere else than on the 1H timefr
Owl Smart Levels MT5
Sergey Ermolov
4.03 (32)
MT4 버전  |  FAQ Owl Smart Levels Indicator 는 Bill Williams 의 고급 프랙탈, 시장의 올바른 파동 구조를 구축하는 Valable ZigZag, 정확한 진입 수준을 표시하는 피보나치 수준과 같은 인기 있는 시장 분석 도구를 포함하는 하나의 지표 내에서 완전한 거래 시스템입니다. 시장과 이익을 취하는 장소로. 전략에 대한 자세한 설명 표시기 작업에 대한 지침 고문-거래 올빼미 도우미의 조수 개인 사용자 채팅 ->구입 후 나에게 쓰기,나는 개인 채팅에 당신을 추가하고 거기에 모든 보너스를 다운로드 할 수 있습니다 힘은 단순함에 있습니다! Owl Smart Levels 거래 시스템은 사용하기 매우 쉽기 때문에 전문가와 이제 막 시장을 연구하고 스스로 거래 전략을 선택하기 시작한 사람들 모두에게 적합합니다. 전략 및 지표에는 눈에 보이지 않는 비밀 공식 및 계산 방법이 없으며 모든 전략 지표는 공개되어 있습니다. Owl Smart Levels를 사
ROMAN5 Time Breakout Indicator automatically draws the boxes for daily support and resistance breakouts. It helps the user identifying whether to buy or sell. It comes with an alert that will sound whenever a new signal appears. It also features an email facility. Your email address and SMTP Server settings should be specified in the settings window of the "Mailbox" tab in your MetaTrader 5. Blue arrow up = Buy. Red arrow down = Sell. You can use one of my Trailing Stop products that automatical
FREE
Candle Pattern Finder MT5
Pavel Zamoshnikov
4.2 (5)
This indicator searches for candlestick patterns. Its operation principle is based on Candlestick Charting Explained: Timeless Techniques for Trading Stocks and Futures by Gregory L. Morris. If a pattern is detected, the indicator displays a message at a bar closure. If you trade using the MetaTrader 4 terminal, then you can download the full analogue of the " Candle Pattern Finder for MT4 " indicator It recognizes the following patterns: Bullish/Bearish (possible settings in brackets) : Hammer
Gecko EA MT5
Profalgo Limited
5 (1)
NEW PROMO: Only a few copies copies available at 349$ Next price: 449$ Make sure to check out our " Ultimate EA combo package " in our   promo blog ! Gecko runs a simple, yet very effective, proven strategy.  It looks for important recent support and resistance levels and will trade the breakouts.  This is a "real" trading system, which means it will use a SL to protect the account.  It also means it will not use any dangerous techniques like martingale, grid or averaging down. The EA shows its
Bollinger Trend Lines – MT4 & MT5 Bollinger Trend Lines is a professional volatility-based trend indicator designed to clearly identify trend direction and dynamic stop levels using Bollinger Bands. Fuses on one core principle: follow the trend, ignore noise, and let volatility define the stop. How it works The indicator builds trailing trend lines using Bollinger Bands: In an uptrend , the lower band trails price and can only rise In a downtrend , the upper band trails price and can only
Visual Range Directional Force Indicator
AL MOOSAWI ABDULLAH JAFFER BAQER
Range Directional Force Indicator – Designed for You to Optimize! The Range Directional Force Indicator is a cutting-edge tool designed to empower traders by visualizing market dynamics and directional strength. Built to offer insights into market trends and reversals, this indicator is an invaluable asset for traders seeking precision in their strategies. However, it is important to note that this indicator is not optimized, leaving room for you to tailor it to your unique trading preferences.
숫자 시퀀스 중 하나를 "산불 시퀀스"라고 합니다. 가장 아름다운 새로운 시퀀스 중 하나로 인식되었습니다. 주요 특징은 이 시퀀스가 ​​가장 짧은 경우에도 선형 추세를 피한다는 것입니다. 이 지표의 기초를 형성한 것은 이 속성입니다. 금융 시계열을 분석할 때 이 지표는 가능한 모든 추세 옵션을 거부하려고 합니다. 그리고 그가 실패하는 경우에만 그는 추세의 존재를 인식하고 적절한 신호를 제공합니다. 이 접근 방식을 통해 새로운 트렌드가 시작되는 순간을 정확하게 결정할 수 있습니다. 그러나 거짓 긍정도 가능합니다. 숫자를 줄이기 위해 이 표시기에 추가 필터가 추가되었습니다. 새 막대가 열리면 신호가 생성됩니다. 어떤 경우에도 다시 그리기가 발생하지 않습니다. 표시 매개변수: Applied Price   - 적용된 가격 상수. Period Main   - 표시기의 기본 기간, 유효한 값은 5 - 60 이내입니다. Period Additional   - 추가 기간, 이 매개변수의 유효한
Riko Trend mt5
Nadiya Mirosh
The Riko Trend indicator is a revolutionary trend trading and filtering solution with all the important features of a trend tool built into one tool! The Riko Trend indicator is good for any trader, suitable for any trader for both forex and binary options. You don’t need to configure anything, everything is perfected by time and experience, it works great during a flat and in a trend. The Riko Trend indicator is a technical analysis tool for financial markets that reflects the current price f
MTF Candles Overlay MT5
Prafull Manohar Nikam
MTF Candles Overlay - Professional Multi-Timeframe Analysis Tool (Now with Yearly Y1 timeframe!) The MTF  Candles Overlay is a powerful and visually intuitive indicator that allows traders to view candles from higher timeframes directly overlaid on their current chart. This eliminates the need to constantly switch between multiple timeframe charts, enabling faster analysis and better trading decisions. Key Features Complete Timeframe Coverage All Standard Timeframes : M1, M2, M3, M4, M5, M6, M1
PipFinite Breakout EDGE MT5
Karlo Wilson Vendiola
4.81 (93)
The Missing Edge You Need To Catch Breakouts Like A Pro. Follow a step-by-step system that detects the most powerful breakouts! Discover market patterns that generate massive rewards based on a proven and tested strategy. Unlock Your Serious Edge Important information here www.mql5.com/en/blogs/post/723208 The Reliable Expert Advisor Version Automate Breakout EDGE signals using "EA Breakout EDGE" Click Here Have access to the game changing strategy that will take your trading to the next l
Probability Advanced Indicator
Dioney De Jesus Batista Alves
ProbabilityAdvancedIndicator 는 스캘핑(scalping) 및 데이 트레이딩(day trading)을 위해 설계된 정교한 트렌드 확률 분석 도구입니다. 여러 기술 지표와 다중 시간대 분석을 결합하여 매수/매매 확률을 시각적으로 명확하게 표시합니다. ProbabilityAdvancedIndicator 는 다음과 같은 트레이더를 위한 종합 솔루션입니다: 확률 기반 의사 결정 통합 기술 분석 다양한 트레이딩 스타일 적용 가능 직관적이고 사용자 정의 가능한 인터페이스 전문가 팁:   특히 지지/저항 구역에서 신호 확인률을 높이려면 가격 행동 분석(price action)과 함께 사용하는 것이 효과적입니다. (참고: '스캘핑'과 '데이 트레이딩'은 한국어로도 동일한 용어로 통용됩니다)
The Super Arrow Indicator provides non-repainting buy and sell signals with exceptional accuracy. Key Features No repainting – confirmed signals remain fixed Clear visual arrows: green for buy, red for sell Real-time alerts via pop-up, sound, and optional email Clean chart view with no unnecessary clutter Works on all markets: Forex, gold, oil, indices, crypto Adjustable Parameters TimeFrame Default:   "current time frame" Function:   Sets the time frame for indicator calculation Options:   Can
개요 이 지표는 클래식 돈치안 채널(Donchian Channel) 의 향상된 버전으로, 실전 트레이딩을 위한 다양한 기능이 추가되었습니다. 표준 세 개의 선(상단, 하단, 중앙선) 외에도 브레이크아웃 을 감지하여 차트에 화살표로 시각적으로 표시하며, 차트를 깔끔하게 보기 위해 현재 추세 방향의 반대 라인만 표시 합니다. 지표 기능: 시각적 신호 : 브레이크아웃 시 컬러 화살표 표시 자동 알림 : 팝업, 푸시 알림, 이메일 RSI 필터 : 시장의 상대 강도를 기반으로 신호 검증 사용자 맞춤 설정 : 색상, 선 두께, 화살표 코드, RSI 임계값 등 동작 원리 돈치안 채널은 다음을 계산합니다: 상단선 : 최근 N개의 종가 완료 캔들에서 가장 높은 고가 하단선 : 최근 N개의 종가 완료 캔들에서 가장 낮은 저가 중앙선 : 고가와 저가의 평균값 상방 브레이크아웃 은 종가가 상단선을 돌파할 때 발생하며, 하방 브레이크아웃 은 종가가 하단선 아래로 내려갈 때 발생합니다. 이 지표는: 세 개의
FREE
WanaScalper
Isaac Wanasolo
1 (1)
A scalping indicator based on mathematical patterns, which on average gives signals with relatively small SL, and also occasionally helps to catch big moves in the markets (more information in the video) This indicator has three main types of notifications: The first type warns of a possible/upcoming signal on the next bar The second type indicates the presence of a ready signal to enter the market/open a position The third type is for SL and TP levels - you will be notified every time price re
Gann 9 plus
Yin Zhong Peng
Gann 9+ Indicator Introduction The "Gann Matrix Chart" is the most simple and clear technical analysis in Gann theory, which is the calculation tool that Gann has always been committed to using. It is the essence of Gann's whole life. The Gann 9+ indicator uses the matrix chart to find the future high or low points of stocks or futures. Indicator Input: The base and step size can be set as 1 by default; When the multiple is -1, the multiple will be automatically obtained, or it can be filled in
##   ONLY GOLD ##   Тiльки Золото ## **Mercaria Professional Trading Zones - Complete Guide** ## **Mercaria Professional Trading Zones - Повний посібник** ### **How Mercaria Zones Work / Як працюють зони Mercaria** **English:** Mercaria Zones is an advanced trading indicator that identifies high-probability support and resistance areas using ZigZag extremes combined with mathematical zone calculations. The indicator works on multiple timeframes simultaneously, providing a comprehensive view
이 제품의 구매자들이 또한 구매함
ARIPoint
Temirlan Kdyrkhan
1 (1)
ARIPoint is a powerful trading companion designed to generate high-probability entry signals with dynamic TP/SL/DP levels based on volatility. Built-in performance tracking shows win/loss stats, PP1/PP2 hits, and success rates all updated live. Key Features: Buy/Sell signals with adaptive volatility bands Real-time TP/SL/DP levels based on ATR Built-in MA Filter with optional ATR/StdDev volatility Performance stats panel (Success, Profit/Loss, PP1/PP2) Alerts via popup, sound, push, or email Cu
Divergence Bomber
Ihor Otkydach
4.9 (81)
이 지표를 구매하신 분께는 다음과 같은 혜택이 무료로 제공됩니다: 각 거래를 자동으로 관리하고, 손절/익절 수준을 설정하며, 전략 규칙에 따라 거래를 종료하는 전용 도우미 툴 "Bomber Utility" 다양한 자산에 맞게 지표를 설정할 수 있는 셋업 파일(Set Files) "최소 위험", "균형 잡힌 위험", "관망 전략" 모드로 설정 가능한 Bomber Utility의 셋업 파일 이 전략을 빠르게 설치, 설정, 시작할 수 있도록 돕는 단계별 영상 매뉴얼 주의: 위의 모든 보너스를 받기 위해서는 MQL5 개인 메시지 시스템을 통해 판매자에게 연락해 주세요. 독창적인 커스텀 지표인 “Divergence Bomber(다이버전스 봄버)”를 소개합니다. 이 지표는 MACD 다이버전스(괴리) 전략을 기반으로 한 올인원(All-in-One) 거래 시스템입니다. 이 기술 지표의 주요 목적은 가격과 MACD 지표 간의 다이버전스를 감지하고, **향후 가격이 어느 방향으로 움직일지를 알려주는
Azimuth Pro
Ottaviano De Cicco
5 (1)
LAUNCH PROMO Azimuth Pro price is initially set at 299$ for the first 100 buyers. Final price will be 499$ . THE DIFFERENCE BETWEEN RETAIL AND INSTITUTIONAL ENTRIES ISN'T THE INDICATOR — IT'S THE LOCATION. Most traders enter at arbitrary price levels, chasing momentum or reacting to lagging signals. Institutions wait for price to reach structured levels where supply and demand actually shift. Azimuth Pro maps these levels automatically: swing-anchored VWAP, multi-timeframe structure lines, an
Super Signal – Skyblade Edition 전문가용 노리페인트 / 노래그 트렌드 신호 시스템, 뛰어난 승률 제공 | MT4 / MT5용 1분, 5분, 15분과 같은 낮은 타임프레임에서 가장 좋은 성능을 보입니다. 핵심 기능: Super Signal – Skyblade Edition은 추세 매매를 위해 설계된 스마트 신호 시스템입니다. 이 시스템은 다중 필터 로직을 활용하여, 명확한 방향성과 실질적인 모멘텀이 수반된 고품질 추세만을 감지합니다. 이 시스템은   고점 또는 저점을 예측하지 않으며 , 다음 세 가지 조건이 모두 충족될 때만 신호를 발생시킵니다: 명확한 추세 방향 강화되는 모멘텀 건전한 변동성 구조 또한, 시장 세션 기반의 유동성 분석을 통해 신호의 신뢰성과 타이밍을 더욱 향상시킵니다. 신호 특성: 모든 화살표 신호는 100% 리페인트 없음 / 지연 없음 신호가 한 번 발생하면 고정되며, 깜빡이거나 사라지지 않음 차트 상의 시각적 화살표, 정보 패널, 팝업
우선적으로, 이 거래 도구는 전문적인 거래에 이상적인 비-다시 그리기 및 지연되지 않는 지표입니다.  온라인 강좌, 사용자 매뉴얼 및 데모. 스마트 가격 액션 컨셉트 인디케이터는 신규 및 경험 많은 트레이더 모두에게 매우 강력한 도구입니다. Inner Circle Trader Analysis 및 Smart Money Concepts Trading Strategies와 같은 고급 거래 아이디어를 결합하여 20가지 이상의 유용한 지표를 하나로 결합합니다. 이 인디케이터는 스마트 머니 컨셉트에 중점을 두어 대형 기관의 거래 방식을 제공하고 이동을 예측하는 데 도움을 줍니다.  특히 유동성 분석에 뛰어나 기관이 어떻게 거래하는지 이해하는 데 도움을 줍니다. 시장 트렌드를 예측하고 가격 변동을 신중하게 분석하는 데 탁월합니다. 귀하의 거래를 기관 전략에 맞추어 시장의 동향에 대해 더 정확한 예측을 할 수 있습니다. 이 인디케이터는 시장 구조를 분석하고 중요한 주문 블록을 식별하고 다양
Trend Screener Pro MT5
STE S.S.COMPANY
4.84 (100)
트렌드 표시기, 트렌드 트레이딩 및 필터링을 위한 획기적인 고유 솔루션, 하나의 도구 안에 내장된 모든 중요한 트렌드 기능! Forex, 상품, 암호 화폐, 지수 및 주식과 같은 모든 기호/도구에 사용할 수 있는 100% 다시 칠하지 않는 다중 시간 프레임 및 다중 통화 표시기입니다. Trend Screener는 차트에 점이 있는 화살표 추세 신호를 제공하는 효율적인 지표 추세 추종 지표입니다. 추세 분석기 표시기에서 사용할 수 있는 기능: 1. 트렌드 스캐너. 2. 최대 이익 분석이 있는 추세선. 3. 추세 통화 강도 측정기. 4. 경고가 있는 추세 반전 점. 5. 경고가 있는 강력한 추세 점. 6. 추세 화살표 Trend Screener Indicator가 있는 일일 분석 예, 일일 신호 성능...등은 여기에서 찾을 수 있습니다. 여기를 클릭하십시오. LIMITED TIME OFFER : Trend Screener Indicator는 50$ 및 평생 동안만 사용할 수 있습니다.
ARICoins
Temirlan Kdyrkhan
ARICoin is a powerful trading companion designed to generate high-probability entry signals with dynamic TP/SL/DP levels based on volatility. Built-in performance tracking shows win/loss stats, PP1/PP2 hits, and success rates all updated live. Key Features: Buy/Sell signals with adaptive volatility bands Real-time TP/SL/DP levels based on ATR Built-in MA Filter with optional ATR/StdDev volatility Performance stats panel (Success, Profit/Loss, PP1/PP2) Alerts via popup, sound, push, or email Cust
ARIScalping
Temirlan Kdyrkhan
ARIScalp is a powerful trading companion designed to generate high-probability entry signals with dynamic TP/SL/DP levels based on volatility. Built-in performance tracking shows win/loss stats, PP1/PP2 hits, and success rates all updated live. Key Features: Buy/Sell signals with adaptive volatility bands Real-time TP/SL/DP levels based on ATR Built-in MA Filter with optional ATR/StdDev volatility Performance stats panel (Success, Profit/Loss, PP1/PP2) Alerts via popup, sound, push, or email Cus
Grabber System MT5
Ihor Otkydach
4.82 (22)
탁월한 기술적 지표인 Grabber를 소개합니다. 이 도구는 즉시 사용 가능한 “올인원(All-Inclusive)” 트레이딩 전략으로 작동합니다. 하나의 코드 안에 강력한 시장 기술 분석 도구, 매매 신호(화살표), 알림 기능, 푸시 알림이 통합되어 있습니다. 이 인디케이터를 구매하신 모든 분들께는 다음의 항목이 무료로 제공됩니다: Grabber 유틸리티: 오픈 포지션을 자동으로 관리하는 도구 단계별 영상 매뉴얼: 설치, 설정, 그리고 실제 거래 방법을 안내 맞춤형 세트 파일: 인디케이터를 빠르게 자동 설정하여 최고의 성과를 낼 수 있도록 도와줍니다 다른 전략은 이제 잊어버리세요! Grabber만이 여러분을 새로운 트레이딩의 정점으로 이끌어 줄 수 있습니다. Grabber 전략의 주요 특징: 거래 시간 프레임: M5부터 H4까지 거래 가능한 자산: 어떤 자산이든 사용 가능하지만, 제가 직접 테스트한 종목들을 추천드립니다 (GBPUSD, GBPCAD, GBPCHF, AUDCAD, AU
AriX
Temirlan Kdyrkhan
1 (4)
AriX Indicator for MT5 A powerful trend-following and signal-evaluation tool AriX is a custom MT5 indicator that combines Moving Averages and ATR-based risk/reward logic to generate clear buy/sell signals. It visualizes dynamic SL/TP levels, evaluates past trade outcomes, and displays win/loss statistics in a clean on-chart panel. Key features include: Buy/Sell signals based on MA crossovers ATR-based SL/TP1/TP2/TP3 levels with visual lines and labels Signal outcome tracking with real-time stat
Shock Pullback
Suleiman Alhawamdah
5 (1)
간단히 말해, 현재 캔들 옆에 흰색 숫자(‘핍’이라고 불림)의 움직임이 나타나기 시작하면 거래를 시작할 수 있습니다. 흰색 ‘핍’은 현재 매수 또는 매도 거래가 활성화되어 있으며 흰색으로 표시된 것처럼 올바른 방향으로 움직이고 있음을 나타냅니다. 흰색 핍의 움직임이 멈추고 정적인 녹색으로 바뀌면 이는 현재 모멘텀의 종료를 의미합니다. 숫자의 녹색은 매수 또는 매도 거래를 통해 얻은 총 수익을 ‘핍’ 단위로 나타냅니다. 또한, 인디케이터 내의 다른 고급 전문 분석 도구를 활용하여 거래를 시작할 수 있습니다. 인디케이터에 표시되는 신호와 색상을 관찰함으로써 높은 정확도로 수많은 스캘핑 기회를 포착할 수 있습니다. 테스트 중이거나 실시간 차트에서 인디케이터를 충분히 이해하는 것이 중요합니다. 대부분의 외환 시장에 적합: 금 거래 및 인기 있는 지수 시장(Dow Jones, S&P 500, Nasdaq, DAX 등), 그리고 EUR/USD, GBP/USD, USD/JPY 등 강력한 통화쌍
Gold Sniper Scalper Pro
Ich Khiem Nguyen
3.5 (8)
Gold Sniper Scalper Pro는 MetaTrader 5용 전문 지표로, 트레이더가 진입 지점을 식별하고 리스크를 효과적으로 관리할 수 있도록 지원하기 위해 설계되었습니다. 이 지표는 시그널 감지 시스템, 자동 Entry/SL/TP 관리, 거래량 분석 및 실시간 성과 통계를 포함하는 포괄적인 분석 도구 세트를 제공합니다. 시스템 이해를 위한 사용자 가이드   |   기타 언어 사용자 가이드 주요 기능 시그널 감지 시스템 지표는 Price Action 분석 및 시장 구조를 기반으로 잠재적 진입 지점을 자동으로 감지합니다. 거래 기회 감지 시: - BUY 화살표(녹색) 또는 SELL 화살표(빨간색)가 차트에 표시됩니다 - 캔들이 색상으로 표시되어 시그널 영역을 식별합니다 - Entry/SL/TP 레벨이 자동으로 계산됩니다 시그널은 가격이 Entry 레벨에 도달할 때만 활성화되어, 시장에서 확인되지 않은 시그널을 필터링합니다. 지능형 Entry/SL/TP 관리 - Ent
PZ Swing Trading MT5
PZ TRADING SLU
5 (5)
Protect against whipsaws: revolutionize your swing trading approach Swing Trading is the first indicator designed to detect swings in the direction of the trend and possible reversal swings. It uses the baseline swing trading approach, widely described in trading literature. The indicator studies several price and time vectors to track the aggregate trend direction and detects situations in which the market is oversold or overbought and ready to correct. [ Installation Guide | Update Guide | Tro
무료 AUX 인디케이터와 EA 지원을 받으세요 직접 다운로드 — 여기를 클릭 [ D.I.C.E ] The DICE Indicator  Divergence in Chaos Environment는 엘리엇 파동 이론과 트레이딩 카오스 기법을 함께 사용하는 트레이더를 위해 설계된 MT5 전문 도구입니다. 가격 움직임의 숨겨진 및 일반 다이버전스를 감지하며, 빌 윌리엄스가 설명한 혼돈 시장 환경과 동기화됩니다. 주요 특징 엘리엇 파동 정렬 다이버전스: 파동 구조에 조화된 강세 및 약세 다이버전스를 탐지하여 파동 카운팅 정확도를 높입니다. 카오스 기법 통합: AO(오썸 오실레이터) 및 시장 구조 원칙과 일치하도록 설계되었습니다. 다중 타임프레임 스캐닝: 다양한 시간 프레임에서 다이버전스를 분석하여 모멘텀 변화와 추세 소진을 확인합니다. 시각적 알림 및 객체: 명확한 화살표, 선, 표시로 빠른 인식 가능. 적응형 시장 판독: 혼돈 시장 조건에 자동으로 조정되어 노이즈를 필터링하고 유효한 셋업만
Trend Forecaster
Alexey Minkov
5 (7)
The Trend Forecaster indicator utilizes a unique proprietary algorithm to determine entry points for a breakout trading strategy. The indicator identifies price clusters, analyzes price movement near levels, and provides a signal when the price breaks through a level. The Trend Forecaster indicator is suitable for all financial assets, including currencies (Forex), metals, stocks, indices, and cryptocurrencies. You can also adjust the indicator to work on any time frames, although it is recommen
Introduction to X3 Chart Pattern Scanner X3 Cherart Pattern Scanner is the non-repainting and non-lagging indicator detecting X3 chart patterns including Harmonic pattern, Elliott Wave pattern, X3 patterns, and Japanese Candlestick patterns. Historical patterns match with signal patterns. Hence, you can readily develop the solid trading strategy in your chart. More importantly, this superb pattern scanner can detect the optimal pattern of its kind. In addition, you can switch on and off individu
Berma Bands
Muhammad Elbermawi
5 (7)
Berma Bands(BBs) 지표는 시장 동향을 파악하고 이를 활용하려는 트레이더에게 귀중한 도구입니다. 가격과 BBs 간의 관계를 분석함으로써 트레이더는 시장이 추세 단계인지 범위 단계인지를 분별할 수 있습니다. 자세한 내용을 알아보려면 [ Berma Home Blog ]를 방문하세요. 버마 밴드는 세 개의 뚜렷한 선으로 구성되어 있습니다. 어퍼 버마 밴드, 미들 버마 밴드, 로어 버마 밴드입니다. 이 선들은 가격 주위에 그려져 전체 추세에 대한 가격 움직임을 시각적으로 표현합니다. 이 밴드들 사이의 거리는 변동성과 잠재적인 추세 반전에 대한 통찰력을 제공할 수 있습니다. 버마 밴드 라인이 각각에서 분리될 때, 그것은 종종 시장이 횡보 또는 범위 이동 기간에 접어들고 있음을 시사합니다. 이는 명확한 방향 편향이 없음을 나타냅니다. 트레이더는 이러한 기간 동안 추세를 파악하기 어려울 수 있으며 더 명확한 추세가 나타날 때까지 기다릴 수 있습니다. 버마 밴드 라인이 단일 라인으로
WVAP Scalping
Domantas Juodenis
VWAP Scalping Pro – Advanced VWAP & Market Profile System Professional-Grade VWAP + Market Profile Technology for Precision Trading VWAP Scalping Pro is an advanced analytical tool that integrates Volume-Weighted Average Price (VWAP) analysis with professional Market Profile visualization. It provides traders with institutional-style insights into price structure, volume distribution, and session dynamics — ideal for scalping, intraday, and swing trading strategies. Key Features Triple VWAP St
Advanced Supply Demand MT5
Bernhard Schweigert
4.5 (14)
현재 33% 할인! 초보자나 전문 트레이더를 위한 최고의 솔루션! 이 보조지표는 우리가 다수의 독창적 기능과 새로운 공식을 통합한 독특하고 고품질이며 저렴한 거래 도구입니다. 이 업데이트를 통해 이중 시간대를 표시할 수 있습니다. 더 높은 TF를 표시할 수 있을 뿐만 아니라 차트 TF와 더 높은 TF 모두를 표시할 수 있습니다: 중첩 영역 표시. 모든 Supply Demand 트레이더들이 좋아할 것입니다. :) 중요한 정보 공개 Advanced Supply Demand의 잠재력을 극대화하려면 다음을 방문하십시오. https://www.mql5.com/ko/blogs/post/720245   진입 또는 목표의 명확한 트리거 포인트를 정확히 찾아냄으로 해서 거래가 어떻게 개선될지 상상해 보십시오. 새로운 알고리즘을 기반으로 매수자와 매도자 간의 잠재적인 불균형을 훨씬 더 쉽게 분간할 수 있습니다. 왜냐하면 가장 강한 공급영역과 가장 강한 수요 영역과 과거에 어떻게 진행 되었는지를(이전
MetaForecast M5
Vahidreza Heidar Gholami
5 (3)
MetaForecast는 가격 데이터의 조화를 기반으로 모든 시장의 미래를 예측하고 시각화합니다. 시장이 항상 예측 가능한 것은 아니지만 가격에 패턴이 있다면 MetaForecast는 가능한 정확하게 미래를 예측할 수 있습니다. 다른 유사한 제품과 비교했을 때, MetaForecast는 시장 동향을 분석하여 더 정확한 결과를 생성할 수 있습니다. 입력 매개변수 Past size (과거 크기) MetaForecast가 미래 예측을 생성하기 위한 모델을 만드는 데 사용하는 막대의 수를 지정합니다. 모델은 선택한 막대 위에 그려진 노란색 선으로 표시됩니다. Future size (미래 크기) 예측해야 할 미래 막대의 수를 지정합니다. 예측된 미래는 핑크색 선으로 표시되며 그 위에 파란색 회귀선이 그려집니다. Degree (차수) 이 입력은 MetaForecast가 시장에서 수행할 분석 수준을 결정합니다. Degree 설명  0 차수 0의 경우, "Past size" 입력에 모든 봉우리와
Trade smarter, not harder: Empower your trading with Harmonacci Patterns This is arguably the most complete harmonic price formation auto-recognition indicator you can find for the MetaTrader Platform. It detects 19 different patterns, takes fibonacci projections as seriously as you do, displays the Potential Reversal Zone (PRZ) and finds suitable stop-loss and take-profit levels. [ Installation Guide | Update Guide | Troubleshooting | FAQ | All Products ] It detects 19 different harmonic pri
Weis Wave with Alert MT5
Trade The Volume Waves Single Member P.C.
4.94 (17)
Rental/Lifetime Package Options and Privileges  Rent Monthly Six Months   Yearly/Lifetime Weis Wave with Speed with Alert+Speed Index x x x Manual  x x x Quick Set up Video x x x Blog x x x Lifetime Updates x x x Setup and Training Material x x Discord Access Channel "The SI traders"          x Rectangle Break Alert Tool      x How to trade with it:    http://www.tradethevolumewaves.com   ** If you purchase please contact me to setup your  : Training Room and  complete manual access.  Wei
Rtc ML Ai Predictor
Muhammad Faisal Sagala
Rtc ML Ai | Predictor CORE MACHINE LEARNING ENGINE Adaptive ML Market Predictor – Multi-Bar Trend & Candle Forecast What This Indicator Does This indicator is a  real-time market prediction engine  designed to analyze price behavior and estimate  future market tendencies . Unlike conventional indicators, this system  does not rely on static parameters or historical curve-fitting , but adapts its internal state dynamically during live market operation. Instead of using static rules, the indic
Quantum TrendPulse
Bogdan Ion Puscasu
5 (20)
SuperTrend   ,   RSI   ,   Stochastic   의 힘을 하나의 포괄적인 지표로 결합하여 트레이딩 잠재력을 극대화하는 궁극의 트레이딩 도구   인 Quantum TrendPulse를   소개합니다. 정밀성과 효율성을 추구하는 트레이더를 위해 설계된 이 지표는 시장 추세, 모멘텀 변화, 최적의 진입 및 종료 지점을 자신 있게 식별하는 데 도움이 됩니다. 주요 특징: SuperTrend 통합:   주요 시장 추세를 쉽게 따라가고 수익성의 물결을 타세요. RSI 정밀도:   매수 과다 및 매도 과다 수준을 감지하여 시장 반전 시점을 파악하는 데 적합하며 SuperTrend 필터로 사용 가능 확률적 정확도:   변동성이 큰 시장에서 숨겨진 기회를 찾기 위해 확률적 진동   을 활용하고 SuperTrend의 필터로 사용 다중 시간대 분석:   M5부터 H1 또는 H4까지 다양한 시간대에 걸쳐 시장을 최신 상태로 유지하세요. 맞춤형 알림:   맞춤형 거래 조건이 충족되면
Ultimate Boom and Crash Indicator The Ultimate Boom and Crash Indicator is a cutting-edge tool developed by  Coetsee Digital , designed to identify potential spike opportunities in the market. Crafted for traders focusing on Deriv and Weltrade synthetic markets, this indicator is optimized to operate exclusively on the 3-minute (M3), 5-minute (M5), 15-minute (M15), 30-minute (M30), and 1-hour (H1) timeframes and supports only the following pairs: PainX 1200, PainX 999, PainX 800, PainX 600, Pai
Entry Points Pro for MT5
Yury Orlov
4.48 (138)
다시 색을 칠하지 않고 거래에 진입할 수 있는 정확한 신호를 제공하는 MT5용 지표입니다. 외환, 암호화폐, 금속, 주식, 지수 등 모든 금융 자산에 적용할 수 있습니다. 매우 정확한 추정값을 제공하고 매수와 매도의 가장 좋은 시점을 알려줍니다. 하나의 시그널로 수익을 내는 지표의 예와 함께 비디오 (6:22)시청하십시오! 대부분의 거래자는 Entry Points Pro 지표의 도움으로 첫 거래 주 동안 트레이딩 결과를 개선합니다. 저희의   Telegram Group 을 구독하세요! Entry Points Pro 지표의 좋은점. 재도색이 없는 진입 신호 신호가 나타나고 확인되면(시그널 캔들이 완성된 경우) 신호는 더 이상 사라지지 않습니다. 여타 보조지표의 경우 신호를 표시한 다음 제거되기 때문에 큰 재정적 손실로 이어집니다. 오류 없는 거래 게시 알고리즘을 통해 트레이드(진입 또는 청산)를 할 이상적인 순간을 찾을 수 있으며, 이를 통해 이를 사용하는 모든 거래자의 성공률이
PZ Day Trading MT5
PZ TRADING SLU
2.83 (6)
Effortless trading: non-repainting indicator for accurate price reversals This indicator detects price reversals in a zig-zag fashion, using only price action analysis and a donchian channel. It has been specifically designed for short-term trading, without repainting or backpainting at all. It is a fantastic tool for shrewd traders aiming to increase the timing of their operations. [ Installation Guide | Update Guide | Troubleshooting | FAQ | All Products ] Amazingly easy to trade It provides
" Dynamic Scalper System MT5 " 지표는 추세 파동 내에서 스캘핑 방식으로 거래하도록 설계되었습니다. 주요 통화쌍 및 금에서 테스트되었으며, 다른 거래 상품과의 호환성이 가능합니다. 추가적인 가격 변동 지원을 통해 추세에 따라 단기 포지션 진입 신호를 제공합니다. 지표의 원리 큰 화살표는 추세 방향을 결정합니다. 작은 화살표 형태의 스캘핑 신호를 생성하는 알고리즘은 추세 파동 내에서 작동합니다. 빨간색 화살표는 상승 방향을, 파란색 화살표는 하락 방향을 나타냅니다. 민감한 가격 변동선은 추세 방향으로 그려지며, 작은 화살표의 신호와 함께 작용합니다. 신호는 다음과 같이 작동합니다. 적절한 시점에 선이 나타나면 진입 신호가 형성되고, 선이 있는 동안 미결제 포지션을 유지하며, 완료되면 거래를 종료합니다. 권장되는 작업 시간대는 M1~H4입니다. 화살표는 현재 캔들에 형성되며, 다음 캔들이 이미 시작되었더라도 이전 캔들의 화살표는 다시 그려지지 않습니다. 입
물론입니다. 아래는 제공해주신 텍스트의 한국어 번역입니다: MT4용 천문학 지표 소개: 귀하의 최상급 하늘 트레이딩 동반자 트레이딩 경험을 천체의 높이로 끌어올리기 준비가 되셨나요? MT4용 천문학 지표를 소개합니다. 이 혁신적인 도구는 복잡한 알고리즘의 힘을 활용하여 탁월한 천문학적 통찰과 정밀한 계산을 제공합니다. 정보의 우주를 손에 담다:   천문학적 데이터의 보물함을 드러내는 포괄적인 패널을 살펴보세요. 행성의 지오/헬리오센트릭 좌표, 태양/지구 거리, 크기, 길이, 별자리, 황도 좌표 및 적도 좌표, 심지어 수평 좌표 등 각각이 정밀하게 계산되고 아름답게 제시됩니다. 지표에 의해 생성된 수직선은 시간 값에 해당하여 트레이딩 여정에 우주적인 시각을 부여합니다. 행성 라인과 관계:   수정 가능한 스케일과 각도로 차트를 장식하는 행성 라인의 마법을 경험해보세요. 직관적인 컨트롤 패널을 통해 각 행성의 라인의 가시성을 손쉽게 전환할 수 있습니다. 쥰션이나 섹스타일, 사분각, 삼분
PZ Divergence Trading MT5
PZ TRADING SLU
3.71 (7)
Unlock hidden profits: accurate divergence trading for all markets Tricky to find and scarce in frequency, divergences are one of the most reliable trading scenarios. This indicator finds and scans for regular and hidden divergences automatically using your favourite oscillator. [ Installation Guide | Update Guide | Troubleshooting | FAQ | All Products ] Easy to trade Finds regular and hidden divergences Supports many well known oscillators Implements trading signals based on breakouts Displays
제작자의 제품 더 보기
# Power Assisted Trend Following Indicator ## Overview The PowerIndicator is an implementation of the "Power Assisted Trend Following" methodology developed by Dr. Andreas A. Aigner and Walter Schrabmair. This indicator builds upon and improves J. Welles Wilder's trend following concepts by applying principles from signal analysis to financial markets. The core insight of this indicator is that successful trend following requires price movements to exceed a certain threshold (typically a mul
FREE
# Optimised Wilders Trend Following AutoAdjusting VixControlled Expert Advisor ## Overview The Optimised Wilders Trend Following AutoAdjusting VixControlled Expert Advisor is an advanced trading system for MetaTrader 5 that implements a sophisticated trend following strategy based on Welles Wilder's concepts, enhanced with modern risk management techniques. This EA combines multiple innovative features to adapt to changing market conditions while maintaining strict risk control parameters. #
Hidden Markov Model 4
Andreas Alois Aigner
HMM4 Indicator Documentation HMM4 Indicator Documentation Introduction The HMM4 indicator is a powerful technical analysis tool that uses a 4-Gaussian Hidden Markov Model (HMM) to identify market regimes and predict potential market direction. This indicator applies advanced statistical methods to price data, allowing traders to recognize bull and bear market conditions with greater accuracy. The indicator displays a stacked line chart in a separate window, representing the mixture weights of f
필터:
리뷰 없음
리뷰 답변