Head and Shoulders Pattern Scanner Mt5
- 指标
-
Davoud Moghaddam
 I am a professional MQL5 developer and software engineer with over 5 years of hands-on experience in the Forex market. My main expertise lies in designing, developing, and optimizing Expert Advisors (EAs), custom indicators, and automated trading tools based on various trading strategies.
 - 版本: 1.4
- 更新: 21 十二月 2023
- 激活: 20
- This is the Full Version, to get the free version please contact me.
The free version works on “AUDNZD” and “XAUUSD” charts. - All symbols and time frames scanner
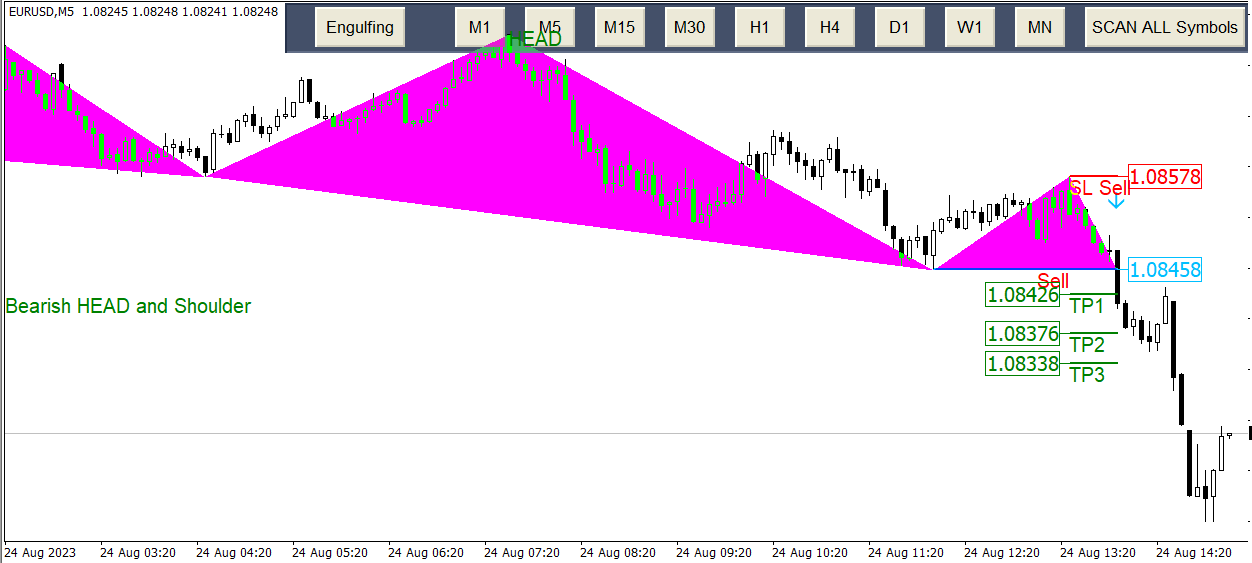
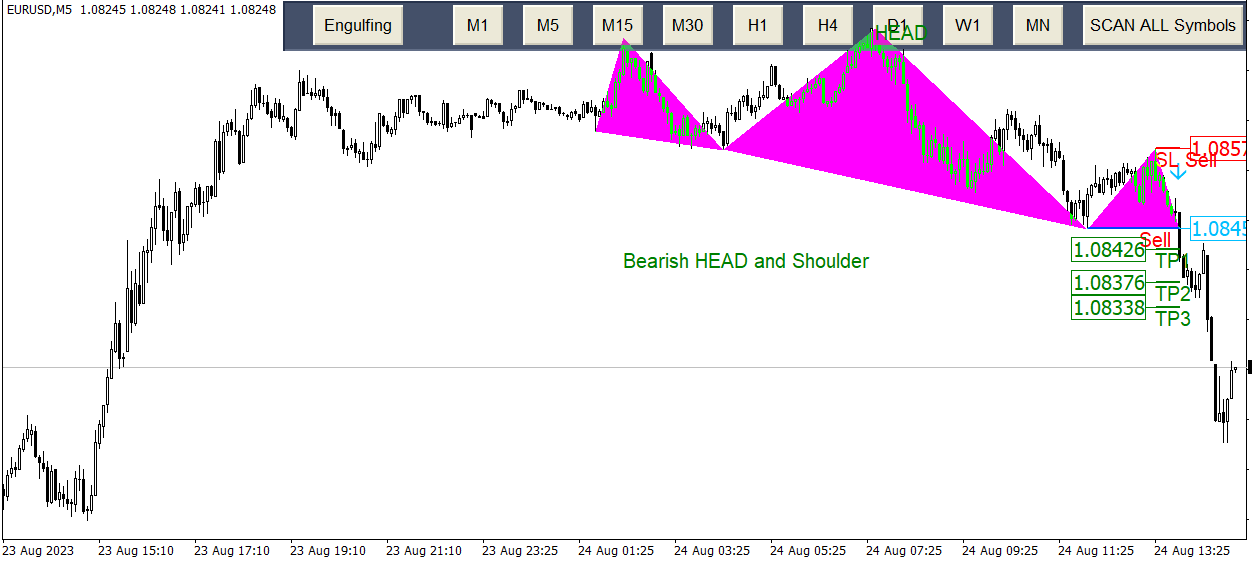
Head and Shoulder
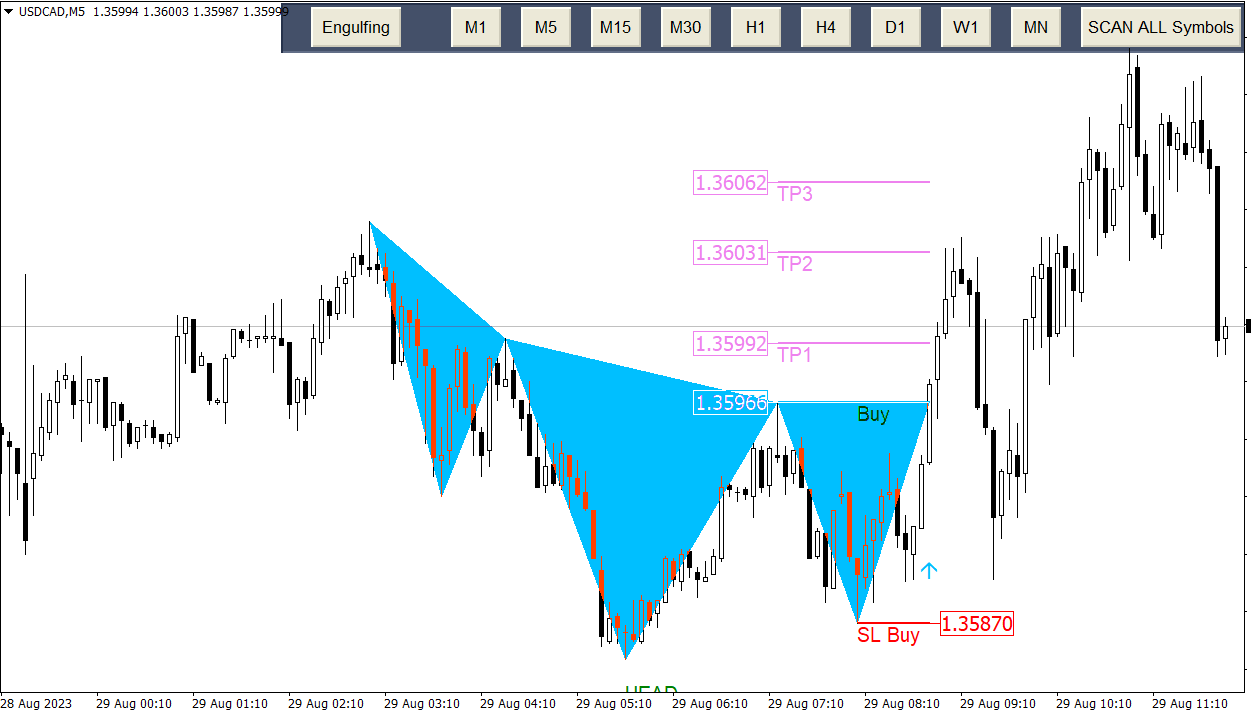
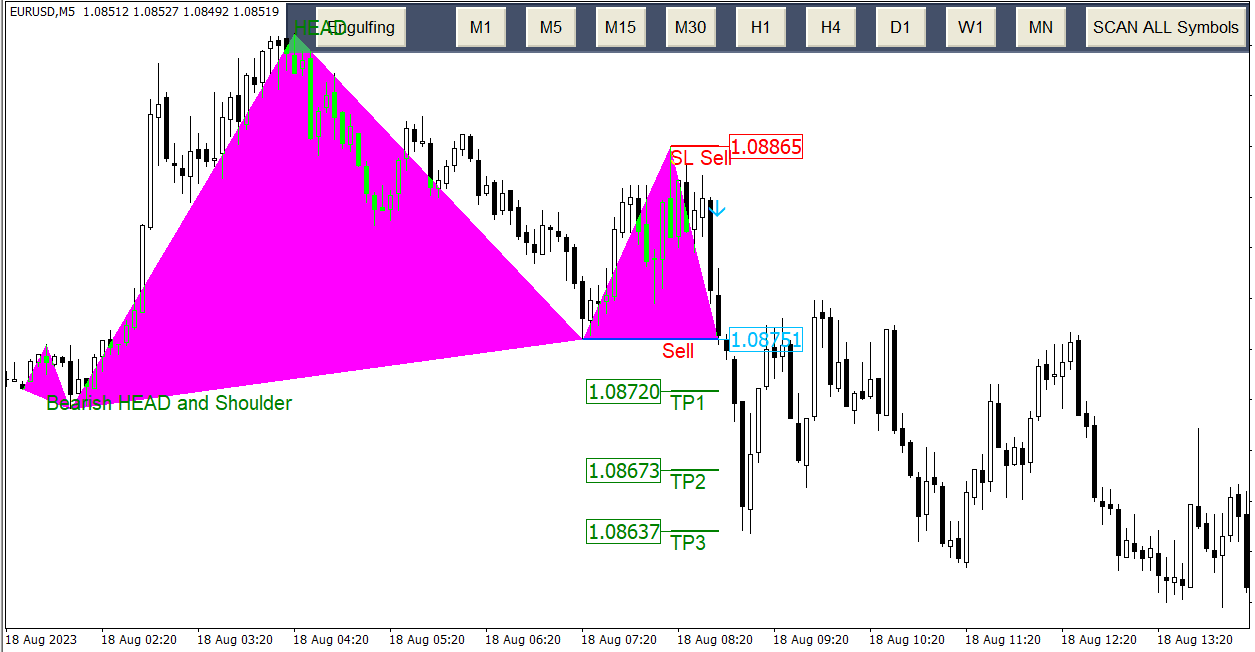
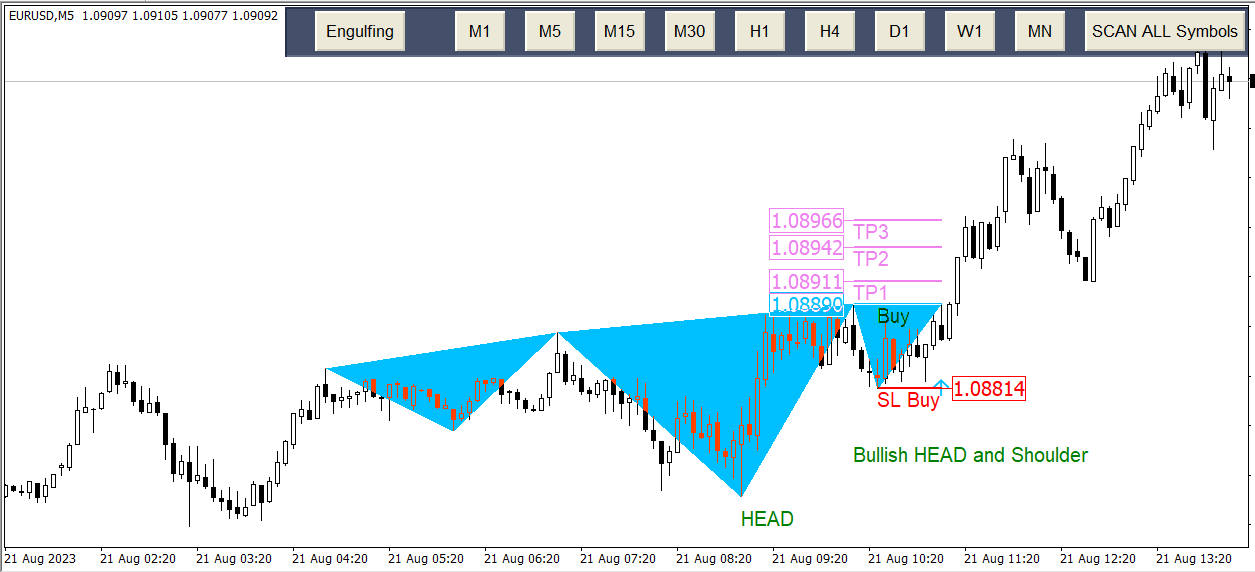
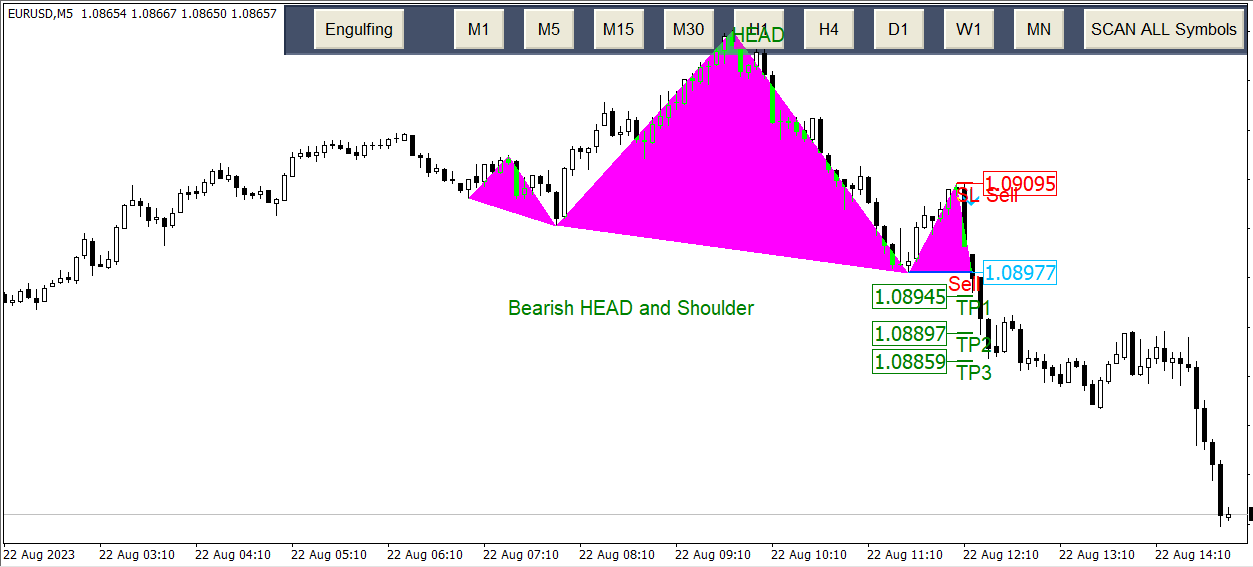
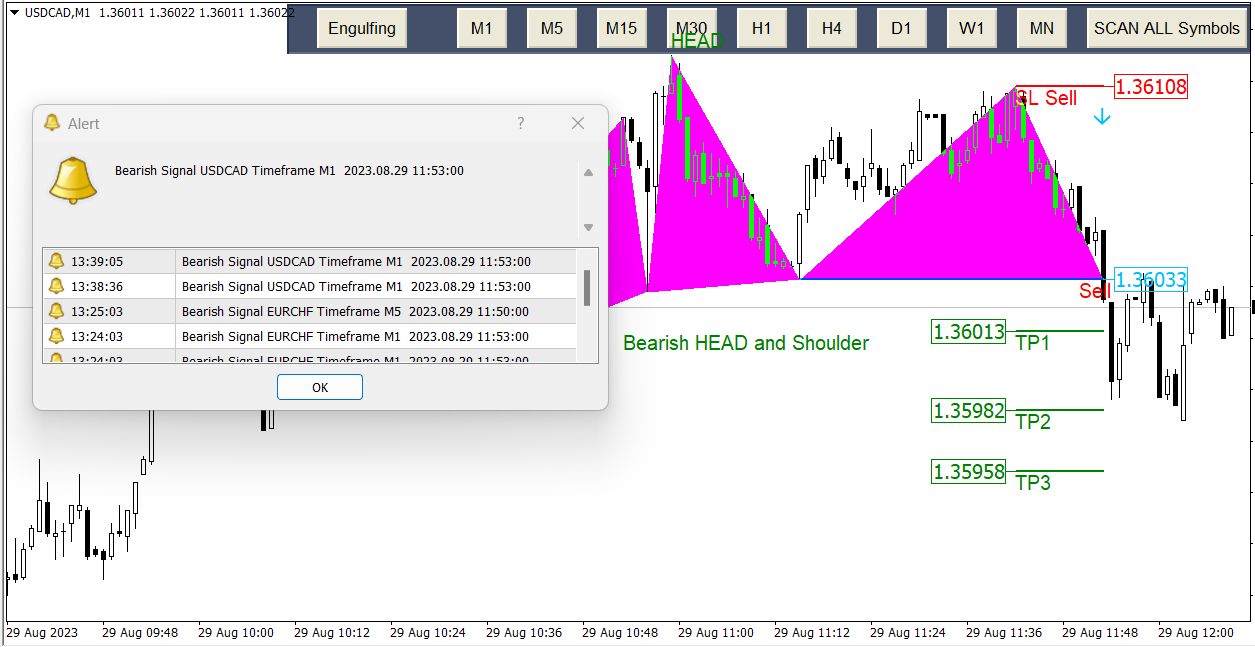
One of the most popular Price Action patterns is the Head and Shoulders pattern. The pattern has three local tops that resemble the left shoulder, head, and right shoulder. The head and shoulders chart pattern appears in all kinds of markets, including Forex, cryptocurrency, commodities, stocks, and bonds. The head and shoulders chart in a bullish market depicts a bullish-to-bearish trend reversal and signals that an upward trend is nearing its end. An inverse head and shoulders formation in a bearish market means the trend must have reached its bottom and could turn up. In this indicator, you can scan the head and shoulder pattern for the current symbol and time frame as well as other symbols and time frames. With Breakout, a message will be shown to you. A breakout is a potential trading opportunity that occurs when an asset's price moves above a resistance level or moves below a support level on increasing volume.
Head and Shoulder MT4 Here
Main Features |
Input Parameters |
Display / Style Option
- Changing the color of the bullish and bearish head and shoulder,TP and SL
- Changing line thickness
Alert Settings
- Display Alert, Enable or disable Alert
- Display Notification, Enable or disable Notification
- Send Email, Enable or disable Email