适用于MetaTrader 5的EA交易和指标 - 54

RITZ – 8 Main Market Zones & Smart Candle Timer is an advanced market-timing and session-analysis indicator designed to enhance intraday trading precision. The indicator features an adaptive candle countdown timer with dynamic time format, color warnings, blinking effects, size scaling, and multi-level sound alerts to help traders anticipate candle close and critical market moments accurately. It includes a global market session panel covering 8 major trading zones worldwide , displaying real-t
FREE

MartingaleFusion EA: Intelligent Adaptive Grid Trading System Frustrated by simplistic EAs failing in dynamic markets? MartingaleFusion is a sophisticated automated trading system designed for enhanced performance through advanced analysis and adaptive execution. This EA utilizes a multi-indicator confluence entry protocol, requiring alignment from EMAs, RSI, and MACD to identify higher-probability initial trade setups and
FREE
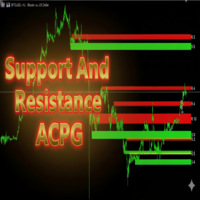
Support And Resistance ACPG Indicator
The Support And Resistance ACPG Indicator (developed by Grok by xAI) is an advanced tool for the MetaTrader 5 (MQL5) platform, designed to identify and visualize support and resistance zones on a price chart. Unlike traditional support and resistance indicators, the ACPG method combines a dynamic approach based on swing points, volatility analysis using the Average True Range (ATR), and an adaptive clustering system to detect high-relevance zones in the
FREE

30-DAY FULLY FUNCTIONAL TRIAL – EXPERIENCE THE POWER OF BITBOT V6 ULTIMATE GRID & NEURAL MODEL BRAIN! Bitbot V6 Ultimate Grid is the most advanced and flexible grid trading system for MetaTrader 5, now enhanced with our AI-driven Neural Model Brain for truly adaptive and intelligent trading decisions.
Whether you’re a professional algorithmic trader or an ambitious newcomer, Bitbot V6 gives you the performance, safety and transparency you need to scale your results to the next level. Key Featur
FREE

指数移动平均线(双重或三重)包络指标是一种技术分析工具,旨在帮助您识别金融市场中的趋势和潜在的逆转点。该指标为交易员提供了选择两种指数移动平均线的灵活性:双重指数移动平均线(DEMA)或三重指数移动平均线(TEMA)。
主要特点:
双重或三重指数移动平均线:根据您的分析偏好和需求,切换在DEMA和TEMA之间。 可定制的包络线:定义自己的带宽参数并调整包络线的外观以适应您的交易风格。 趋势识别:包络线有助于可视化市场趋势,从而更容易识别看涨和看跌趋势。 潜在的逆转点:价格触及包络线可能表明潜在的逆转点,使您能够做出明智的决策。 用户友好:该指标易于在您的MetaTrader 5平台上安装和使用。
立即免费下载此指标,提升您在MetaTrader 5中的技术分析能力!
FREE

News Scalper EA is an Expert Advisor for trading EURUSD - GBPUSD - XAUUSD pairs, positioning your positions during the news. Developed by an experienced trader with over 17 years of trading experience. News Scalper EA uses a news calendar from MQL5 and trades according to them. With sophisticated strategy and risk management, the EA protects your positions from larger losses! News Scalper EA lets you close the SL after the set time (1 minute, planned) when the position is in minus, which proves
FREE

An automated trading system with smart entry/exit algorithms that uses grid and martingale techniques to maximize profits. You can search for current signals on this page, or write me a personal message: https://www.mql5.com/en/signals/author/test-standart The default settings ( M1 timeframe ) are suitable for currency pairs, especially for pairs with GBP. All new sets appear here: https://www.mql5.com/en/blogs/post/747929 A description of the Expert's parameters can be found in the comment th

Hello algo traders. The Expert Advisor trades on gold (XAUUSD), any timeframe (the same on any TF), the initial account balance is from $100.
The following presets are available "GS SL dynamic 001for100" . Each position has several closing logics, including a hidden StopLoss, which is calculated individually for each position, based on the volatility of the last hours. (If you have special stop requirements, then you can set your SL and TP in points via the parameters: "TakeProfit_Safety" and

CRYSTAL AI PRO v7.21 — MT5 智能交易系统(EA) 概述
适用于 XAUUSD(黄金) 与主要外汇品种的自动交易系统;管理入场、SL/TP、跟踪止损与回撤控制,遵循规则执行。不承诺盈利;请阅读风险提示。 运行要求 平台:MetaTrader 5 账户类型:ECN/RAW 推荐 连接:24/7 运行(建议 VPS) 周期:M1–H4 初始设置 启用 Algo Trading 。 将 EA 挂到图表(每个品种单独图表)。 在 Inputs 中设置 AI_Access_Mode = ON ,然后重新加载 EA。 根据资金/杠杆/经纪商条件调整风险参数。 建议条件 充足保证金与稳定执行(低点差/低延迟)。 黄金建议起始资金 $5,000+ (1:500);多品种交易时降低风险。 先在模拟或 cent 账户验证。 核心功能 规则化入场与 SL/TP 、 保本 、 跟踪止损 。 回撤控制 :在劣势阶段降低交易频率。 多品种支持(每品种一张图表)。 适配不同波动与交易时段。 在模拟/cent 账户可完整评估逻辑。 Inputs(要点) AI_Access_Mode 开启完

Divergence Hunter - Professional Multi-Oscillator Divergence Detection System Overview Divergence Hunter is a professional-grade technical indicator designed to automatically detect and visualize price-oscillator divergences across multiple timeframes. Built for serious traders who understand the power of divergence trading, this indicator combines precision detection algorithms with an intuitive visual interface. Key Features Multiple Oscillator Support: RSI (Relative Strength Index) MACD (Mo
FREE
TW Volume Signal Pro MT5 利用先进的人工智能技术和专有智能算法,让您在黄金市场中交易更有信心,带来独特且无与伦比的交易体验。
您是否正在寻找高精度和卓越的黄金市场交易信号?
通过 TW Volume Signal Pro MT5,您可以成为专业交易者,并在黄金市场取得巨大成功。立即免费试用!
TW Volume Signal Pro MT5 的主要特点: 精准信号,固定止盈和止损 快速识别市场趋势变化 实时进出场提醒 三重利润目标的风险管理 安全区域自动止损 完全可调和自定义 在图表旁显示信号历史 在黄金和外汇市场表现出色 适合剥头皮交易者(M5 和 M15) 可在策略测试器中测试
为何选择此产品?
高准确性:精确且固定的信号 易用性:简洁友好的界面 灵活性:可自定义设置,兼容您的个人策略 可测试性:可以回测并精确计算盈利 购买此产品可获得价值 $37 的赠品。 要了解如何设置该产品,请阅读此文章。
https://www.mql5.com/en/blogs/post/759779 我们的客服团队随时为您解答!
The Absorption & Exhaustion Detector Professional indicator is a sophisticated volume analysis tool designed to identify critical market turning points by analyzing the relationship between price movement and cumulative volume delta (CVD). This indicator helps traders spot when price movements lack volume confirmation, indicating potential absorption or exhaustion zones. KEY FEATURES Real-time Cumulative Volume Delta (CVD) calculation and normalization Price-volume divergence gap measurement dis

This is not an EA – it’s a simple and powerful MT5 indicator designed to help you manage trades quickly and easily. Key Features: TP1 Auto-Set – Fixed at 1RR TP2 Auto-Set – Set at 2RR Fast Lot Calculation – Calculates lot size based on SL in 1 second Quick Actions: Close All Trades Move to Breakeven Set TP at RR1 / RR2 User-Friendly – No complex setup, just attach to chart and start using Support:
Telegram – @inForexVIP
WhatsApp – +923118409597 MT4 Version Coming Soon
W
FREE

这款实用 专家顾问 利用 Parabolic SAR 指标动态设置并 追踪止损 (SL) 水平,以保护已实现利润,最大程度地减少手动交易管理。 主要特点 动态 SL 调整: 专家顾问会在每个新柱上,自动将任何开仓头寸的止损 (SL) 调整到当前 Parabolic SAR 点位所示的水平。 趋势跟随保护: 由于 Parabolic SAR 的加速特性,可确保在强劲趋势中 SL 紧密跟随价格。 可自定义灵敏度: 用户可以指定 SARSteps 和 SARMax 参数,以微调追踪止损机制的加速度和灵敏度。 操作简便: 一旦附着到图表上,专家顾问就会在后台自动运行,无需人工干预即可更新 SL。 如何使用 将专家顾问附着到包含开仓交易头寸的图表上。 专家顾问将根据指定的参数计算当前的 Parabolic SAR 水平。 开仓订单的止损 (SL) 将设置为确定的 SAR 水平。 然后,专家顾问将开始不断调整 SL,使其在该交易品种上根据 Parabolic SAR 追踪价格。 参数 SARSteps: 加速因子 增量。该值决定了 Parabolic SAR 的加速因子随着每个新的极端价位增加的步
FREE

This is a simple RSI indicator, but unlike the original one, it sends alerts when volume falls below the upper level or rises above the lower level, so you never miss a trading opportunity. Combined with support and resistance levels, it can provide strong entry opportunities into the market. I recommend keeping the levels as they are, i.e. 75 above and 25 below Check out my signal " PipStorm Invest ", save it to your favorites and come back from time to time to check it again :)
FREE

Principle of Operation The indicator is based on the basic price data: high, low, and close , organized in the form of full-body candles .
Each candle visually represents market behavior over a specific period. When the candle is bullish, it indicates buying pressure . When the candle is bearish, it indicates selling pressure . The size of the candle body shows the strength of buyers or sellers :
larger bodies indicate stronger momentum, while smaller bodies indicate weaker pressure. In addition
FREE
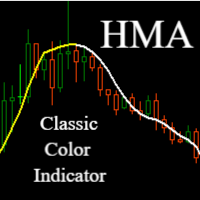
Hull Moving Average (HMA) - Faster and More Precise Trend Tracking
Hull Moving Average represents a revolutionary approach to trend analysis that overcomes the common shortcomings of traditional moving averages. This advanced indicator, developed by Alan Hull, practically eliminates the lag typical for standard moving averages while maintaining exceptional signal smoothness.
Key Benefits:
Significantly faster response to trend changes than traditional moving averages Minimal lag while mainta
FREE

ET1 MT5 版 新上架,完全免费 ET1 for MT5 v4.20更新!!现在可用于 XAUUSD(黄金)!! 成功率达到75%以上!!!
重要更新:合并ET9的突破策略
注意!! 你可以完全免费的使用ET1, 但我们不对ET1稳定性作出保证, 推荐更加强大的ET9 MT5版包括ET1的策略,并保证完整稳定的收益. 最佳黄金(XAUUSD)自动交易程序 ET9 MT5 版 更新 v4.70 !! https://www.mql5.com/zh/market/product/113134 Dragon Ball MT5版 更新 v1.70 !! https://www.mql5.com/zh/market/product/116514
ET1 MT5 版仅使用真实专业交易员最常用的策略,在振荡范围内的 突破策略 ,该策略非常适合黄金 (XAUUSD)! 我们的ET1 ,在趋势交易上,每一单都设置有动态的止盈与止损,ET1 的策略不会像头皮系统一样高频交易,滑点会导致每一单最后都以亏钱而告终…… 如果一段时间内会有亏损,请不要过分担心,在这个交易市场内,没有永远的赢
FREE

Volatility Break Signals Description:
The Volatility Break Signals is an indicator designed to detect potential trend changes while partially filtering market noise. It uses an adaptive volatility measure based on the selected price (Close, Open, High, Low, etc.) and generates Buy and Sell signals when the price shows a reversal relative to the previous direction. How it works: Price Volatility Measurement The indicator calculates the absolute price changes from bar to bar ( |price - previous
FREE

The RSI Divergence Indicator is a powerful tool designed to identify potential reversals in the market by spotting discrepancies between the Relative Strength Index (RSI) and price movement. Divergences can be a significant indication of an impending trend change, either from bullish to bearish or vice versa. This indicator is built for making the task of identifying potential trade opportunities more straightforward and efficient.
Features: Automatic Detection: The indicator scans the chart
FREE

Hetti is a Martingale based EA works with netting mode on mt5 platform. Signals for buy or sell orders are based on Aligator and Bollinger band indicators. Recommended to run on cent based account with at least 200000 when operating with higher starting lot sizes. (max3)
You can change many setting to find the optimal operation for every vehicle you choose to run. Lets see an example for settings on EURUSD pair from the period of 2016-2023 with every tick based on real ticks. (screenshots
FREE

Dual Bollinger Session Channel MetaTrader 5 专业固定会话布林通道
专为价格行为、突破交易及机构级市场结构分析而设计,基于真实交易会话数据。 限时优惠: 本指标免费提供至 2026年1月15日 ,或限前 100 次下载 ,以先到者为准。 产品概述 Dual Bollinger Session Channel 是一款 MetaTrader 5 的专业级技术指标,它基于前一个真实交易会话(日线或周线)的数据,通过两个独立的布林带计算,构建出固定的统计价格通道。 与传统布林带在每个新K线出现时持续重算不同,本指标会在整个当前活跃会话期间 锁定所有通道水平 ,为交易者在整个交易时段内提供稳定可靠的统计框架。 该方法可精准可视化以下内容: 价格均衡区域 统计超伸区域 波动率扩张与收缩区域 该指标在 任意时间周期 下均完全可用,保持视觉一致性,并消除基于对象类指标常见的失真问题。 运行逻辑 识别上一个有效的交易会话(日线或周线) 计算两条独立的布林带: 内轨(BB1) :使用较小的标准差 外轨(BB2) :使用较大的标准差 所有计算出的水平在当前整个会话
FREE

In this indicator, Heiken Ashi candles are calculated with the most optimal method. You can also customize the results by adjusting the amount of period and method input. But the most important advantage of this indicator is the adjustment of the time frame value. You can use this to calculate the Heiken Ashi chandels to See in time frames with lottery in the lower time chart. In this case, you get the best signal to buy or sell using two or more Heiken Ashi indicators with different timeframes
FREE

Arbi V 0.1 is a sophisticated Expert Advisor (EA) designed for traders looking to capitalize on arbitrage opportunities in the cryptocurrency market. Developed by Samir Ranguni, this EA automates a dual-pair trading strategy, simultaneously opening a then waits for a specified market drop before initiating new trades. Ideal for traders seeking a hands-off approach to crypto trading, Arbi V 0.1 combines precision, flexibility, and a clear trading logic.
Input Parameters Symbol1 (default: "BTCUS
FREE

Equity Shield Pro 1.1
NEW VERSION Equity Shield Pro 1.1 is a powerful utility EA designed to safeguard your trading account by actively monitoring and enforcing equity protection and profit management rules. Whether you’re trading personal accounts or working through proprietary firm challenges, this EA ensures strict adherence to risk and profit targets, enabling you to maintain discipline and consistency. Fully compatible with all challenge types, Equity Shield Pro 1.1 is specifically craft

指标供需 RSJ PRO 计算并在图表上绘制“供应”和“需求”区域,识别区域类型(弱、强、已验证、已证明),并在区域重新测试的情况下显示它的次数被重新测试。 “供应”区是出现供大于求的价格区域,导致价格下跌。 “需求”区域是需求大于供应的价格区域,从而推高价格。
请务必尝试我们具有可配置功能和警报的专业版本: Suppy Demand RSJ PRO
区域分类 弱:价格区域,如果重新测试,可能会被违反。 强:价格区域已经改变了趋势方向,不太可能很快被重新测试。 已验证:强价区,最多有1-3次复测,但价格未能突破该区。 证明:强势价格区域,有3次或以上复测,但价格未能突破该区域。 Broken/Turncoat:被打破的价格区域,在支撑的情况下成为阻力,在阻力成为支撑的情况下。
设置 显示区域标签和信息:真实案例在区域的右侧写下区域类型和重新测试的次数(如果适用)。 注意:仅当图表偏移选项处于活动状态时才有效。 字体颜色:设置文本的颜色 字体大小:设置字体大小
如果您仍有疑问,请通过直接消息与我联系: https://www.mql5.com/zh/users/robsju

BullBear Strength Meter The BullBear Strength Meter is a dynamic market sentiment and momentum indicator that quantifies the real balance of power between buyers and sellers. Instead of relying on a single formula, it fuses multiple proven analytical engines into one comprehensive strength model — giving traders an accurate visual readout of bullish and bearish dominance in real time. This tool measures, compares, and displays the intensity of market forces using advanced statistical and trend-b
FREE

WYSIWYG OPEN RANGE BREAKOUT - PRO EDITION
Ultra-precise ORB indicator with smart line-breaking, dynamic ATR-based targets, and multi-session adaptability. Perfect for day, swing, and algorithmic traders seeking clear visuals and actionable levels . Trade with confidence – see what you trade, trade what you see . "What You See Is What You Get" "What You See Is What You Get" – The ultimate ORB indicator delivering ultra-precise trading range visualization with a smart line-breaking system. Built
FREE

[ How to use the Demo version ] [ MT4 Version ] AO unpaid divergences MT5 AO unpaid divergences is the first indicator developed to detailed analyze Regular and Hidden Divergences. It uses this analysis to find out possible entry points and targets. Below some of the characteristics of this indicator: Time saving Highly customizable Working for all pairs (Crypto, Forex, Stocks, Indices, Commodities...) Suitable for Scalping or Swing trading Possible reversal swings Alerts and Notifications on M

Trading Dashboard Pro: MetaTrader 5 专业交易指挥中心 将您的 MT5 终端升级为机构级交易工作站 Trading Dashboard Pro (交易仪表板专业版) 是专为职业交易员、自营公司(Prop Firm)挑战者和严肃的剥头皮交易者设计的综合风险管理和账户分析工具。通过将关键的市场数据、账户健康指标和历史绩效整合到一个优雅的界面中,它让您可以专注于最重要的事情:做出正确的交易决策。 为什么您需要这个仪表板? 1. 专为自营公司交易员设计 (FTMO, MFF 等)
自营交易公司对 每日回撤 (Daily Drawdown) 和 最大回撤 (Max Drawdown) 有极其严格的规则。
解决方案: 我们的仪表板专门跟踪并显示当前日和当前月的 Max DD (最大回撤)。您将立即知道您距离每日亏损限制还有多远,从而帮助您避免违规爆仓。 2. 专为剥头皮和日内交易者设计
当您在几分钟内频繁进出市场时,您没有时间切换到“历史”选项卡并手动汇总利润。
解决方案: “每日交易分析”部分即时更新,让您一目了然地看到“今天”
SignalDeMarker - stable in its work automatic adviser. The algorithm of the adviser's work is based on the definition of overbought / oversold market zones, built on the basis of an assessment of the current demand and the level of risk. The indicator is installed in the usual way, on a chart with a time period of D1 and works with any trading instrument. Options Expert_MagicNumber = 1234 - magic number
Signal_StopLevel = 50.0 - level of stop-loss (in points)
Signal_TakeLevel = 50.0 - Level o
FREE

TickAll - Automated Trading Robot
Introduction: TickAll is an automated trading robot designed to assist both novice traders and professional traders in the Forex market. Utilizing advanced algorithms and up-to-date market analysis, TickAll helps you make the best trading decisions. Market Analysis: TickAll continuously monitors the market, analyzing various indicators, price movements, and patterns to identify potential trading opportunities. Trend Identification: Using sophisticated a
FREE
FOTSI – 外汇真实强度指数概览 发现每种货币的真实力量,并利用优势交易。 FOTSI 指标 是一种 多货币振荡器 ,用于测量每种主要货币(USD, EUR, GBP, JPY, CHF, AUD, CAD, NZD)在所有货币对中的真实动量。 FOTSI 不仅分析单一图表,而是整合多个货币对的数据,平滑价格波动,并应用 True Strength Index (TSI) 算法,为您提供清晰、稳定且无延迟的各货币相对强度视图。 主要特征 多货币振荡器: 独立衡量每种货币的强弱。 超买和超卖水平: +50 → 货币超买(高概率回调)。 –50 → 货币超卖。 ±25 → 中性区。 简单易懂: 曲线在零之上或之下 = 强/弱。 无重绘: 所有计算实时进行并保持稳定。 适用于任何货币对和时间周期: 建议在 H1, H4 和 D1 使用以提高可靠性。 如何使用? 反转策略: 当货币达到 +50 或 –50 极值时寻找反转机会。 入场确认: 结合价格行为或支撑/阻力位使用。 选择最强/最弱货币对: 基于最强货币对最弱货币进行交易。 实用示例 如果 USD 为 +60(超买)且 EUR 为 –

揭示那些大玩家不愿让你看到的秘密。 你是否曾好奇,市场中的**“巨鲸” 是否总在同一时间、朝着同一方向入场?这个指标会向你展示。它不提供具体的入场信号,但它揭示了通常会被忽视的 按小时或按天划分的历史价格波动模式**。 例如,你可能会发现每周四下午 3:00 , 欧元/美元(EURUSD) 有 80% 的概率上涨。它非常适合希望 确认时间偏差 或为其策略 识别高概率时间点 的交易者。 通过它,你可以一目了然地看到:看涨/看跌蜡烛图的百分比、主要方向以及平均波动幅度。因此,你能理解 机构历史上是如何运作的 ,从而快速而简单地完善你的分析。 注意:M30(30分钟图) 数据按小时整合:每小时的数据显示了构成该小时的两根 30 分钟蜡烛图的行为。 注意:针对金属、股票和指数 对于某些资产, 00:00 (午夜)可能不会显示数据,因为市场和经纪商并非总是在这个确切时间开盘。这是正常的,反映了该资产的实际开盘时间。 该指标已在 外汇(Forex) 、股指(SP500, NDX)和贵金属上 开发并测试 。从理论上讲,它的逻辑 也适用于包括加密货币在内的其他资产 ,但 尚未在该市场进行直接验证 。
FREE

介绍 CandleBot - 您的最终免费工具,用于识别和交易蜡烛图形式!借助 CandleBot,轻松识别牛市和熊市的吞没,晨星和暮星信号,从而在市场中占据优势。蜡烛图形式源自一段特定时间内的开盘价、最高价、最低价和收盘价,是价格走势的视觉表现,帮助交易员分析市场情绪,预测潜在的趋势反转或延续。 了解蜡烛图形式: 吞没图形式: 由两根蜡烛组成,第二根蜡烛完全覆盖第一根。在下降趋势结束时,出现的牛市吞没信号可能标志着上升趋势的反转,而在上升趋势结束时,出现的熊市吞没可能表明可能的下降趋势反转。吞没蜡烛的身体越大,信号越强烈。 锤子图形式: 单根蜡烛,其身体靠近顶部,底部有着长长的下影线,类似锤子形状。牛市锤子表明在下降趋势后可能发生反转,显示买家介入。下影线越长,潜在反转信号越强烈。 晨星图形式: 一个由三根蜡烛组成的图形,表明可能发生牛市反转。以一根熊市蜡烛开始(代表下降趋势),接着是一根小的牛市或熊市蜡烛(表示犹豫不决),最后是一根较大的牛市蜡烛(表明可能发生上升趋势)。晨星信号表明下降趋势可能结束,发生反转。 CandleBot 的显著特点: 可定制参数: 为符合您的交易风格,定
FREE

Entry Point M5 — 完整的交易系统 Entry Point M5 是一款强大的指标,被设计成一个功能完善的交易系统,适用于任何货币对。它能够分析价格结构,识别市场反转的关键时刻和新的趋势动能。该指标可以自动适应不同的市场阶段——无论是强趋势行情还是横盘震荡——都能提供清晰直观的交易信号,无需额外的过滤器或辅助工具。 使用这个系统的交易方式非常简单。当 绿色箭头 出现时,开立 买单(Buy) ;当 红色箭头 出现在图表上时,关闭所有买单并开立 卖单(Sell) ;当下一次绿色箭头出现时,关闭所有卖单并重新开立买单。这样,指标就形成了一个完整的交易系统,无需主观判断,只需严格遵循信号。 Entry Point M5 可用于任何货币对和大多数时间周期,包括 M1、M5、M15、H1 及更高周期。凭借内部的自适应公式,指标能够根据不同品种的波动性和价格尺度自动调整参数。 逻辑与工作原理 Entry Point M5 的核心是一个复杂的市场高低点(Pivot 点)识别系统,结合了智能假信号过滤机制以及价格偏离平均值的分析。算法综合了多种技术分析方法,从而最大程度减少虚假信号,只捕捉

Easy Correlations Indicator The Easy Correlations Indicator is designed to help traders analyze the relationship between two correlated instruments. By monitoring the distance between their Relative Strength Index (RSI) values, the indicator highlights situations where one instrument has moved significantly further than the other. This creates potential trading opportunities: Sell the stronger instrument (overstretched RSI) Buy the weaker instrument (lagging RSI) Because the positions are opened
FREE
As the suggested, with this indicator you are able to switch from one symbol or timeframe to another in the same single chart. So forget about opening tons of chart on your screen! It's not designed for ICT or SMC trader, but if you are that kind of trader you still can use it. Imagine you have a strategy containing various indicators and settings, on a single chart you can screen the entry opportunity then move to the next symbol or timeframe.
FREE

Long Term Buy Set1: TP/SL20kpip. Set2: TP/SL10kpip. Set3: TP/SL 5k pip. Set4: TP/SL 2k pip. Set5: TP/SL 500pip. Rate Prop FTMO Broker.
Only Pair DE40, US100, US30. Automatic added EU London Session. This Version works only with fixed Lot and buy. Robot Strategy: Trade open = First "Round Price-Number Entry". Write me a Message of Questions when undecided. I send ex4 Code by Request.
FREE

市场情报架构 SCALPER ROBOT代表算法交易系统的进化,专为寻求快速进出策略且具有外科手术般精确度的交易者设计。通过严格的MQL5市场验证协议开发,该EA将市场微观结构转化为可操作的交易机会,同时保持严格的风险参数。 **时间框架通用性:**M5-H1针对高频机会优化 **资产覆盖:**通用兼容性 - FOREX货币对、XAUUSD、XAGUSD、US30、SPX500、BTCUSD **验证状态:**零错误MQL5市场合规,11阶段交易前验证 Limited Offer : LIMIT OFFER ON SALE: $79.00 ONLY - VALID FOR NEXT 10 SALES NEXT PRICE $399.00 HURRY After purchase for optimized SET FILE: MQL5 CHAT LINK 核心技术框架 自适应进场系统 **动态高低检测:**5-11根K线回顾窗口通过多K线形态识别确定摆动极值 **价格行为验证:**仅在确认突破延续后放置挂单(BUY_STOP/SELL_STOP) **距离过滤:**可配置订

True TrendLines MT5 - Smart Trend Detection & Alerts Overview True TrendLines MT5 is a professional-grade technical analysis tool that automatically identifies and plots high-probability trend lines on your MetaTrader 5 charts. Using a sophisticated swing point detection algorithm, it helps traders visualize key market structure and potential reversal points with precision. Key Features Automatic Trend Line Detection Identifies valid swing highs and lows based on your chosen strength paramet
FREE

Smart Symbol Changer & Multi-Chart Sync Stop wasting time manually changing symbols on every chart. The Smart Symbol Changer is not just a button panel—it is a complete workspace management tool designed for professional traders who monitor multiple assets (Forex, Crypto, Indices) across multiple chart windows. Why this is the best Symbol Changer for MQL5: Most symbol changers are messy and clutter your screen. This tool features a Smart Auto-Grid that automatically sorts your symbols alphabetic
FREE

NtickChart-BVcandle Features This is a free version with limited functionality.
This is a tick chart indicator that displays in a sub-window. Inspired by Bob Volman's (BV) scalping method, it is designed as a tool for achieving simple and effective trading. It is a tick chart specifically for day trading and scalping, focusing even on 1 pipette changes. Instead of time-based candle bars, it generates candle bars for a specified number of ticks (ticks_in_candle). This allows for a more detailed
FREE
Advanced UT BOT ALERTS for MT5 專業多重濾波趨勢識別系統|強化版 UT BOT 引擎 我們只提供高品質的指標。 Advanced UT BOT 為專業交易者設計,採用穩定的信號邏輯與安全運算結構,確保無延遲與錯誤更新。
它 不會重繪、不會重畫、不會刪除或修改 任何過去的信號。
所有 BUY 和 SELL 信號均在 K 線收盤後生成並固定 ,確保穩定性與準確性。
在即時行情中 不會重繪 ,信號會在收盤後即時出現。
限時優惠中 —— 下一次價格將調整為 49 美元。
請把握現在的優惠價格,售完即漲。 產品概述 Advanced UT BOT ALERTS 是新一代的趨勢信號系統,基於 UT BOT 的核心邏輯重新打造,
全面升級為 MT5 版本,融合多重濾波、動態視覺化與高精度警報系統。
UT Bot 指標最初由 Yo_adriiiiaan 開發,本版本由 PioneerAlgoFX 團隊深度強化,
在穩定性、精準度與自訂性方面均達到專業級水準,為實戰交易者而設計。 此系統能夠高精準地識別趨勢反轉與動能變化,
透過多層動態濾波與即時資訊面板輸出 高勝率信號

A simple price action indicator to highlight inside and outside bars (candles) with colors. It is possible to choose what type of bar can be highlighted among: inside, ouside or both. It is can be possible to choose a first specific color for the shadow and the border of bars (candles), a second specific color for high/bull bar (candle) and a third specific color for down/bear bar (candle)
FREE
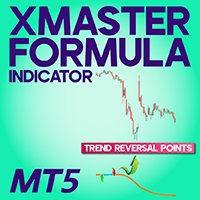
XMaster XHMaster Formula MT5 Indicator – No Repaint Strategy The XMaster / XHMaster Formula Indicator for MetaTrader 5 (MT5) is an upgraded version of the popular MT4 tool, designed to detect trend direction, momentum shifts, and high-probability reversal zones. With enhanced optimization for the MT5 engine, the indicator delivers stable No Repaint signals and performs efficiently on multiple asset classes including Forex, Gold, Cryptocurrencies, and Indices. The MT5 version integrates improved
FREE
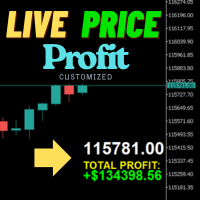
实时价格和总利润显示指标 完美适用于实盘交易和屏幕分享 专为日内交易者、剥头皮交易者和实时交易直播会话设计 这个专业指标直接在您的图表上提供实时价格显示和综合利润跟踪 - 对于高频交易和实时交易广播至关重要。 核心功能 实时价格显示 每秒更新实时买价 所有品种类型的专业格式化 黄金/XAU的特殊格式化 大型清晰显示,完美适合屏幕分享 日内交易决策的即时价格更新 综合利润跟踪 来自交易历史的账户总利润 交易平仓时的实时利润更新 自定义额外利润金额 包含佣金和库存费 带正负指标的专业利润格式化 性能优化 智能缓存系统 - 最小CPU使用 1秒更新间隔 - 闪电般快速 高效的基于定时器的更新 实时交易监控 专业错误处理 高级自定义 可调节字体名称和大小 盈亏自定义颜色 图表上任意位置的灵活定位 专业角落锚定 关键词: 实时价格显示,实时利润追踪器,交易利润指标,账户监视器,日内交易工具,剥头皮指标,直播显示,屏幕分享工具,高频交易,外汇指标,黄金价格显示,利润计算器,实时更新,实时图表显示,交易表现监视器,MT5指标,MetaTrader 5工具
FREE

真正的陀螺指示器
它检测图表上准确的陀螺,平衡的主体和灯芯高度比,这是陀螺的真正含义,不同于锤子和十字线或空烛台。
该指标在图表上找到的陀螺数量处绘制了一个翼形图标。
设置包括
条数:调整搜索条数
图标颜色:更改图标颜色
图标代码:更改图标的wingdings代码
真正的陀螺指示器
它检测图表上准确的陀螺,平衡的主体和灯芯高度比,这是陀螺的真正含义,不同于锤子和十字线或空烛台。
该指标在图表上找到的陀螺数量处绘制了一个翼形图标。
设置包括
条数:调整搜索条数
图标颜色:更改图标颜色
图标代码:更改图标的wingdings代码
真正的陀螺指示器
它检测图表上准确的陀螺,平衡的主体和灯芯高度比,这是陀螺的真正含义,不同于锤子和十字线或空烛台。
该指标在图表上找到的陀螺数量处绘制了一个翼形图标。
设置包括
条数:调整搜索条数
图标颜色:更改图标颜色
图标代码:更改图标的wingdings代码
FREE

Cǐ EA yòng yú héng pán zhōuqí jiāoyì nín shèdìng shǒu shù, zhǐ yíng diǎn shù (bùshì diǎn shù), tíng sǔn diǎn shùliàng, zuìgāo jiàgé, zuìdī jiàgé dàng dàng qián jiàgé shàngzhǎng zhì děngyú huò gāo yú zuìgāo jiàgé shí,EA jiāng xiàdá mài chū dìngdān, bìng bāohán shǒu shù hé T/P jiàgé yǐjí S/L jiàgé dàng dàng qián jiàgé diē zhì děngyú huò dī yú dǐbù jiàgé shí,EA jiāng shǐyòng shǒu shù hé T/P jiàgé hé S/L jiàgé xià mǎi rù dìngdān yīncǐ, zhǐyào héng pán yīduàn shíjiān, nǐ de yú'é jiù huì yǒngyuǎn shàn
FREE

Introducing Shadow Stallion MT5: automatic GOLD (XAUUSD) trading with clear rules, adaptive risk, and strict protection, I read market flow and act only when conditions align,
, then manage each trade with adaptive risk and safety rules. Saddle up.
Specifications Multi Price Actions detected, read the footprint of real capital — following where the big players enter Built-in protection: every trade has SL/TP Auto risk & position sizing managment Very easy to install, does not need any chang
FREE

BTC American Session is a bot designed to trade the American session on BTC in H1 , focusing on the most volatile windows of the day. It is optimized on Vantage (UTC+2) and can be easily re-optimized for any other broker that works on UTC+2 , by loading or fine-tuning the set file to match your broker’s server time and trading conditions. The system behaves like a high-precision model: it concentrates most entries between 14:00 and 23:00 (US session) , keeps an equity curve that grows steadily a

Read This : Please provide comments and reviews for future improvements. WaveTrendPro_Indi v1.05
WaveTrend indicator with enhanced histogram visualization: WaveTrendPro_Indi v1.05
Indikator WaveTrend dengan tampilan histogram yang lebih jelas: Histogram otomatis lebih tinggi (bisa diatur dengan parameter HistScale ). Warna histogram berbeda untuk positif & negatif → tren naik lebih mudah dibaca. Tetap ringan & responsif di berbagai pair/timeframe. Cocok untuk scalper, swing trader,
FREE

This new time-based strategy enable you to schedule precise buy/sell orders at any predefined time , allowing you to execute trades based on timing rather than technical analysis. The system automatically can determines the order type (buy or sell) based on technical confirmations provided by RSI and moving averages. You have the freedom to adjust and customize all parameters related to Buy and Sell criteria, as well as enable or disable technical filters . Link to MT4 version : https://www.
FREE

The Official Automated Version of the Powerful Indicator PipFinite Trend PRO EA Trend PRO trades the signal of PipFinite Trend PRO and manages the trade depending on the user's preference.
The EA includes many customizable features that can further enhance the Trend PRO trading strategy.
Features like Entry and Exit Filters, Higher Timeframe Filter, Stoploss, Takeprofit, Breakeven, Trailing Stop, News Filter and MORE!
The Innovative Solution
EA Trend PRO was created to make your trading more
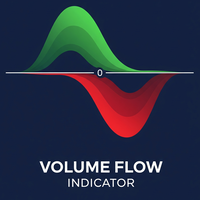
Volume Flow Indicator (VFI) - User Manual 1. General Introduction The Volume Flow Indicator (VFI) is an advanced technical oscillator designed to measure the strength and sustainability of a price trend by incorporating both price and volume data. Developed based on the concepts of On-Balance Volume (OBV) but with significant improvements, the VFI provides deeper insight into money flow and the conviction behind price movements. This indicator is not an automated trading system but a powerful an
FREE
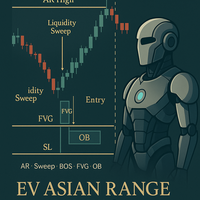
EV Asian Range Reversal is an automated Expert Advisor designed to detect the Asian session range and trade reversals as the London session opens. It focuses on high-volatility transitions and aims to capture market displacement that occurs when liquidity is taken from both sides of the range. The EA automatically identifies the session high and low, validates structure and executes a reversal strategy when price sweeps liquidity and confirms direction. Stop Loss, Take Profit and trading hours
FREE

Currency Strength Chart is a powerful Forex indicator designed to track and visually represent the strength of individual currencies within a basket of the 8 major currencies: USD, EUR, GBP, JPY, AUD, NZD, CAD, and CHF. By calculating the relative strength of each currency, the indicator provides traders with a comprehensive overview of how each currency is performing against the others in real-time. This indicator helps traders identify potential trading opportunities by highlighting strong cur
FREE

凤凰回撤监测器(MT5)
专为MetaTrader 5设计的实时回撤监控工具。在图表上实时显示真实账户回撤百分比,帮助交易者管理风险并避免突破账户限额。
功能定位
回撤是管理自营账户或严格风险管理型投资组合的交易者最关键的风险指标。超过回撤限额可能导致账户失效或数周盈利化为乌有。
凤凰回撤监测器基于经纪商服务器权益与余额数据,实时呈现当前回撤状态。当价格与持仓波动时,监测器自动更新数据,使交易者能在触及限额前及时采取行动降低风险敞口。
安装说明
从MQL5市场下载后附加至任意图表。监测器即时显示且无需配置。
系统要求
MetaTrader 5 3280版或更高版本。本工具为专家顾问,需在图表上运行。仅基于实时权益数据显示当前账户回撤数据。
反馈与评价
若您认为本工具实用,敬请在MQL5平台给予五星好评。您的反馈将直接影响凤凰团队的后续更新、优化及新工具开发——我们致力于打造交易者真正重视的功能。
技术支持
通过MQL5私信提供终身支持,24小时内响应。
开发方:凤凰环球投资有限公司 2025 凤凰环球投资有限公司。保留所有权利。
FREE

PurrTradeX 是一款智能交易顾问(EA),允许用户基于自己的指标信号创建和测试自定义交易策略。该EA会捕捉图表上手动放置或自动生成的箭头信号,并利用它们来识别交易机会。 主要功能 信号记录:在图表上放置箭头以标记买入或卖出信号。EA会记录这些点周围的集成指标值(RSI、CCI、DeMarker、WPR)。
自动箭头放置:使用 ZigZag 指标在价格极值处自动放置箭头,参数可配置(深度、偏差、最小长度)。
交易模式:支持仅买入、仅卖出或双向模式。支持在亏损后通过马丁格尔倍增手数,以及网格交易模式(订单间可设暂停)。
风险管理:固定手数、基于风险百分比的手数计算、止损、止盈,以及基于账户权益的平仓。
趋势过滤器:MACD 用于过滤交易(仅当 MACD > 0 时买入,当 MACD < 0 时卖出)。
控制面板:便捷的面板用于设置信号、保存和替换信号。 工作方式 将EA附加到图表。 使用面板手动放置箭头,或启用自动放置(默认启用“Direction of Automatic Arrows”功能)。 将信号保存到文件。 在策略测试器中使用保存的信号优化参数。

The Color Candles Indicator uses custom colors to highlight candles that follow the main market trend, based on the Moving Average. This simplifies the analysis of price movements, making it clearer and more direct. When the price is above the rising Moving Average, candles are highlighted indicating a BUY opportunity. When the price is below the declining Moving Average, candles are highlighted indicating a SELL opportunity.
Input Parameters : Period Method Applied Price
The moving averages
FREE

无废话外汇方法的交易小组 提高交易速度,同时保持图表整洁
特征: - 头寸规模: 点击买入/卖出时,此工具会打开 2 笔交易,手数最接近您的风险(每笔交易中使用的余额百分比)。忘记计算点值!
-SL 和 TP: 每笔交易以 1.5*ATR 的止损开仓,两半中的一个以 1*ATR 的止盈。如果剩下不到 4 小时来完成每日蜡烛,则使用的 ATR 值将是当前蜡烛之一,如果没有,则使用前一个蜡烛值。
-更新止损: 将止损设置为盈亏平衡或按照 NNFX 的规则更新您的追踪止损(在价格移动 2*ATR 后,止损为 1.5*ATR)。 - 平仓: 如果您收到退出信号,只需单击一下即可平仓所有买入或卖出
其他注意事项: -该程序不会干扰其他专家打开的交易或手动打开的交易。既不关闭也不修改其他符号的交易。 - 建议所有与您账户货币的交叉货币对在市场观察中可见(计算头寸规模时需要它们)。 - 此面板在 D1 图表中效果最佳
FREE

The Official Automated Version of the Reliable Indicator PipFinite Breakout EDGE EA Breakout EDGE takes the signal of PipFinite Breakout EDGE indicator and manages the trade for you.
Because of numerous financial instruments to consider, many traders want the signals to be fully automated.
The EA will make sure all your trades are executed from entry to exit. Saving you time and effort while maximizing your profits.
The Edge of Automation
Effortless price action trading is now possible acros
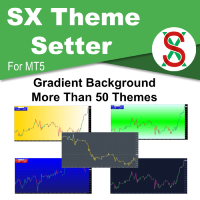
SX Theme Setter is intended for changing chart appearance in 2 modes: - Gradient background mode:
In this mode, the indicator creates a gradient background for your chart. Colors, steps and gradient type can be selected by user. - Color theme:
Color theme mode provides more than 50 built-in different color themes which can be selected from a list. Most of these themes are converted from official color themes of real trading platforms of the past and present. Try them out and see if they suit
FREE

Volume Gives Depth To Price Action! Volume Critical can accurately locate the cheapest areas to place trades. Enter reversals as early as possible to get the best Risk Reward setups!
Features Aggressive algorithm that anticipates reversals Volume Classifications Gray Histograms - Normal Volume, average market activity Orange Histogram - Trending Volume, increased market activity Pink Histograms - Overbought Volume, we can wait for further confirmation to sell Blue Histograms - Oversold Conditio

Murderbot - Smart Money Breakout Automated breakout trading system designed for swing trading on GBPUSD H1 timeframe. This EA monitors price action around pivot points and enters positions when breakout conditions are confirmed with volatility filters. Core Trading Logic The EA identifies swing highs and swing lows using configurable lookback periods, then monitors price for breakouts beyond these levels. Entry signals require price movement exceeding the pivot level plus a confirmable thresh
FREE

LogVar 指标是一种专门用于计算并显示 价格对数变化率 的专业分析工具。与传统的线性百分比变化不同,对数变化能更真实地反映价格波动的强度与方向,尤其在高波动或长期趋势分析中更具稳定性与可比性。 该指标通过比较当前收盘价与 n 个周期前的收盘价(由参数 iPeriod 定义)来计算变化值,并在放大的对数刻度上绘制出来,使趋势的微小变化也能清晰呈现。 线条颜色根据价格方向自动变化: 绿色: 当前价格高于参考值,表示上涨趋势; 红色: 当前价格低于参考值,表示下跌趋势。 中心的 0 线 表示中性区域,直观地区分价格变化的正负方向。 主要特性: 精确测量 真实的对数变化率 ; 自动调整刻度比例,增强视觉可读性; 动态颜色变化,清晰区分市场方向; 中心零线,提供直观趋势基准; 轻量快速,适用于所有交易品种和周期。 推荐用途:
适用于识别 趋势反转 、测量 波动强度 、过滤虚假信号或作为 量化交易系统的基础组件 。在算法交易、量化研究及自动化系统中表现尤为出色。
FREE
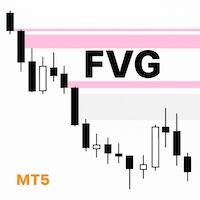
What Makes UTurn FVG indicator Unique I’m a trader, and I built a simple and clean FVG indicator that focuses on what traders actually need. Flexible color and transparency settings. The option to extend unmitigated and partially mitigated FVGs to the current price. Automatic removal of fully mitigated FVGs. Clear visual confirmation when an FVG has already been tested. A clean, professional look that helps traders make faster, more confident decisions. Overview UTurn FVG is a clean, efficient,
FREE
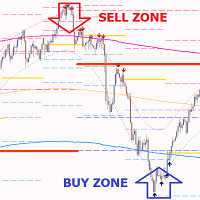
Gold PL MTF - 這是一項優秀的股票技術指標。指標演算法分析資產價格的走勢,並使用斐波那契方法(黃金分割)自動反映指定時間範圍(TF)的重要樞軸水準。
此指標完美地描述所選時間範圍(日、週、月、年)的價格軌跡,確定趨勢的開始和修正的開始,並可能發展為相反的趨勢。
此指標也顯示不同時間範圍內目前未使用的樞軸水平,作為價格磁鐵。這使得您能夠快速評估市場狀況並做出進入和/或退出交易的決定。每筆交易的潛力平均為50至1000點。
此指標可讓您評估不同時間範圍內價格變動的可能方向,並顯示最可能的目標和價格變動的潛力。
指標的優點: 1. 指標產生高精度訊號。 2. 樞軸水平不會消失,也不會重新繪製。只有當趨勢強勁時,FP 緩衝區的確認箭頭訊號才能重建。 3.您可以在任何經紀商的MetaTrader 5交易平台上進行交易。 4. 您可以交易任何資產(貨幣、金屬、加密貨幣、股票、指數等)。 5. 建議中長期交易的時間範圍為 H1-H4。 6. 可以在指標設定中更改單獨的參數(TF,顏色等),以便每個交易者可以輕鬆地為自己自訂指標。 7. 此指標可作為您交易系統的優秀主要補充,也可

The Vix_Fix indicator, or "Vix Fix," is a tool designed to identify potential market bottoms. It operates on the principle of measuring extreme fear or pessimism among the crowd, which are moments when the market often has a high probability of reversing to the upside. Main Purpose: To help traders find high-probability BUY (Long) entry points by identifying when the market is "oversold." How it Works In simple terms, the Vix Fix measures the distance between the current bar's Low and the Highes
FREE

The indicator shows the current timeframe and symbol name. It is also possible to turn on the indication of time until the end of the current bar. In the settings, you can specify: - the location of the indicator in relation to the terminal window, top left, top right, bottom left and bottom right - a row of text display arrangements so that the inscriptions do not overlap each other - color - font - font size.
FREE
MetaTrader市场是独有的自动交易和技术指标商店。
阅读MQL5.community用户备忘更多地了解我们提供给交易者的独特的服务:复制交易信号,自由职业者开发的自定义应用程序,通过支付系统完成的自动付款和MQL5云网络。
您错过了交易机会:
- 免费交易应用程序
- 8,000+信号可供复制
- 探索金融市场的经济新闻
注册
登录