Guarda i video tutorial del Market su YouTube
Come acquistare un Robot di Trading o un indicatore
Esegui il tuo EA
hosting virtuale
hosting virtuale
Prova un indicatore/robot di trading prima di acquistarlo
Vuoi guadagnare nel Market?
Come presentare un prodotto per venderlo con successo
Expert Advisors e Indicatori per MetaTrader 5 - 54

This is a simple utility which will put Automatic Stop Loss and Take Profit. It also has Trailing Stop Loss and Break Even features. The input value of the Stop Loss and Take Profit is in Pips. Whenever you open a trade it will put stop loss and take profit in pips automatically. *If you need a more practical stop loss and take profit for your trades then you may like this ATR based stop loss utility, Here!
Inputs: 1. SL and Trailing SL - This is the Stop Loss value in Pips. Also used as Trai

"Notifiche di negoziazione" è uno strumento di utilità, mirato a informarti tramite notifiche mobili o avvisi sul terminale su ogni operazione aperta o chiusa, nonché sul risultato di profitto/perdita in $ di ciascuna operazione. È uno strumento che utilizzo da molto tempo e ho deciso di condividerlo gratuitamente!
Parametri di input: (ogni input è di tipo vero/falso , fare doppio clic su di esso per modificarne il valore) Notifica per posizioni chiuse PnL : se vero, ti avviserà
FREE

In the world of finance, correlation is a statistical measure of how two securities move in relation to each other. Correlations are used in advanced portfolio management. This indicator measures how different securities move in relation to a reference one, thus making portfolio management easier. [ Installation Guide | Update Guide | Troubleshooting | FAQ | All Products ] Avoid concurrent trades in highly correlated instruments Find trading opportunities among highly correlated instruments Cor
FREE

Take control of your operations efficiently at trading, mannaging by an smart way the risk of your positions. Whit this tools, you can:
Estimate the potencial profits or losses from your operations, either in money or pips. You also can visualize profits or losses by substracting the spread cost previusly configured in the tool’s input parameters. Calculate the lot size or margin required for your orders. Estimate the risk/reward ratios of your positions. Study the negative impact of the spread

Volume Horizon is a horizontal volume indicator that allows you to observe the density of market participants' volumes across various price and time intervals. Volume histograms can be constructed based on ascending or descending market waves, as well as individual bars. This tool enables more precise determination of entry or exit points, relying on levels of maximum volumes or volume-weighted average prices (VWAP).
What makes Volume Horizon unique? 1. Segmentation into ascending and descendi
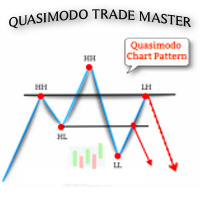
Quasimodo Trade Master EA: Unlock the Power of the Quasimodo Chart Pattern The Quasimodo Chart Pattern is a hidden gem in the world of trading. Also known as a Change of Character (ChoCh) or QML , this pattern has earned its reputation as one of the most reliable and accurate setups you can find. If you’re an ICT or SMC trader, you’re likely already familiar with its potential. But here’s the catch: spotting the Quasimodo pattern manually can be time-consuming and mentally draining. That’s wher

Ottimo strumento di utilità dove puoi monitorare in tempo reale il Laverage del tuo conto e lo spread del simbolo Questo saprà identificare con precisione i dati, poter sapere ad esempio se hai un conto Prop Firm, conoscere il corretto Laverage e se lo spread è manipolato, ecc.
Combinazione di leva finanziaria e indicatore di spread. Strumenti per automatizzare il controllo della leva e dello spread sul tuo conto di trading. Lavorare in tutte le azioni di broker forex. Utile per monitorare, se
FREE

FusionAlert StochRSI Master is an indicator available for MT4/MT5 platforms, it is a combination of RSI & Stochastic indicator which provide "alerts" when the market is inside "overbought and oversold" regions combined for both indicators, results in more precise and accurate signals to be used as a wonderful tool, in the form of "buy or sell" signals. This indicator comes with many customization options mentioned in the parameter section below, user can customise these parameters as needful. Jo
FREE

Please contact me for the original version. (The original will be sent from my EA Telegram account.)
Hedge Martingale EA. Works only on the MT4 platform. It works on all pairs, but the most ideal symbol is XAUUSD. Recommended broker and account type: Exness Cent account. It is recommended to use it with a minimum balance of $1,000. It provides approximately 40-80% monthly profit. Hedging is more secure. The screenshots are of Exness Cent Real account transactions, not backtest results. I can s

Our EA harnesses the power of the SilverBullet 5-minute strategy, offering optimal performance while also allowing users the flexibility to explore and backtest various timeframes of their choice.
Ideal for indices such as SPX500 and NAS100 , it performs optimally during trading hours at 15:00 UTC or 19:00 UTC . Here's what sets it apart: Versatile Execution: Choose between pending orders on the FVG, market execution upon FVG occurrence, or a combination of both. Custom Risk Management:

This indicator identifies and highlights market inefficiencies, known as Fair Value Gaps (FVG), on price charts. Using a custom algorithm, the indicator detects these areas of imbalance where the price moves sharply, creating potential trading opportunities. Indicator Parameters: Bullish FVG Color (clrBlue) : Color used to highlight bullish inefficiencies. The default value is blue. Bearish FVG Color (clrRed) : Color used to highlight bearish inefficiencies. The default value is red. Bullish FVG
FREE
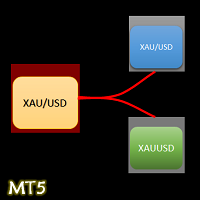
- The Symbol Changer Utility for MetaTrader is a tool that enables traders to switch between various symbols on the MetaTrader trading platform easily and quickly. - It is designed to change the symbol of the current and all open chart windows and the timeframe of the current chart window (by clicking the button). - The tool retrieves symbols from the Market Watch, displaying only the necessary symbols in the market watch.
FREE

The Smart Liquidity Profile is color-coded based on the importance of the traded activity at specific price levels, allowing traders to identify significant price levels such as support and resistance levels, supply and demand zones, liquidity gaps, consolidation zones, Buy-Side/Sell-Side Liquidity and so on. Smart Liquidity Profile allows users to choose from a number of different time periods including 'Auto,' 'Fixed Range,' 'Swing High,' 'Swing Low,' 'Session,' 'Day,' 'Week,' 'Month,' 'Quart

The indicator IQuantum shows trading signals for 10 symbols in the daily chart: AUDCAD, AUDUSD, EURUSD, GBPCAD, GBPCHF, GBPUSD, NZDUSD, USDCAD, USDCHF, and USDJPY.
Signals of the indicator are produced by 2 neural models which were trained independently from one another. The inputs for the neural models are normalised prices of the symbols, as well as prices of Gold, Silver and markers of the current day.
Each neural model was trained in 2 ways. The Ultimate mode is an overfitted neural model
FREE
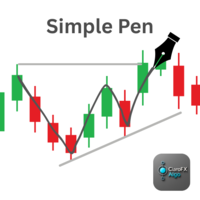
ClaroFxAlgo - Simple Pen v1.00 Free-Hand Drawing Tool for MetaTrader 5 Overview:
ClaroFxAlgo - Simple Pen is a lightweight and intuitive tool that allows traders to draw directly on the MT5 chart using just mouse movements. Designed to enhance visual analysis, this tool makes it easy to sketch trends, highlight zones, or mark chart behavior on-the-fly. Key Features: Draw on chart by simply holding Ctrl and moving the mouse — no clicks required Customizable drawing settings:
• Drawing col
FREE

Gold Gecko EA is a fully automated expert advisor that uses various default metatrader indicators. This forex robot uses fixed take profit and stop loss, and every entry position has its own algorithm. This EA works on all timeframes and all pairs, but it is specifically designed for Gold H1 timeframe.
Main Features: No Grid. No Martingale. No Averaging. Setting Parameters: Expert Name - EA name and trades comment. Magic Number - EA identification number to identify trades, and mu

Intraprendi un viaggio alla scoperta di una strategia senza eguali: "Supporti e MACD". Realizzata con meticolosità per USD/CHF su un intervallo di tempo di un'ora, questa strategia intelligente sfrutta il potenziale di supporti solidi e l'affidabilità incontestabile degli indicatori MACD. Sebbene il numero di trade eseguiti sono limitati, ciascun trade è eccezionale nel suo impatto e potenziale.
Gratuito fino al prossimo aggiornamento.
Per qualsiasi informazione contattami.
FREE

Indicator that uses ATR and standard deviation to calculate the current trend. It has the top and bottom line. The top line is shown when it is high, and the bottom line when it is low. The indicator does not draw a trend line or show the trend for the day, or for a certain period. It has the function of indicating the current trend, and may indicate a reversal.
use it with caution and at your own risk.
FREE

ICT Gold Sweeper EA
ICT Gold Sweeper EA is an automated trading system designed based on the institutional Suspension Block concept. The system focuses on identifying specific 3-candle patterns and executing trades with defined algorithmic rules.
Key Strategy
The core logic relies on timeframe alignment. The EA executes trades when a Setup Timeframe aligns with a Higher Timeframe structure. This filtering mechanism is intended to identify high-probability setups by ignoring lower-quality sig

FX-R1 Ensemble is a probabilistic framework designed to identify and exploit structural asymmetries in the FX market. Originally developed and trained on AUDCAD , the structure generalizes consistently across correlated instruments. Each model focuses on specific statistical properties of price behavior, volatility clustering, directional persistence, mean reversion, contributing to a unified decision process. FX-R1 does not rely on artificial intelligence. Its foundation lies in probability the

Order block hunter indicator is the best indicator for hunt the order blocks that area where there has been a large concentration of limit orders waiting to be executed Order blocks are identified on a chart by observing previous price action and looking for areas where the price experienced significant movement or sudden changes in direction .This indicator does that for you by using very complicated codes and helps you to take the best areas To buy and sell because it make marks at the best a

Direct Scalping shows the most SUPER SUPER SUPER EARLY opportunity to scalp the market. Do entry as early as possible, as soon as the first sign appears.
It plays sound alert so that you can wait the moment while doing something else.
Remember to cut loss below the '' area. Yes, it is not stop loss but cut loss (exit on candle close). Made for M1 timeframe, but higher is good too.
My new favorite setup: M3 using 8 indicators with different parameters: 11, 18, 25, 32, 39, 46, 53, and 60.
Combin

Our team - @Supremacy_Lab - are glad to introduce our first product - EA_Supremacy_NT - a unique technical solution for day trading, scalping, and trend following.
EA_Supremacy_NT is a non-trading version of our core automated advisor, that will be released later. It is a truly innovative product that is based on an unconventional approach to market data processing. The underlying algorithm allows traders to reap the maximum possible profit from short-term price movements. The system uses a si

ONLY 5 COPIES OUT OF 5 LEFT AT $99, NEXT PRICE $149
This EA uses a smart grid system with EMA for trend filtering, and RSI + CCI to confirm entry signals. Designed for adaptive and efficient trading in trending markets.
Feel free to DM me if you'd like to check my Myfxbook.
Recommended
Symbol: XAUUSD
Timefirm: m5
Account: Cent/STD
Minimum Balance: 30000USC/30000USD
Recommend a raw spread broker (interstellar,IC Market,Exness)
Input Setting digit_gold : Set the number of digits for gold symb

Carry Master EA: Unleashing the Power of Carry Trades in the Gold Market Introducing Carry Master EA, the revolutionary Expert Advisor designed specifically for executing carry trade strategies in the gold market. Whether you're a seasoned trader or new to the world of forex and commodities, Carry Master EA provides a reliable and profitable solution for capitalizing on interest rate differentials with gold.
How to install:
The EA must be attached to ONLY one XAUUSD-M5 chart. Recommed broker:I

Event Horizon Trader - это передовой автоматический торговый робот, построенный на инновационной гибридной архитектуре. Он объединяет квантовые принципы, искусственный интеллект и многоуровневую систему управления рисками для адаптивной торговли на финансовых рынках. Советник разработан для работы в изменчивых рыночных условиях, динамически подстраиваясь под трендовые, флэтовые и высоковолатильные периоды. Советник имеет тестовую настройку для пары: XAUUSD Ключевые компоненты системы: 1. Квант
FREE
Running recommendations
Recommended currency pairs: XAUUSD, gold
Time cycle: H4
Operating capital: recommended above $1000
Account type: No special requirements, better effect of low difference
Levers: No special requirements
matters needing attention
EA has a maximum of 6 entry points per day, with a minimum of 0.01 trades per transaction (manual modification is sufficient).
The default parameter is the gold variety.
Suggest using funds above $1000 to enhance risk resistance.
Ther

SMART MONEY SCALPER EA - ICT Scalping Strategy Description INTRODUCTION - WHY THIS ICT SCALPING EA IS ESSENTIAL FOR YOUR SUCCESS Dominate the markets with the most advanced ICT scalping system ever created. The Smart Money Scalper EA is specifically engineered for high-frequency ICT scalping, combining Inner Circle Trader concepts with lightning-fast execution to capture multiple quality trades throughout each trading session. This specialized scalping EA transforms ICT methodology into a pr
FREE
Dynamic Supply and Demand indicator automatically identifies and displays Supply and Demand Zones on your chart based on price action patterns and market structure. These zones represent areas where institutional buying or selling pressure has historically occurred, making them key levels for potential price reactions. This form of indicator takes inspiration from ICT as well as traditional Support & Resistance formation. **For the first 50 candles (number depends on LookBackCandles) when indic
FREE

Grid EA Pro RSI is an professional Grid advisor works according to RSI ( Relative Strength Index ) indicators. And has the function of Reducing the Drawdown on the account by overlapping unprofitable orders. The chart displays information about the profit. - Use default setting for GBPUSD, GBPJPY timeframe H1/M5 - Recommend ECN broker with LOW SPREAD: IC Market , Exness, NordFX , FXPRIMUS , Alpari , FXTM - It good to combo with Buy Sell Signals to follow Trend and Sellect Buy Only/Sell Only f

Rover Pro EA is a fully automatic trading advisor which contains several trading systems mainly based on Moving Averages, Alligator, CCI, MACD, ADX, Stochastic Oscillator, Envelopes, Momentum, Standard Deviation, Bollinger Bands, Bull Power, WPR, DeMarker, Awesome Oscillator, and ATR. Each trading system has it own entry with fixed stop loss and take profit. This forex robot can be used for all pairs and all time frames, but it is especially designed for EURUSD 1H time frame.
Main Features:

The Candle Countdown Timer for MetaTrader 4 (also available for MT5) is a vital indicator designed to help you manage your trading time effectively. It keeps you updated about market open and close times by displaying the remaining time before the current candle closes and a new one forms. This powerful tool enables you to make well-informed trading decisions. Key Features: Asia Range: Comes with an option to extend the range. Broker Time, New York, London Time: Displays the current broker time
FREE

Professional Gold Trading EA - Advanced Algorithmic System Professionally engineered trading system designed specifically for XAUUSD and other Gold symbols. This EA has been developed using advanced quantitative methods that institutional traders rely on. Info
Timeframe: H1 (1-hour charts) Minimum Account Size: $1000 USD or equivalent cent account Usage Instructions Simple 3-step setup process: Load the EA to any XAUUSD H1 chart Set your preferred position sizing - either fixed lots or risk pe

Media mobile e RSI EA
Ti presentiamo Moving Average e RSI EA, il tuo compagno di trading definitivo progettato per sfruttare la potenza dell'analisi tecnica per prestazioni di trading ottimali nel mercato Forex.
Caratteristiche principali:
Incroci della media mobile doppia: L'EA utilizza due medie mobili per identificare le tendenze del mercato e generare segnali di acquisto o vendita. I crossover di queste medie mobili forniscono robusti indicatori di potenziali cambiamenti di direzione d
FREE

G-Labs Market Maker Dashboard - Exclusive Seasonal Offer Elevate your trading with the original G-Labs Market Maker Dashboard, available for a limited time at just $70 USD. Ideal for starter traders, this dashboard has been enhanced with new features and now includes a comprehensive training video. This indicator is for people trading the market makers method and is the entry level dashboard for that strategy is available for both mt4 and mt5. its a market scanner in real time showing peak forma
Introducing EMA + RSI – A Trading Indicator Combining Exponential Moving Average (EMA) and Relative Strength Index (RSI) Analysis. The indicator signals trade entries with arrows on the chart when two EMAs cross and the RSI meets the specified conditions.
It is initially optimized for the GBPUSD currency pair on the 1H timeframe, but users can customize it to fit their strategy. Key Features: Flexible settings: Users can adjust EMA length, choose the price for calculation, and configure RSI para
FREE

Dynamic CMF Calculation: Customize the period for the Chaikin Money Flow (CMF) to fine-tune your analysis and maximize signal precision. Intuitive Color-Coded Alerts: Instantly interpret market conditions with clear visual cues: Green Alert: Indicates the Overbought zone – signaling a potential selling opportunity. Red Alert: Indicates the Oversold zone – suggesting a potential buying opportunity. Gray Alert: Represents the Neutral zone – a signal to wait for a confirmed trend or reversal. Autom

Quant Panel Pro The Ultimate Multi-EA Performance Dashboard for Quantitative Traders Stop juggling multiple charts or external tools to monitor your algorithmic strategies! Quant Panel Pro delivers institutional-grade portfolio monitoring in one sleek, professional interface.
Key Features Quantitative Analytics at Your Fingertips Real-time P&L aggregation across all Expert Advisors Statistical win rate analysis with trade frequency metrics Advanced drawdown tracking (realized & unrealized

It predicts the most likely short-term price movement based on advanced mathematical calculations.
Features Estimation of immediate price movement; Calculation of the real market trend; Calculation of the most important support and resistance levels; Algorithms optimized for making complex mathematical calculations with a minimal drain of system resources; Self-adjusting for better performance, so it’s able to work properly at any symbol (no matter how exotic it is) and any timeframe; Compatibl
FREE

Super Trend Plus L'indicatore descritto è un sistema di trading che utilizza quattro Supertrend settati con diversi parametri. L'idea alla base di questo sistema è che quando tre Supertrend si muovono nella stessa direzione, si ha una forte conferma del trend, ma l'ingresso avviene solo quando anche il quarto Supertrend si muove nella stessa direzione degli altri tre. Ad esempio, si potrebbe utilizzare il primo Supertrend con un coefficiente moltiplicatore della volatilità di 3 e un periodo d

Brent MACD Bollinger Breakout (H1) is a fully automated MetaTrader strategy designed to capture clean breakout moves on Brent (Crude Oil) using a momentum-confirmed, rule-based execution model. The EA was tested on Brent on the H1 timeframe from December 8, 2017 to August 22, 2025. No parameter setup is required — the system is delivered with optimized and fine-tuned settings.
Recommended broker: RoboForex (EET timezone).
StrategyQuant source code is available here: https://quantmonitor.net/
FREE
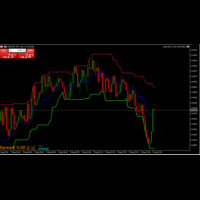
The Donchian Channel Indicator I created is a powerful tool for analyzing price trends and volatility. By plotting the highest high and lowest low over a specified period, it helps identify potential breakout opportunities and trend reversals. This indicator is valuable for traders seeking to understand market dynamics and make informed decisions based on price movements. Its simplicity and effectiveness make it an essential addition to any trading strategy.
FREE

The Forex Master Pattern is an alternative form of technical analysis that provides a framework which will help you to find and follow the hidden price pattern that reveals the true intentions of financial markets. This algorithm here does a good job detecting the Phase 1 of the Forex Master Pattern cycle, which is the contraction point (or Value).
On Phase 2 we get higher timeframe activation (also called Expansion), which is where price oscillates above and below the average price defined

The Price Action Finder indicator is an indicator of entry points, which is designed to search and display patterns of the Price Action system on a price chart. The indicator is equipped with a system of trend filters, as well as a system of alerts and push notifications. Manual (Be sure to read before purchasing) | Version for MT4 Advantages
1. Patterns: Pin bar, Outside bar, Inside bar, PPR, Power bar, Hanging man, Inverted hammer 2. Pattern filtering system. Removes countertrend patterns from

Demand and supply zones Support and Resistance areas Show broken zones Show tested and untested zones Show weak zones Fractal factors Notifications when price reaches point of Interest with Push notifications and pop ups Customizable History Clickable Works on all Timeframes Works on all pairs.
Free for a while till further notice and changes. The demand and supply bot coming soon
FREE

Introduction to Fractal Moving Average Fractal Moving Average indicator was designed as part of Fractal Pattern Scanner. Inside Fractal Pattern Scanner, Fractal Moving Average Indicator was implemented as multiple of chart objects. With over thousands of chart object, we find that it was not the best and efficient ways to operate the indicator. It was computationally too heavy for the indicator. Hence, we decide to implement the indicator version of Fractal Moving Average indicator to benefit ou
FREE

The EA uses a scalping strategy on a breakout, uses innovative advanced technologies using a Neural Network. To create the EA , we used the latest advanced algorithms to find the best moments to enter the market. The EA uses many smart filters to adapt to almost any economic situation. The EA sets a protective stop order, so the trader does not have to worry that the robot will allow significant drawdowns. The adviser is safe and does not require any settings from the user, just install it on th

Price and Spread Indicator
Version: 1.0 Developer: Creative Tech Solutions Website: https://www.creativetechsolutions.co.uk
Overview The Price and Spread Indicator is a great tool for MetaTrader 5 that displays the Ask and Bid prices along with the spread directly on the chart. This indicator provides real-time updates and allows traders to make informed decisions based on accurate price information.
Features - Real-time Price Updates: Continuously updates Ask and Bid prices. - Spread Disp
FREE

This all-in-one indicator displays real-time market structure (internal & swing BOS / CHoCH), order blocks, premium & discount zones, equal highs & lows, and much more...allowing traders to automatically mark up their charts with widely used price action methodologies. Following the release of our Fair Value Gap script, we received numerous requests from our community to release more features in the same category. "Smart Money Concepts" (SMC) is a fairly new yet widely used term amongst price a

This universal Expert Advisor is equally good for both scalping and conservative multi-currency trading of simultaneous trading of several pairs. This Expert Advisor is based on its own Algorithm, which is an incredibly effective tool due to the simultaneous operation of a trading strategy based on our Centered Bands Indicator and our proprietary signal filter system together with the Martingale method, which together work out a very interesting hedging system. Traders are also given the
If you like this product, please give it a 5 star rating as a token of appreciation.
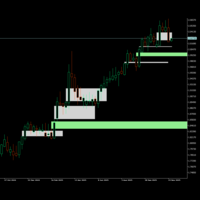
This indicator identifies and displays Fair Value Gaps (FVG) on price charts.
Fair Value Gaps are price zones where there's a significant imbalance between buying and selling pressure, creating "gaps" in price action. The indicator detects two types and when they are mitigated(touched):
Bullish FVG: When a candle's low is above the high of a candle two periods earlier.
Bearish FVG: When a candle's high is bel
FREE
Developed by smart2trader.com
The Didi Index Nuvem Indicator is an indicator based on the original Didi Aguiar (Didi Index) indicator, featuring two visualization methods for the moving averages: as a cloud or as lines (original). This customization offers a new way to visualize the moving average crossovers in the Didi Index indicator. About the Didi Index Indicator The Didi Index Indicator , created by Brazilian trader Didi Aguiar, is a technical analysis tool based on the crossover of three
FREE
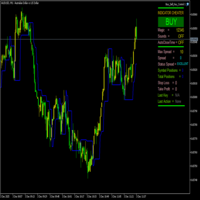
FractalBreakoutLevels Panoramica:
Questo indicatore traccia livelli di prezzo dinamici basati sull'analisi dei movimenti di prezzo. Combina dati di prezzo storici per identificare livelli chiave che possono servire come riferimento per il trading. Funzionamento:
L'indicatore analizza la struttura del mercato esaminando la relazione tra i dati di prezzo attuali e storici. Disegna una linea continua che si adatta alle mutevoli condizioni di mercato, fungendo da livello dinamico di supporto/resis
FREE
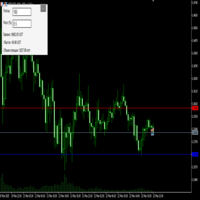
Преимущества и принцип работы индикатора "Risk end Lot Size Calculator" Преимущества : Простота использования :
Индикатор автоматически рассчитывает все необходимые параметры, вам нужно только ввести количество пипсов и риск.
Управление рисками :
Помогает определить, сколько вы можете потерять в сделке, и какой объем позиции (лот) выбрать, чтобы не превысить допустимый риск.
Визуализация :
На графике отображаются линии стоп-лосса для Buy и Sell, что позволяет быстро оценить уровни.
Удобство :
О
FREE

Want to AUTOMATE this strategy? We have released the fully automated Expert Advisor based on this logic. Check out Range Vector Fibo Logic EA here: https://www.mql5.com/en/market/product/158065
UPGRADE AVAILABLE: Tired of manual trading? I just released the Automated MTF Version with Mobile Alerts and Auto-Targets. Get the Pro Version here: https://www.mql5.com/en/market/product/159350 Range Vector Fibo Logic (Indicator) One Candle Strategy Stop waking up at 3 AM to draw lines manually. Range
FREE

No Demand No Supply This indicator identifies No Demand –No Supply candles to your chart and plots volume bars colored according to the signal. It can be applied to all timeframes or to a specific one only. It can also be used as regular volume indicator with exceptional future of WEIGHTED VOLUME. Furthermore is has an alert notification, sound and email when a signals occurs. The indicator does not repaint but the alert will come on two candles back due to the definition of No Demand No Su

BreakHarmony Multi-Timeframe Breakout Indicator for MT5
The BreakHarmony Multi-Timeframe Breakout Indicator for MT5 is a highly advanced tool providing information on breakout points across different timeframes, aiding traders in decision-making and understanding market movements. [ Features and Manual | MT4 version | All Products ] The indicator tracks breakout points on price charts across 6 timeframes. Breakout prices are indicated with the closing price of the correspondi
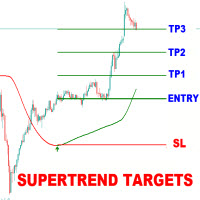
Supertrend Targets Signal is a powerful trend-following and breakout confirmation indicator designed to help traders identify high-probability entry points , visualize dynamic target zones , and receive clean, reliable signals across various market conditions. The core trend logic is built on a custom Supertrend that uses an ATR-based band structure with long smoothing chains—first through a WMA, then an EMA—allowing the trend line to respond to major shifts while ignoring noise. A key addition

Description. This product was created based on low investment EA,
EA "OPHEX" is an advanced system that exploits GOLD XAUUSD Only. I uses both Scalping and Hedging Strategy. Once the Scalping hits SL it converts the position into Hedging and recovers the loss.EA gives upto 10% return every month with low risk. We can increase initial lot size for more return while account grows.
Advantages. Get upto 10% Returns every month with very low risk; Much cheaper than similar alternatives; Operat
FREE

Klyro Offerta Limitata: 10 su 10 copie rimaste a questo prezzo (aumenterà a $499 nei futuri aggiornamenti).
Entra in una nuova era del trading automatizzato con Klyro —un EA progettato per interpretare le naturali “dinamiche di flusso” del mercato. Progettato per la precisione, questo sistema si concentra sulla lettura dei cambiamenti di momentum in tempo reale, rilevando le zone di esaurimento e eseguendo ingressi dove l'esaurimento di tendenza incontra la forza di inversione. È un approcci
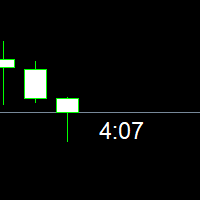
Contador de tempo que iniciará outro candle. Este indicador conta o tempo que falta para terminal um candle e iniciar outro, funciona em qualquer tempo gráfico. Em seus parametros de configurações permite alterar o tamanho e a cor da fonte da letra. Gratis para teste por 15 dias. Contador de tempo do candle. Permite alterar o tamanho e a cor da letra. Após baixar o contador de tempo de candle Flash arraste para o gráfico, configure o tamanho da fonte desejado e as cores preferidas.
FREE

A professional, multi-strategy EA built to master Bitcoin's volatility. Four EAs in one, optimized specifically for BTCUSD.
BTC Dominator is a sophisticated Expert Advisor designed from the ground up with one goal: to find and manage high-quality trading opportunities in the Bitcoin (BTCUSD) market. This is not a simple, single-indicator EA. BTC Dominator is a Quadruple-Strategy system, effectively combining four independent, proprietary trading models into one expert. Each model ana

AP Day-Week-Month High-Low overlay that draws the prior Day, Week, and Month highs/lows on any chart. Great for session planning, confluence, and alerting when price comes back to important swing levels. What it does Plots 6 lines: Day High/Low , Week High/Low , Month High/Low (from the previous completed sessions). Touch/near alerts when price reaches a selected line (with a user-set tolerance). Works on any symbol and timeframe. Zero external libraries. How to use Drop it on the chart you trad
FREE
Trend Hunter EA: Stop Guessing, Start Trend Following Are you tired of entering trades that look perfect, only to have the market reverse strongly against you? The most common reason for this is trading against the dominant, underlying trend. The Trend Hunter EA is meticulously engineered to solve this exact problem by ensuring you are always trading in harmony with the market's primary direction. The Professional Strategy: Power on the High Frame, Precision on the Low Frame The Trend Hunter EA
FREE

https://www.mql5.com/en/users/gedeegi/seller
The design features a bold orange countdown timer icon set against a dark gray background, with the clock hands pointing toward the upper right. Below the timer, a candlestick chart displays green and red bars that represent price movements across different time periods, with sharp detailing and balanced composition. The countdown time of "05:17" is prominently displayed next to the clock, adding a dynamic and informative element to the image.
FREE

Excellent tracking performance and minimal noise! This trend detection indicator that avoids whipsaws and uncertain market noise and is also agile enough to react to changes in trend.
It is also designed to adapt to dynamic markets.
Functions mainly as a filter to help you trade in the direction of the trend.
Features.
Simple and easy to use. Low load and easy to try out The excellent tracking performance and smooth lines that make it ideal for market analysis Can be used as a trend filter for
FREE

This indicator has been developed to identify and display these trends quickly and easily, allowing you to see instantly, those currency pairs which are trending, and those which are not – and in all timeframes, with just one click. The 28 currency pairs are displayed as a fan as they sweep from strong to weak and back again, and this is why we call it the ‘currency array’. All 28 pairs are arrayed before you, giving an instant visual description of those pairs that are trending strongly, those

Strict Risk Management (SRM) EA v1.192 – Demo Version (MT5) Strict Risk Management (SRM) EA v1.192 is a professional-grade MT5 Expert Advisor designed for structured and disciplined Forex trading . The EA is based on Break of Structure (BoS) market logic and integrates ATR-based adaptive risk management to dynamically adjust to changing market conditions. The EA automatically calculates Stop Loss , Take Profit , and Risk-to-Reward ratios based on current volatility.
FREE

INDEX MAGIC PRO - Simple Strategy for NAS100 Trading monitor here: tinyurl.com/3zezmn3h
( copy and past in the url ) Hey traders! I want to be completely honest about what this EA does and doesn't do. What This EA Actually Is: This is a simple trading system I built for index trading, mainly the NASDAQ 100. It looks for strong momentum candles (candles with small wicks) and trades around the key levels of these candles using two basic approaches: Rejection Strategy - Waits for price to come back

The Quantum VPOC indicator has been developed to expand the two dimensional study of volume and price, to a three dimensional one which embraces time. The volume/price/time relationship then provides real insight to the inner workings of the market and the heartbeat of sentiment and risk which drives the price action accordingly. The Quantum VPOC indicator displays several key pieces of information on the chart as follows: Volume Profile - this appears as a histogram of volume on the vertical pr
Il MetaTrader Market è il posto migliore per vendere robot di trading e indicatori tecnici.
Basta solo sviluppare un'applicazione per la piattaforma MetaTrader con un design accattivante e una buona descrizione. Ti spiegheremo come pubblicare il tuo prodotto sul Market per metterlo a disposizione di milioni di utenti MetaTrader.
Ti stai perdendo delle opportunità di trading:
- App di trading gratuite
- Oltre 8.000 segnali per il copy trading
- Notizie economiche per esplorare i mercati finanziari
Registrazione
Accedi
Se non hai un account, registrati
Consenti l'uso dei cookie per accedere al sito MQL5.com.
Abilita le impostazioni necessarie nel browser, altrimenti non sarà possibile accedere.