YouTubeにあるマーケットチュートリアルビデオをご覧ください
ロボットや指標を購入する
仮想ホスティングで
EAを実行
EAを実行
ロボットや指標を購入前にテストする
マーケットで収入を得る
販売のためにプロダクトをプレゼンテーションする方法
MetaTrader 4のための無料のエキスパートアドバイザーとインディケータ - 3

説明。
プロップ・ファームのチャレンジと評価フェーズは終わった、次は何をするのか - 多くのトレーダーが私に尋ねます。 正直に言うと、これは最終的に実際のお金を稼ぐプロセスの中で最も簡単な部分でした。 HFT Phase 2 EAは最も難しい部分を実行し、プロップファームが設定したルールに違反することなく設定された目標を達成できるように設計されています。 現在、最適化と微調整の過程にありますが、それは簡単ではなく、時間がかかる可能性があり、人工知能 (AI) の使用が必要になる可能性があることは否定しません。
現在、 Phase 2 の最適化が進行中ですが、EA は「マーケット」に無料で配置されます。 複数の顧客のリクエストに応じて、 EA が特定のプロップ ファーム チャレンジに合格できるかどうかを決定する "Prop Firm Challenge difficult/easy Test" オプションも HFT Phase 2 EA に追加されました。
パラメーター。
" Magic " - 取引ポジションの識別子。 " Trade Method " - 取引方法の選択
FREE

Enter For Me S is another variation of the original Enter For Me. This 1 has been designed for people who are not good with Technical analysis. It will take less trades with a higher accuracy than the original. Do not use it on a consolidating market. The EA will monitor the market for you and take trades with a stop loss only when opportunities present themselves. You have to close winning trades yourself when satisfied with profits or set the TP yourself. This EA has been uploaded for the s
FREE

Moving Average Convergence Divergence(MACD)トレーディング戦略は、勢いとトレンドの方向の変化を特定するために使用される人気のあるテクニカル分析ツールです。 MACDは、26期間の指数移動平均(EMA)から12期間のEMAを引いて計算されます。 MACDの上には、トリガーとして機能する9期間のEMAである「シグナルライン」がプロットされます。 MACDラインがシグナルラインの上にある場合、MACDはブルッシュ領域と見なされ、下にある場合はベア領域と見なされます。トレーダーはこの情報を使用して、潜在的な買いと売りの機会を特定することがよくあります。 MACDは多目的な指標であり、さまざまな方法で使用できます。一般的な使用方法のいくつかは次のとおりです。 クロスオーバー:MACDラインがシグナルラインを上回るときにはブルッシュクロスオーバーが発生し、MACDラインがシグナルラインを下回るときにはベアクロスオーバーが発生します。 ダイバージェンス:MACDが新しい高値をつけている間に基礎となるセキュリティがそうでない場合、ブルッシュダイバージェンスが発
FREE

VirtualDealer」EA: 仮想オーダー管理機能を搭載した多機能&自動化トレードソリューション FXトレーダーの皆さん、待望のEA「VirtualDealer」の最新バージョン1.1がリリースされました!このEAは、日々のトレードを自動化し、優れた利益を目指します。使いやすさと強力なトレード戦略を組み合わせ、どのレベルのトレーダーにも最適です。 主な特徴: 多様な時間枠対応 :お好みの時間枠を設定可能(デフォルトは60分) スリッページ管理機能 :市場の変動に強く、スリッページを最小限に抑えます マジックナンバー :複数の戦略を同時に管理 高度な注文管理 :仮想取引とリアル取引をスマートに切り替え、市場の状況に基づき最適な判断を行います。仮想の買い・売りオーダーを管理し、市場条件に基づいて実際の取引に移行する機能も搭載。 ダイナミックなリスク管理 :利益確保と損切りを自動で調整、資金管理を徹底 可視化ツール :トレードの視覚化をサポートし、戦略を直感的に把握 移動平均線を利用したトレンド判断 :短期及び長期の移動平均線を利用して市場トレンドを把握 「VirtualDealer」
FREE

The Candle Timer indicator displays an advanced bar countdown timer on a chart. This study indicates the remaining time for the last candle in the chart.
Main features The indicator shows the remaining time for the last bar in the chart. Alert notifications for new bar. Works on every timeframe (M1, M5, M15, M30, H1, H4, D1, W1, MN). Customizable parameters (Colors, Text size, Visibility...). Ideal tool for all kinds of trading (Scalpers, intraday traders...). Very fast calculation. Avail
FREE

大手機関が取引している場所を発見し、MetaTrader 4の無料のアンカーVWAPインジケーターで投資を最適化しましょう。 当社の無料のアンカーVWAPインジケーターを使用して、大手機関が取引している価格を発見してください。これにより、市場のトップやボトムにVWAPをアンカーすることを自動化することで、貴重な時間を節約できます。当社の無料版では、マウスポインターの移動に追従してVWAPをリアルタイムで簡単に表示できます。これにより、価格がVWAPに対してどこにあるかを瞬時に把握し、投資の意思決定をより良く行えます。 そしてこれだけではありません!有料版には、マウスクリックひとつでVWAPを特定のチャートのポイントに固定する機能など、追加の機能が含まれています。これにより、市場のトップやボトムにVWAPをアンカーすることがより簡単になります。また、テクニカル分析のプライスアクションを使用して、自動的にチャートのトップやボトムを見つけるのに役立つ無料のインジケーターもあります。 時間を無駄にしないでください! Sweet VWAP Aux を使って取引を次のレベルに引き上げましょう。私た
FREE
ろうそくの終わりまでの時間の指標。ろうそくの終わりまでの時間とサーバー時間を表示します。テキストはろうそくの傾向または方向を表示でき、サウンド通知が組み込まれています 特徴:
現在のろうそくの終わりまでの時間と、必要に応じて調整または無効にできる他の時間枠を表示します AWキャンドルタイムは、AWスーパートレンドインジケーターで現在のキャンドルまたはトレンドの方向を選択できます トレンド戦略は選択した色で強調表示されます ろうそく交換前の音通知と追加彩色を内蔵 表示は、現在の価格の横またはチャートの隅に設定でき、入力設定で柔軟に調整できます Instruction -> ここ / その他の製品 -> ここ 入力変数:
主要 Candle_Time_Location - ローソクのタイムスタンプの場所。チャートの隅または現在の価格の隣に配置できます Trend_Strategy - 色付きのろうそくのタイムスタンプを使用します。 AW SuperTrend インジケーターを使用して、トレンドの方向に色を付けることができます。現在のろうそくの方向に応じて色を付けることができ
FREE
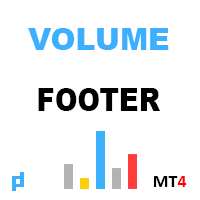
インジケータは、垂直方向の音量を示しています。 設定では、高と極を決定するための2つの係数、および低ボリュームを決定するための1があります。 同様のアルゴリズムが指標 UDP1 Volume Pixel でも使用されます。 指定されたボリュームが検出されると、ヒストグラムは適切な色で着色されます。 ヒストグラムの幅は、スケールに応じて自動的に選択されます。 原則として、価格は最大量と最小量に反応します。 しかし、確認信号を使用する必要があります。
入力パラメータ 。
基本設定 。 Bars Count - インジケータが表示されるキャンドルの数 。 Calc Bars - ボリューム偏差を決定するためのキャンドルの平均数 。 Low Volume Factor - 我々は、低ボリュームを定義する以下の係数 。 High Volume Factor - 我々は大きなボリュームを定義する上の係数 。 Extreme Volume Factor - 我々は極端なボリュームを定義する上の係数 。
視覚的な設定 。 Histo Color - キャンドルのボリュームと方向に応じてヒ
FREE
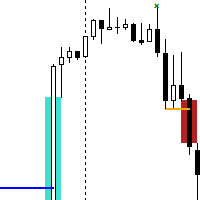
The Break of Structure (BoS) and Change of Character indicator with Fair Value Gap (FVG) filter is a specialized tool designed to enhance trading strategies by pinpointing high-probability trading opportunities on price charts. By integrating the BoS and Change of Character concepts with the FVG formation, this indicator provides traders with a robust filtering mechanism to identify optimal entry and exit points. The indicator identifies instances where the structure of price movements is disrup
FREE

MT5版 | FAQ | EA Universal Breakout Universal Box は、チャート上に価格帯をプロットし、後に価格帯ブレイクアウトで取引するために使用することができます。このインディケータを適用できる戦略はたくさんあります。 このインディケータは、デフォルトで アジア、ヨーロッパ、アメリカの取引セッション の範囲をチャートにマークするように設定されています。レンジは長方形で表示され、その境界線は取引セッションの開始時刻と終了時刻、およびその期間の最高値と最低値のレベルとなっています。 新しい Expert Advisor Prop Master - 取引ターミナルでテストしてください https://www.mql5.com/ja/market/product/115375
インジケーターの設定は非常にシンプルです。
Time Open - 取引セッションの開始時刻 Time Close - 取引セッションが終了した時刻 Box color - 矩形の色 インジケーターには4つの価格帯を設定することが可能です。 On Box パラ
FREE
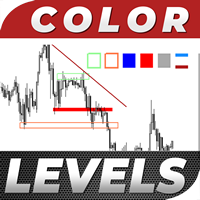
Color Levels is a convenient tool for traders using a Trendline and a Rectangle in their technical analysis. It allows setting two empty rectangles, three filled ones, and two tredlines. The indicator parameters are very simple and divided into numbered blocks: The ones beginning with 1 and 2 - empty rectangle (frame) parameters; 3, 4, and 5 - filled rectangle parameters; 6 and 7 - trendline parameters. Simply click a desired object and it will appear in the upper left corner. Main Adjustable Pa
FREE

A simple indicator that automatically highlights all FVGs (Fair Value Gaps) formed on the chart, as well as FVGs on history. It is possible to select colors for FVGs of different directions (long or short), select the time interval, select the color of middle point and you can also choose whether to delete filled FVGs or leave them on the chart (the option is beneficial for backtesting). The indicator can be very useful for those, who trade according to the concept of smart money, ICT, or simply
FREE
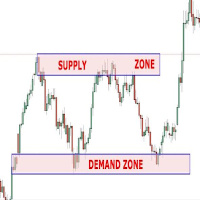
This Expert Advisor can be applied to many markets because It exploits basic supply/demand and price action concepts. It identifies the major rotation zones (PRZ), supply and demand zones and supports and resistances within major price trends. It buys at discount zones and sells at premium prices. It can and should be optimized through the Metatrader tester to find the best parameters to use for current market conditions. This is not a fixed strategy rather a full trading algo that will find whi
FREE

It identifies the pivot, support, and resistance price levels of the selected timeframe and then draws lines onto the chart. FEATURES: Option to specify the Timeframe Period in the PivotSR calculation. Option to display the PivotSR of the last candle, of every candle, or of the current candle. Options for displaying labels, line thickness, and line color. PivotSR can be interpreted as reversal levels or past price reactions that can be used as the basis for current price analysis. Some traders b
FREE
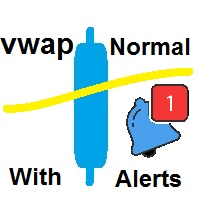
このVWAPはシンプルなVWAPですが、価格がVWAPラインに到達またはそれを越えた際に通知を行う機能が組み込まれています。 この指標はMetaTrader 4(MT4)向けの従来のVWAP指標です。 デフォルトのパラメータは通常のVWAPのものですが、VWAPの計算と最適化を行う能力があります。 価格がVWAPに触れるかクロスすると、アラート、携帯電話の通知、電子メール、またはサウンドイベントを介して通知されます。 MetaTrader 4用のアンカードVWAP指標 パラメータ: VWAPサイクル VWAPは特定の時間枠で計算されます。通常のVWAPは日毎に新しい分析を開始しますが、この指標では、デフォルトでこのオプションがあり、VWAPを計算するために希望する期間を選択できます。これは、M1の時間枠で取引していても、H1の時間枠のVWAPの計算を毎新しいH1バーごとに見ることができます。この計算の再開は選択した時間サイクルに従います。 ただし、この時点ではこれについて心配する必要はありません。デフォルトのパラメータは通常のVWAPに準拠して構成されています。このVWAP指標をダウン
FREE

Индикатор строит блоки заказов (БЗ) по торговой системе (ТС) Романа. Поиск блоков осуществляется одновременно на двух таймфремах: текущем и старшем (определяемым в настройках). Для оптимизации и игнорирования устаревших блоков в настройках задается ограничение количества дней в пределах которых осуществляется поиск блоков. Блоки строятся по правилам ТС состоящем из трех шагов: какую свечу вынесли (что?); какой свечой вынесли (чем?); правило отрисовки (как?).
FREE
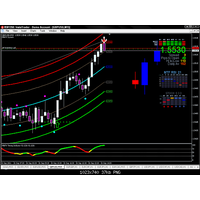
Gravity Timing Indicator -GTI-
GTIインジケーターは、これまでで最も簡単で最も正確なインジケーターです.重力の方法でサポートとレジスタンスを使用します.作業はとても簡単で、7つのラインで構成されており、最も強力なのは最低ラインと最高ラインです。 インジケーターがリバウンドし、エントリーするのに最適な時期です。
例外なくすべてのペアで機能します
時間枠については、スキャルピングの場合は 5 分や 15 分などの短い時間枠を好みます。
GTI を試してみて、気に入ったらレビューを残してください .
ありがとうございました
GTIインジケーターは、これまでで最も簡単で最も正確なインジケーターです.重力の方法でサポートとレジスタンスを使用します.作業はとても簡単で、7つのラインで構成されており、最も強力なのは最低ラインと最高ラインです。 インジケーターがリバウンドし、エントリーするのに最適な時期です。
例外なくすべてのペアで機能します
時間枠については、スキャルピングの場合は 5 分や 15 分などの短い時間枠
FREE

This information indicator will be useful for those who always want to be aware of the current situation on the account. The indicator displays data such as profit in points, percentage and currency, as well as the spread for the current pair and the time until the bar closes on the current timeframe.
VERSION MT5 - More useful indicators
There are several options for placing the information line on the chart:
1. To the right of the price (runs behind the price);
2. As a comment (in the up
FREE
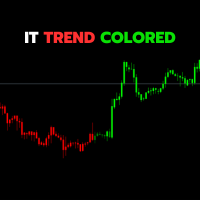
The IT Trend Colored indicator is a powerful tool designed by IT Trading (InfiniteTrades Software Corp) to assist traders in visually and effectively identifying market trends. This version is a custom indicator for the MetaTrader 4 trading platform.
Key Features:
• Trend Identification: The indicator uses a combination of simple moving averages (SMA) to determine the direction of the market trend.
• Intuitive Coloring: Upward trends are represented by bold green histograms, downward tren
FREE

Info Plus is a simple tool that displays the current status on an asset class. The information displayed by Info Plus includes: Bid Price The high and low of the day. Candle time left. Current spread. Selected timeframe. Asset class selected (Symbol). Pip value. Open Positions. Total pips booked. Pips per trade. Session times (they may not be accurate and are subject to changes). Date and time.
How it Works When loaded onto any chart, Info Plus automatically gets the following parameters: Bid
FREE
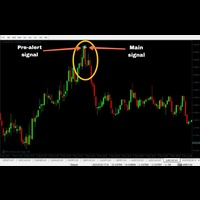
100% non-repaint MT4 indicator with advance pre alert
Recommended candle timeframe M15
Trade expiry 15 minutes
Call buffer 0
Put buffer 1
Intrabar
Pros Neural Network based Advance price action algorithms Advance trend filtering algorithms Advance consolidation filtering algo
Pre-alert (get ready) signals
Non-delay indications
Auto-trading supported
100% Non repaint
100% No lag
No recalculating
Lifetime license
Cons Very few signals
Instructions to use
1 Do not ente
FREE

FREE Heiken Ashi Smoothed indicator is fully adjustable, easy to use and comes with possibility to access the indicator via iCustom function so you can use it in your own trading software. Indicator can also pop up alerts when signal changes or send push notifications. For Metatrader 5 version click here: https://www.mql5.com/en/market/product/70825 For detailed information click: >>HERE<< Features
Easy to use Accessible via iCustom Fully adjustable Alerts and Push notifications Possi
FREE

This dynamic indicator allows you to measure retracements of price between any two points in either direction. It displays the price points, percentages and also displays the extension levels.
User may Modify and Add addition levels and extensions." User may also Add multiple Fibonacci indicators on the chart and change their colors, style and sizes.
Can be used on any timeframe.
This is the only Fibonacci Tool you'll need to measure and trade on Structure.
MT5 Version Available as we
FREE

EA_HigeTrend https://youtu.be/4vXUD_o4reA?si=u76-GyUh053-Ljou
The Hige Trend Forex robot was specifically designed for the XAUUSD pair. XAUUSD typically exhibits high volatility and trendiness in the market. Following this rationale, the Expert Advisor (EA) will execute trades in accordance with the prevailing market trend. Once a clear trend is identified, the EA will initiate an order. The configuration is straightforward, involving Take Profit and Stop Loss with a trailing stop. However, it
FREE

Calculation of Lot Size for many traders is a big challenge.
A case that is very important in money management. What many traders ignore.
Choosing an appropriate Lot Size in trades can improve results and it will ultimately lead to success.
This indicator calculates the authorized Lot Size for your trades.
The indicator uses the following values to get the appropriate Lot Size for positioning:
The distance of Stop Loss.
The Pip Value.
The amount of Risk Allowed For Each Trade.
T
FREE

Sunan Giri EA by Victoradhitya Risk Disclosure :
Futures, Forex, Stock, Crypto and Derivative trading contains substantial risk and is not for every investor.
An investor could potentially lose all or more than the initial investment.
I am not responsible for any financial losses you may incur by using this EA!
ea uses a no martingle strategy or martingale strategy depends on your set
every trade always uses a hidden SL
EA has back test for 5 years
Minimum balance $1000
FREE
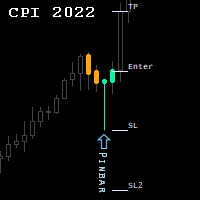
Candlestick Patterns Indicator.
NEW! FREE Candlestick Patterns Expert Advisor > https://www.mql5.com/en/market/product/105634?source=Site +Profile
The Indicator draws colored candlestick patterns, their description and future levels of Stop Loss / Take Profit. Combined with other market analysis, can greatly improve trading results. Indicator can be highly customized by the user including change of colors, fonts, levels, candle sizes etc...
developed, tested and optimized on " VantageM
FREE

GiGa FX is designed to work on EURUSD Subscribe to our new channel for promo/FREE and updates! : https://www.mql5.com/it/channels/genkidamasolutions Subscribe to profile to get new announcements and look behind the scenes! https://www.mql5.com/en/users/asodoco Please support us to building FREE EAs! Leave a review ! Thank you
Recommendations
Timeframe: H1 Symbol: EURUSD An Ecn broker is always recommended A low latency vps is always recommended. The recommended
FREE

Lot by Risk tradingパネルは、手動取引用に設計されています。 これは、注文を送信するための代替手段です。
パネルの最初の特徴は、管理線を使用した注文の便利な配置です。 第二の特徴は、ストップロスラインの存在下で与えられたリスクのための取引量の計算です。
制御線はホットキーを使用して設定されます:
利益を取る-デフォルトではTキー;
価格-デフォルトではPキー;
ストップロス-デフォルトでは、Sキー;
取引パネルの設定で自分でキーを設定できます。
操作のアルゴリズム:
1)-レベルを希望の場所に配置します(すべてのレベルを配置する必要はありません);
2)-リスクを指定します(オプション);
3)-緑の送信注文ボタンをクリックします;
4)-注文が行われるのを待っているか、エラーメッセージ付きのアラートが表示されます;
5)-マジックでExpert Advisorにリンクされている現在のシンボルのすべての注文を閉じる場合は、注文を閉じるボタンをクリックします。
注文を送信ボタンを何度も押すべきでは
FREE

RSI divergence indicator is a multi-timeframe and multi-symbol indicator that help us find divergences between price chart and RSI indicator. Always use the divergence indicators with other technical assets like support resistance zones, candlestick patterns and price action to have a higher possibility to find trend reversals. This indicator will identify the peaks and troughs of both price and the RSI indicator. You can adjust the parameters to adjust the strength and weakness of these peaks a
FREE

ピボット取引:
1.ppピボット
2. r1 r2 r3、s1 s2 s3 Necessary for traders: tools and indicators Waves automatically calculate indicators, channel trend trading Perfect trend-wave automatic calculation channel calculation , MT4 Perfect trend-wave automatic calculation channel calculation , MT5 Local Trading copying Easy And Fast Copy , MT4 Easy And Fast Copy , MT5 Local Trading copying For DEMO Easy And Fast Copy , MT4 DEMO Easy And Fast Copy , MT5 DEMO
トレンドインジケーター、 波動標準の自動計算 、 MT5バージョンの波動標準の自動計算を強くお勧めし
FREE

Indicator for the 4th strategy of the Pipsurfer EA. This indicator will allow the user to visually see the points of entry for strategy 4 of Pipsurfer. In the settings you will be able to adjust the parameters to mix and match to your trading style and find the settings that you want to either trade manually or tune the EA to do. Strategy 4 uses a market structure trend continuation approach to trading and looks for confirmed highs in downtrends and confirmed lows in uptrends to find great trend
FREE
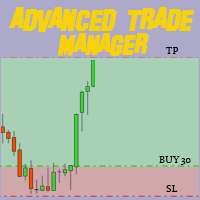
Mt5 Version : https://www.mql5.com/en/market/product/107253
MT4 および MT5 のアドバンスト トレード マネージャーで取引に革命を起こしましょう 精度と制御のための究極のツールである MT4 および MT5 アドバンスト トレード マネージャーを使用して、取引戦略を強化します。 従来のトレードマネージャーを超えて、当社のトレードマネージャーは市場の状況に動的に適応するだけでなく、取引に参加した瞬間に自動的にストップロスとテイクプロフィットのレベルを設定します。
主な特徴:
自動エントリー戦略: 当社のトレードマネージャーの自動エントリー戦略により、即座にチャンスを掴みます。 取引を開始すると、システムは事前に定義されたストップロスとテイクプロフィットを戦略的に設定し、最初から規律あるリスク管理を保証します。
動的なストップロス管理: 市場の変化にリアルタイムで反応します。 取引の利益が +0.50% に達すると、システムは自動的にストップロスを半分にし、リスクを抑えながら利益を守ります。
損益分岐点
FREE
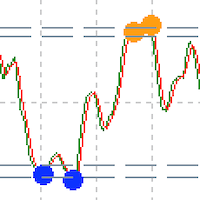
Custom Relative Strength Indicator with multiple timeframe selection About RSI The relative strength index is a technical indicator used in the analysis of financial markets. It is intended to chart the current and historical strength or weakness of a stock or market based on the closing prices of a recent trading period. Features
Indicator gives alert when reached oversold or overbought levels Gives dot indication while reaching levels. Can set indicator bar alert intervals for alerts Can choo
FREE
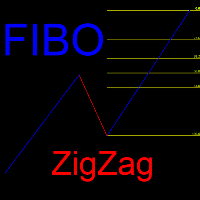
アドバイザーはトレンドに合わせてトレードします。 トレンドの方向はジグザグインジケーターによって決定されます。
フィボナッチ グリッドはトレンドの方向に重ねられます。 特定のフィボナッチ レベルで、トレンドの方向に指値注文が出されます。
注文には次のレベルが利用可能です。 23.6 38.2 50.0 61.8 78.6 ストップロスは Fibo レベル 100 に設定されるか、アドバイザー設定でユーザーによって指定されます。
利食いは Fibo レベル 0 に設定されるか、アドバイザー設定でユーザーによって指定されます。
MT5のバージョン https://www.mql5.com/ja/market/product/113194
設定: Lot Size - ロットサイズ TakeProfit - 固定TPを選択した場合のテイクプロフィット値。 0 - TP を無効にする TP Type - 利益確定タイプ: 固定またはフィボ 0 StopLoss - 固定回線を選択する場合のストップロス値。 0 - 幹線切断 SL Type - ストップロス タイプ:
FREE

Super Trend Pro Its simple. as you see in product picture you can find out how it work. We Use Several MA and use Statistics and Probability inside the code to draw nice, great and pure Trend Detection. Do you like it? Yes me too Here, Super trend pro with 100% non-repainting indicator
Input Parameter is clear and simple.
Inputs Period 1 --------------------------->>>> Use for mathematical calculating
Period 2 --------------------------->>>> MA Period
Indicator Type ------------------->>>>
FREE
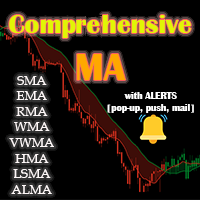
あらゆる種類の移動平均を含む包括的移動平均 [CMA] インジケーター。
MT5のバージョン
種類 SMA ------------------- (シンプル) EMA ------------------- (指数関数) SMMA [RMA] -------- (平滑化) WMA ------------------- (線形加重) DEMA ------------------ (ダブル EMA) TEMA ------------------- (トリプル EMA) VWMA ----------------- (ボリューム加重) HMA ------------------ (船体) LSMA ------------------- (最小二乗法) アルマ望遠鏡[ガウス] ---- (アルノー・ルグー)
特徴 異なる設定で 2 つの MA をアクティブ化する機能。 グラフィック設定をカスタマイズする機能。 クロス MA または MA とのクロス価格に基づいてローソク足の色を変更する機能。 クロスMAまたはMAとのクロス価格の場合にアラートを送信します。
FREE

このユーティリティEAは、ブローカーからすべてのヒストリカルデータを一度にダウンロードすることを目的としています。チャート(どのチャートでも可)にドロップしたら、入力で処理するシンボルとタイムフレームを選択します。そうすると、すべてが自動化されます。時間はかかりますが、処理された内容はExpertsログに表示されます。
もちろん、ダウンロードできるのはブローカーサーバーにあるデータのみです。このプロセスは、MT4の「チャート」設定の「ヒストリーの最大バー」と「チャートの最大バー」によって異なりますので、最大データを確実に取得したい場合は、これらの値をデフォルトよりも大きく設定することができます。しかし、すべてのブローカーが多くの履歴データを提供するわけではなく、これらの設定に非常に大きな値を使用すると、あなたのプラットフォームのパフォーマンスに深刻な影響を与える可能性があります、それを使用して注意してください。 このツールは主に、複数のシンボルと複数のタイムフレームで動作する指標やEAに必要なすべてのデータをダウンロードするために非常に便利です。 私のパートナーである ダニエル・スタ
FREE

FOLLOW THE LINE GET THE FULL VERSION HERE: https://www.mql5.com/en/market/product/36024 This indicator obeys the popular maxim that: "THE TREND IS YOUR FRIEND" It paints a GREEN line for BUY and also paints a RED line for SELL. It gives alarms and alerts of all kinds. IT DOES NOT REPAINT and can be used for all currency pairs and timeframes. Yes, as easy and simple as that. Even a newbie can use it to make great and reliable trades. NB: For best results, get my other premium indicators for more
FREE
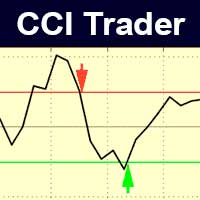
Советник работает на двух индикаторах CCI и ADX. Условия для входа в BUY: 1. ADX пересекает уровень 20 2. CCI пересекает уровень 100 снизу вверх 3. Выставляем фиксированный StopLoss и TakeProfit 4. Закрываем позицию по рыночной цене, когда CCI пересекает уровень 100 сверху вниз.
Условия для входа в SELL: 1. ADX пересекает уровень 20 2. CCI пересекает уровень -100 сверху вниз 3. Выставляем фиксированный StopLoss и TakeProfit 4. Закрываем позицию по рыночной цене, когда CCI пересекает уровень -1
FREE
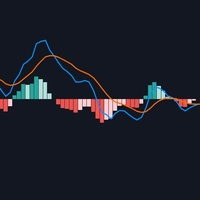
Moving average convergence divergence (MACD) is a trend-following momentum indicator that shows the relationship between two moving averages of a security’s price. The result of that calculation is the MACD line. A nine-day EMA of the MACD called the "signal line," is then plotted on top of the MACD line, which can function as a trigger for buy and sell signals. Traders may buy the security when the MACD crosses above its signal line and sell—or short—the security when the MACD crosse
FREE

The Market Structures MT4 indicator finds and shows the Break Of Structures (BoS) pattern on the chart. The pattern is an important part of the Smart Money Concepts (SMC) system.
The appearance of a pattern means that the price breaks the last peak of an uptrend, or the last bottom of a downtrend. This indicates a change in the existing trend structure and the beginning of a new movement.
BOS is a technical analysis tool used to identify trend reversals.
The set of input parameters is simple
FREE

The indicator analyzes the volume scale and splits it into two components - seller volumes and buyer volumes, and also calculates the delta and cumulative delta. The indicator does not flicker or redraw, its calculation and plotting are performed fairly quickly, while using the data from the smaller (relative to the current) periods. The indicator operation modes can be switched using the Mode input variable: Buy - display only the buyer volumes. Sell - display only the seller volumes. BuySell -
FREE

МetaТrader4のトレードコピー機。外国為替取引、ポジション、注文を任意のアカウントからコピーします。
それは最高の МТ4 - МТ4, МТ5 - МТ5, МТ4 - МТ5, МТ5 - МТ4 貿易複写機、今日の一つです。 独自のコピーアルゴリズムにより、すべての取引がマスターアカウントからクライアントアカウントに正確にコピーされます。高い動作速度。厳しいエラー処理。強力な機能セット。 これらすべての品質は、単一のプログラム-EXP-COPYLOTにまとめられています。 プログラムは、複数の端末バインディングで実行できます。 1つのアカウントで取引されているさまざまな投資家アカウントでの取引のシンクロナイザーとして使用します。-COPYLOTは取引を他の端末にコピーします。 インストール CopyLotマスター-ポジションと注文をコピーしたいアカウントにインストールするエキスパート。 このエキスパートをターミナルにインストールし、そこからポジションを投資口座にコピーします。 「COPY」のように、任意のテキストラベル名をpathWrit
FREE

It works based on the Stochastic Indicator algorithm. Very useful for trading with high-low or OverSold/Overbought swing strategies. StochSignal will show a buy arrow if the two lines have crossed in the OverSold area and sell arrows if the two lines have crossed in the Overbought area. You can put the Stochastic Indicator on the chart with the same parameters as this StochSignal Indicator to understand more clearly how it works. This indicator is equipped with the following parameters: Inputs d
FREE
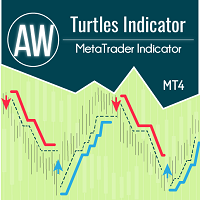
このインジケーターはタートル システムに従って機能し、古典的に 20 ローソク足と 55 ローソク足の時間間隔を想定しています。傾向は、指定された時間間隔にわたって監視されます。エントリーはサポートまたはレジスタンスレベルを下抜けた瞬間に行われます。出口シグナルは、同じ時間間隔のトレンドの反対方向への価格ブレイクアウトです。 利点:
金融商品: 通貨ペア、株式、商品、指数、暗号通貨 タイムフレーム: 古典的には D1、あらゆるタイムフレームでの作業にも適しています 取引時間: 24時間 資金管理戦略: 取引あたりのリスクは 1% 以下 追加注文を使用する場合、追加ポジションごとのリスクは 0.25% MT5バージョン -> こちら / AW Turtles EA -> こちら エントリールール: 1) 短いエントリー: エントリー条件は20日間の高値または安値をブレイクアウトすることです。
前のシグナルが成功した場合、取引はスキップされます。
注記!以前の取引が利益で終了した場合は、エントリをスキップします。ブレイクアウトが利益を生むことが突然判明した場合は、後で5
FREE
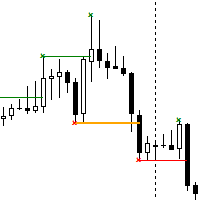
The Break of Structure (BoS) and Change of Character indicator is a powerful tool designed to identify significant turning points in price movements on financial charts within the MetaTrader 4 platform. By analyzing price action, this indicator highlights instances where the market shifts from a trend to a potential reversal or consolidation phase. Utilizing sophisticated algorithms, the indicator identifies breakouts where the structure of price movement undergoes notable changes. These breakou
FREE

MT Supply Demand : It is an indicator created to find supply and demand, which will be important support and resistance levels for the price. It can be set pending orders or used in conjunction with other indicators to send buy or sell signals.
PLATFROM: MT4 Only
TRADE: Forex
TIME FRAME: All Time Frame
SYMBOL PAIR: All Symbol
SETTINGS:
Supply & Demand : ON | OFF
Candle MA: Set the MA to change the candle color to show the trend.
Show Symbol : ON | OFF It's a free v
FREE
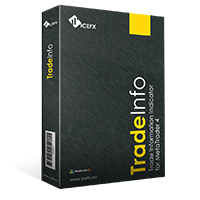
IceFX’s TradeInfo is an utility indicator which displays the most important information of the current account and position.
Displayed information: Information about the current account (Balance, Equity, Free Margin). Current spread, current drawdown (DD), planned profit, expected losses, etc. Number of open position(s), volume (LOT), profit. Today’s and yesterday’s range. Remaining time to the next candle. Last day profit information (with integrated IceFX ProfitInfo indicator). Risk-based LO
FREE
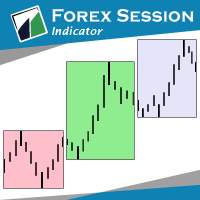
The indicator Forex Session displays official forex session times for Asia, Europe, America.
Main features shows Asian, European and American sessions shows the session volatility it can also be used for breakout trading
Indicator parameters 01: Sessions Session value - number of sessions Last session in developing mode - the session will be progressively displayed Adapts the size session to range - session size adjusts to volatility
02: Display Asia - on/off Europe - on/off America - on
FREE
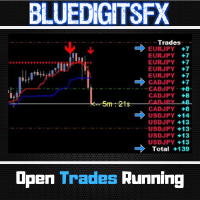
MT5 Version Available Here: https://www.mql5.com/en/market/product/62376
Telegram Channel & Group : https://t.me/bluedigitsfx
V.I.P Group Access: Send Payment Proof of any of our Paid Products to our Inbox
Recommended Broker: https://eb4.app/BDFXOsprey * The Most Sought After Pip Counter for Metatrader ! Features
Will show Currency Symbol in BLUE for Buy positions. Will show Currency Symbol in RED for Sell positions. Will Show pips in BLUE Color for Positive Pips Will Show pips in
FREE
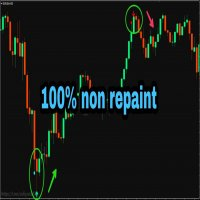
PLEASE NOTE You can customize the settings of K_period value, the oversold and the overbought value is customizable. You can change it as per your requirement. The accuracy will change as per your settings.
100% Non repaint indicator
Pre-alert (get ready) signals
Non-delay indications
24/7 signals
100% No lag
No recalculating The arrows wont repaint even if the signal fails, or you refresh or restart the mt4 Indicator is based on simple crossover strategy of main line and signal line
FREE

MACD Intraday Trendは、1960年代にGeraldAppelによって作成された元のMACDを適応させて開発された指標です。
長年の取引を通じて、MACDのパラメーターをフィボナッチの比率で変更することにより、トレンドの動きの連続性をより適切に表現できることが観察され、価格トレンドの開始と終了をより効率的に検出できるようになりました。
価格トレンドの検出が効率的であるため、トップとボトムの相違を非常に明確に識別し、取引機会をより有効に活用することもできます。
設定可能な機能とアラートを備えたプロフェッショナルバージョンをぜひお試しください: MACD Intraday Trend PRO
特徴 任意の通貨ペアで機能します 任意の時間枠で動作します 練行足チャートで動作します
それでも質問がある場合は、直接メッセージで私に連絡してください。 https://www.mql5.com/ja/users/robsjunqueira/
FREE

The indicator displays profit (loss) on the current symbol. You can freely drag and drop the line to display the current profit or loss.
Parameters Calculation in money or in points — calculate the profit/loss in points or money. Add pending orders to calculate — take pending orders into account in calculations. Magic Number (0 - all orders on symbol) — magic number, if it is necessary to evaluate specific orders. Offset for first drawing (points from the average price) — offset of the line fr
FREE

これは無料の製品ですので、ニーズに合わせてご使用ください。
また、肯定的なフィードバックをいただき、大変感謝しております。 どうもありがとう!
// さらに優れたエキスパートアドバイザーとインジケーターはここから入手できます: https://www.mql5.com/en/users/def1380/seller // また、収益性が高く、安定していて信頼性の高いシグナル https://www.mql5.com/en/signals/1887493 に参加することも歓迎します。
外国為替インジケーター: MT4 の平均足ローソク足。 再塗装はありません。
Heiken_Ashi_Candles はトレンドライン MA インジケーターとの素晴らしい組み合わせです https://www.mql5.com/en/market/product/108445 Heiken_Ashi_Candles インジケーターは、トレンドをより見やすくするための非常に便利な補助インジケーターです。 ローソク足チャートを読みやすくし、傾向を分析しやすくするのに役立ちます。 ほとんどの利益
FREE

ET1 for MT4 is new and completely free!! ET1 for MT4 v3.50 Updated!! Now use on XAUUSD(Gold) and GBPUSD!! The success rate is more than 75% !!!
Important Update: Optimized the stability of ET1 strategy
Users can manually modify the following settings:
Maximum volatility, minimum take profit in points, maximum take profit in points, maximum stop loss in points, add orders timeframes
The user manually sets it up and gets different results, responding to someone who says we read historical da
FREE
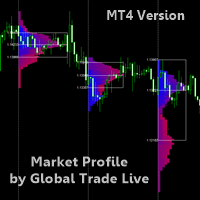
READ THE DESCRIPTION ITS IMPORTANT - ONLY TAKES 2 MINUTES - THIS IS A TOOL NOT A TRADING STRATEGY
Market Profile By Global Trade Live A Market Profile is a graphical representation that combines price and time information in the form of a distribution. A Market Profile is used to determine elapsed time, number of ticks and volumes traded at specific prices, or over a price interval, over a given period. A Market Profile also makes it possible to identify prices accepted or rejected by the ma
FREE

This indicator discovers and displays the Supply and Demand zones on the chart. MT5 Version Identifying supply and demand zones is very important in any kind of trading strategy. If you can use these zones well, you will definitely get good success in trading. Some features of this indicator Graphic display of the remaining distance to the nearest supply and demand zones Alerts of approaching or breaking supply and demand zones Dark and light themes Recommended Tim
FREE

これにはフラクタルがまだ閉じる必要があるため、切り替えられてフラクタルが閉じていない場合はインジケーターが再計算されます。 それがまさにフラクタルの性質です。 ゾーン内取引は需要と供給の指標として非常に人気があり、金融市場内の主要な取引ゾーンを特定するのに有効であることで知られています。 以前に識別されたゾーンの再描画や消去でしばしば問題に直面したこのインジケーターのオリジナル バージョンとは異なり、この改善された反復により、過去のデータを通じてゾーンが確実に表示されたままになり、重要なサポートとレジスタンスのレベルを正確に特定する際にトレーダーに明確な利点が提供されます。
この指標の主な機能は、市場内の需要と供給のダイナミクスの概念を中心に展開されます。 これは、買い圧力と売り圧力の間に重大な不均衡があり、トレーダーの潜在的な転換点や関心レベルにつながる領域を特定します。 以前に識別されたゾーンが消えたり移動したりする再描画の一般的な問題を回避することで、トレーダーはインジケーターの過去の精度を信頼して情報に基づいた取引の決定を下すことができます。
基本的に、ゾーンでの取引
FREE

Night Swimmer は強力なナイト スキャルピング EA です。
ボラティリティの低い市況向けに設計された高度なスキャルピング システムである Night Swimmer EA を使用して、夜間取引を体験してください。 この EA は慎重に使用し、許容できる金額のみリスクを負うことが重要です。 実際のティック モデリングを使用して EA をバックテストし、設定を試して、最適な設定を見つけることをお勧めします。
この EA は無料です。 したがって、EA が気に入った場合は、5 つ星の評価を残すことを検討してください。
推奨されるシンボル: EURUSD、GBPUSD、EURCHF、USDCHF 推奨時間枠: M5 (5 分チャート)
特徴: 夜間取引に最適化: 当社の EA は、価格変動がより予測可能で変動が少ない傾向がある夜間市場の独特の特性を活用するように特別に調整されています。 平均回帰戦略: EA は、価格が平均値に回帰する傾向を利用し、短期的な価格変動を捉えて一貫した利益をもたらします。 スマートな機能: 当社の EA には、パフォーマンスの低い取引
FREE
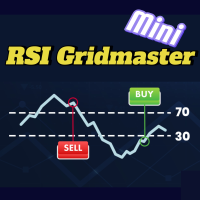
Welcome! This is the RSI GridMaster Mini, the freely available compact version of the popular RSI GridMaster. This robot operates based on the RSI indicator with a grid strategy, allowing for continuous trading in response to market movements. The Mini version comes with a fixed lot size of 0.01 and trades exclusively on the hourly time frame. In this version, the number of settings has been minimized to simplify and streamline the trading process. You can find the full version by clicking here
FREE

インジケータには、選択した時間枠の最大水平ボリュームが表示されます。 インジケーター UPD1 Volume Box に基づいています。 ラインは接続または分離することができます。 設定では、スマートタッチ通知を有効にすることができます。 この指標は、市場プロファイルとスマートマネーの概念を使用して取引する人に役立ちます。
入力パラメータ 。
基本設定 。 Bars Count - は、TF POCが描画されるバーの数を示します 。 Data Source - ティックが使用される時間枠 。 Vertical Step - 密度と垂直精度に影響します 。 TimeFrame Period - 最大水平ボリュームが適用される時間枠期間 。 ID - インジケータ識別番号。 異なる値を選択して、同じチャート上のインジケーターを複数回使用します 。
視覚的な設定 。 Current POC - 表示されるPOCの表示 。 Crop Line To Current Bar - 行は最後のバーを超えません 。 Link POC - POCラインを垂直線で接続する 。 POC Wid
FREE
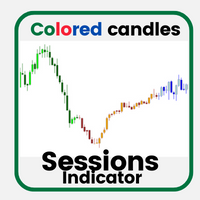
This indicator displays trading sessions as colored candles. It is designed for volume profile and supply/demand traders, to more easily know at what time/trading session specific candles are formed. Check out the screenshots to see an example of use.
Features Colored candles overlay with different colors for bullish and bearish candles, allowing the user to distinguish bearish from bullish candles.
FREE

ChartWall is intended for displaying and automatic changing of wallpapers on a chart. It supports JPG and BMP formats. A file and a display style are selected via the built-in panel, which can be opened by clicking on the application icon (hidden button) that appears in the bottom left corner of the chart (main window) as you move the cursor to that area. Using the built-in panel you can also set a period for the rotation of images in minutes. Image files are selected randomly from the folder t
FREE

The free version of the «AlphaD» Trading Robot Caution! Opens many orders analyzing the logic of price behavior. A unique opportunity to get the full version of the «AlphaR» robot without activation restrictions and with the ability to change parameters
What needs to be done:
Download "AlphaD" and test it on the history for several years. Write a couple of lines in the Discussion and attach a screenshot with the test results. > link
Write an HONEST review. > link
Write to
FREE

TradingViewでInside Barを使用していて、Inside Barの検出が簡単で心地よいのに、MQL市場では見つからない場合は、ここで検索が終了します。 InsideBar Highlightの特徴: ABCのように簡単:Inside barsはシンプルに。当社のツールはローソク足の本体に焦点を当て、煩わしさなしに重要な情報が見えます。 あなたのスタイル、あなたの選択:カラフルが好きですか、すべて同じが良いですか? あなたが決める。上昇または下降の動きを楽に見つけます。 手袋のようにフィット:ハイライトは見せ物だけでなく、各ローソク足に完璧にフィットし、グラフをクリアで読みやすくします。 手を差し伸べる助け: 当社のツールの使用に関する課題や質問がある場合は、お気軽にお問い合わせください。メッセージは歓迎されており、必要なものは何でもお手伝いいたします。InsideBar Highlight 4は単なるツールではありません。質問や経験が重要なサポートコミュニティです。
FREE
How To Trade
Execute your trades in 3 Easy Steps!
Step 1: Trade Setup Entry Buy in Signal price and TP1 in price indicator, You can use trailing stop in TP1. Entry Sell in Signal price and TP1 in price indicator, You can use trailing stop in TP1. Success Rate ≥ 75% 100:25 Step 2: Set Stop Loss Stop loss BUY ----> You can set stop loss on Line Order SELL. Stop loss SELL ----> You can set stop loss on Line Order BUY. Step 3: Set Take Profit Option 1: Take profit on TP1. Option 2: Partial take
FREE

The Omega Trend Indicator is an advanced tool that has been specifically designed to detect market trends early, and follow them efficiently. The indicator draws two lines. The main (thicker) Trend Line represents the presumed lower or upper volatility limits of the current market trend. A break in the main Trend Line indicates a potential reversal or shift in the movement of the trend. The Trend Line also indicates the best point to place a stop loss order. In Omega Trend Indicator, the Trend L
FREE

このインジケーターは有名なフラクタルインジケーターに基づいていますが、多くのカスタマイズ と柔軟性があり、
これは、トレンドの反転を特定し、潜在的な利益を最大化するための強力なツールです。
高度な機能とユーザーフレンドリーなインターフェイスを備えた、あらゆるレベルのトレーダーにとって究極の選択肢です。 MT5 バージョン : Ultimate Fractals MT5 特徴 :
カスタマイズ可能なフラクタル キャンドルの数。 反転ライン。 カスタマイズ可能な設定。 ユーザーフレンドリーなインターフェイス。 主なパラメータ: 左側のキャンドル - フラクタルを形成する左側のバーの数。 Candle On Right - フラクタルの右側のバーの数。
市場の不確実性によって行動を妨げないようにしてください。 「究極のフラクタル」インジケーターでトレーディング ゲームをレベルアップさせましょう。
このツールを利用して自信を持って意思決定を行い、財務目標を達成する成功したトレーダーの仲間入りをしましょう。 特定の「Ultimate Fractals MT4」インジケーター
FREE
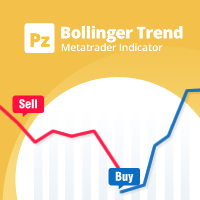
A personal implementation of the famous Bollinger bands indicator as a trend following mechanism, which uses a moving average and the standard deviation to define what a trend is and when it changes. Bollinger bands are usually used as an oversold/overbought indicator only, but in my opinion, the trading approach is more complete using the trend variant as an exit strategy. [ Installation Guide | Update Guide | Troubleshooting | FAQ | All Products ] Easy to trade Customizable colors and sizes It
FREE
MetaTraderプラットフォームのためのアプリのストアであるMetaTraderアプリストアで自動売買ロボットを購入する方法をご覧ください。
MQL5.community支払いシステムでは、PayPalや銀行カードおよび人気の支払いシステムを通してトランザクションをすることができます。ご満足いただけるように購入前に自動売買ロボットをテストすることを強くお勧めします。
取引の機会を逃しています。
- 無料取引アプリ
- 8千を超えるシグナルをコピー
- 金融ニュースで金融マーケットを探索
新規登録
ログイン