Trend deviation scalper
- Göstergeler
- Sürüm: 1.50
- Güncellendi: 18 Eylül 2022
- Etkinleştirmeler: 5

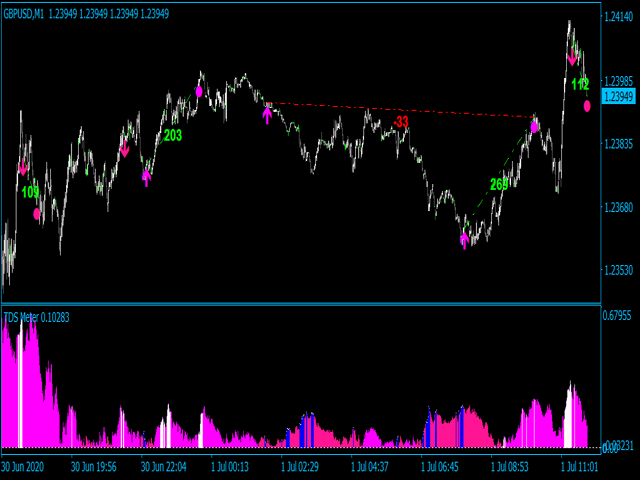
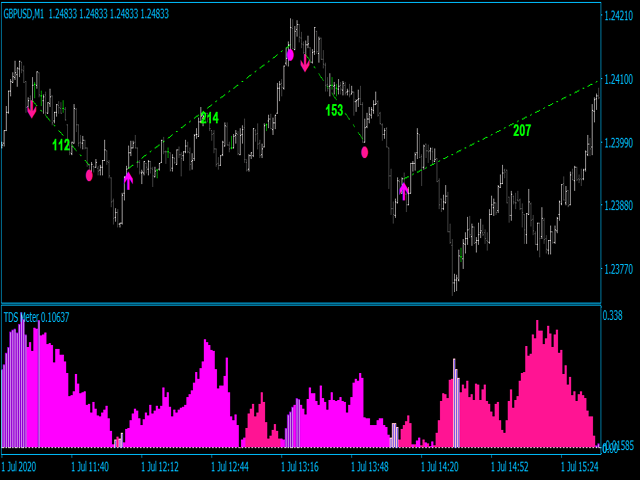
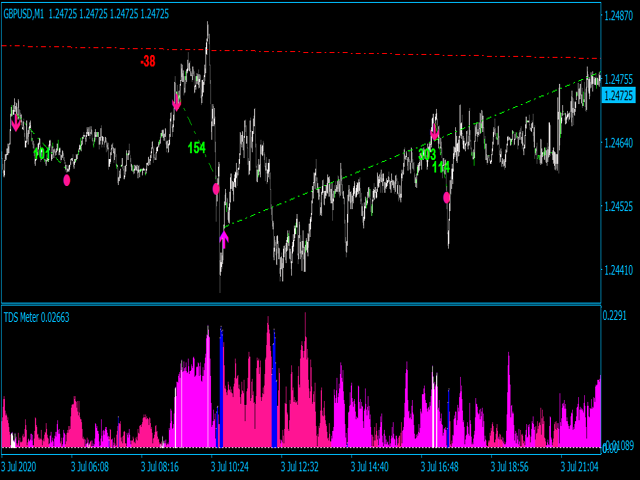
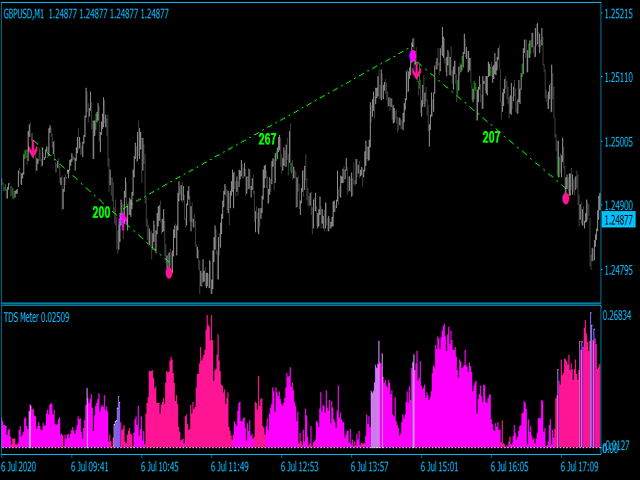
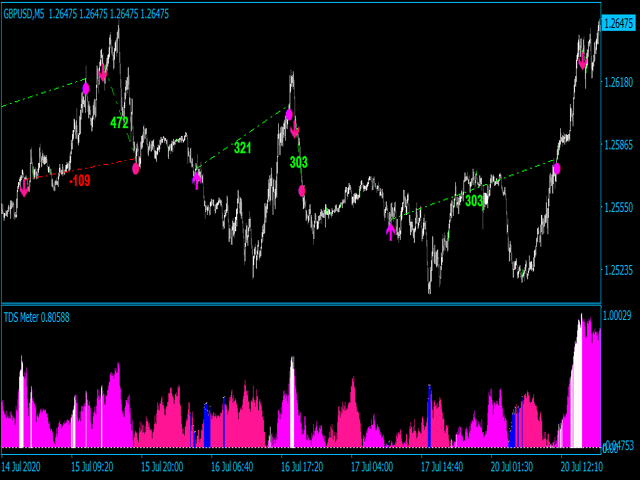
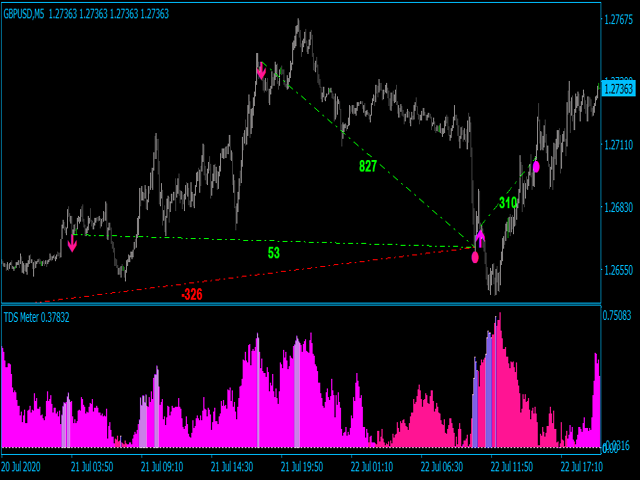
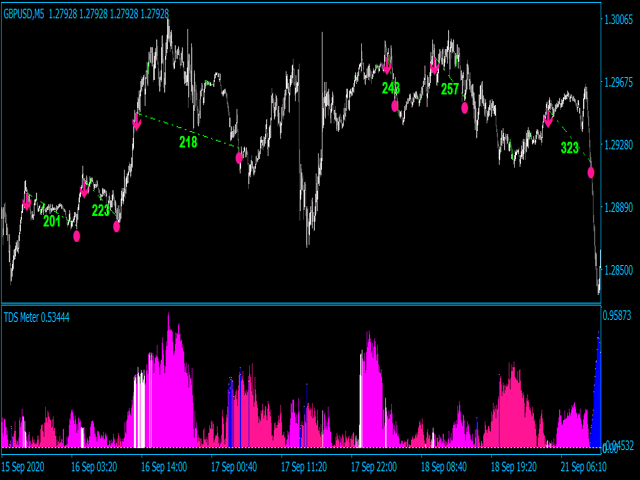
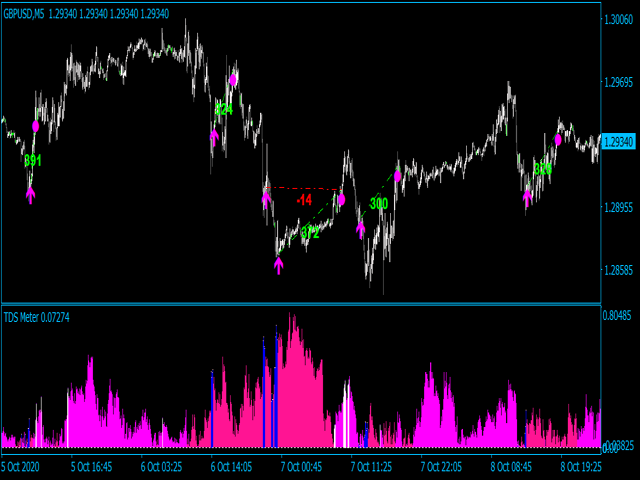
Trend deviation scalper - is the manual system to scalp choppy market places. Indicator defines bull/bear trend and it's force. Inside exact trend system also defines "weak" places, when trend is ready to reverse. So as a rule, system plots a sell arrow when bull trend becomes weak and possibly reverses to bear trend. For buy arrow is opposite : arrow is plotted on bear weak trend. Such arrangement allows you to get a favorable price and stand up market noise. Loss arrows are closing by common profit. Lot increase never used. Every arrow represent initial lot size.
Main Indicator's Features
- Signals are not repaint,non-late or disappear(exept cases when system recalculates all history datas,refreshing main settings or Metatrader refreshes new incomming datas);
- Every signal comes at the open of new bar(system uses only confirmed signals);
- Indicator has Alerts, Mail and Push notifications(allow to trade out of PC, from smartphone/mobile app);
- System is 100% autoadaptive no need manual adjusting. Just set up and start trading.
- Possible to disable arrow strategy and use only histogram.
Recommendations for trading
- Scalping timefrsmes: M1-M15 range;
- Volatility pairs like EURUSD, GBPUSD, USDCAD, GOLD, Crypto;
Attention there, stay away of this crapy indicator !! 1) It is repainting (arrows disappear from one day to the other) 2) The take profit dot appears 2 hours later, it is a complete nosense. These informations "of course" don't appear in the description, (if these informations would be in the description, i would never buy). About backtest: i was focus on the arrows, looking at the moment they appear, if they disappear or not (that was not the case on backtest, but in live trading they "do" disappear!! And no, i didn't see that the TP dots are so delayed. Stay away !!
Let’s address your claims point by point: Manipulation of the term "Repainting": You are confusing cheap visual tricks with high-end technology. Repainting is a deliberate manipulation of arrows on history to deceive the buyer (like in the "ZigZag" indicator). My indicator features self-adaptation, which is clearly and honestly stated in the very first point of the description. The system retrains itself on fresh data to provide relevant signals instead of those that worked a month ago. Complaining that a self-learning algorithm updates its model is like complaining that an antivirus updates its database. Calling modern self-learning algorithms a "fraud" is like accusing a smartphone of not being a rotary phone! Absurdity of the TP claims: Your claim about a "2-hour delay" is factually incorrect. There is no timer in the system. The Take Profit here is dynamic: it is calculated by the algorithm based on actual market conditions. If the conditions for profit-taking mature after 2 hours, it will appear when it is relevant, not when you want it to. Expecting a static line where a live mathematical calculation is at work is a sign of amateurism, not a flaw in the indicator. Ignoring platform tools and dynamic exit logic: MQL5 provides a free demo version specifically so that buyers can study the logic (including history recalculation and TP dynamics) before clicking the "Buy" button. The fact that you failed to notice the TP dynamics during free testing only confirms that you purchased a complex professional tool without even attempting to understand it. You chose to ignore the tests, ignore the description, and now you are projecting your own negligence as "deception." I am deeply disappointed that instead of a constructive dialogue, you chose the path of baseless insults. Calling a developer a "scammer" and a "fraud" simply because you are unable to master a sophisticated tool and read the product description is straightforward defamation. I regard your review as an attempt at manipulation and an insult to my professional reputation. Your refusal to understand the product before purchasing it does not give you the right to issue public insults.