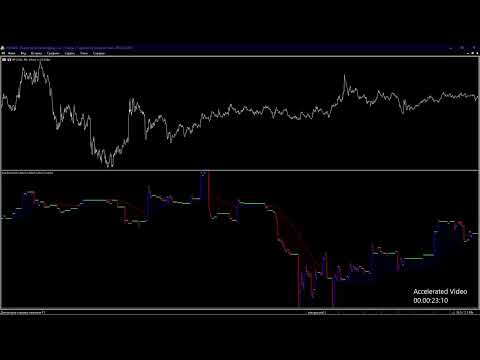
One Sec Tick Chart

Bu, ikinci formatta bir onay grafiğidir. OpenCL desteği var.
Ayarlar çok basittir - göstergenin hesaplanacağı haftanın günlerini seçebilirsiniz:
örneğin, fiyatları hafta sonları güncellenmeyen bu tür finansal araçlar için, 6. ve 7. günler için haftanın başka bir gününü seçmelisiniz, ancak örneğin bitcoin için, komisyoncu fiyatları güncellerse, şunları yapabilirsiniz: 6. gün - Cumartesi ve 7. gün - Pazar için belirtin.
Dilerseniz renkleri de özelleştirebilirsiniz.
Bu, uyarlanabilir ve pürüzsüz bir renk çizgisidir.
Bu gösterge strateji test cihazında çalışmıyor - satın almadan önce videoyu izleyin.
///////////////////////////////////////////// ///////////////////////////////
Umarım bu gösterge başarılı ticarette sizin için çok faydalı olacaktır.

İyi şanlar.
Video One Sec Tick Chart
Önerilen ürünler
This MT5 indicator provides real-time updates of classic Renko charts. Renko charts focus on price movement, filtering out noise and highlighting trends. What are Renko candles? Renko charts display price movement using "bricks" of equal size, ignoring time. A new brick is drawn only when the price moves by a specified amount. They help visualize trends by removing time-based noise. Parameters - BrickSizePoints  (20): Renko brick size in points - HistoryDepthSec  (3600): Historical data to ini
FREE
Unlock the power of Fibonacci with our advanced indicator! This tool precisely plots Fibonacci levels based on the previous day's high and low, identifying the next day's key support and resistance levels. Perfect for day trading and swing trading, it has consistently generated weekly profits for me. Elevate your trading strategy and seize profitable opportunities with ease. NOTE: In the Input section make sure the draw labels are set to "True" so you can see each levels.
Gino Renko
Stephane, Andr Valette
1 (1)
Another renko-based indicator. It returns different usable values ​​for an EA, and is directly displayed on the main chart. Its setting is very simple: The size of the renko The number of bars taken into account The falling color The color on the rise Returned values: Buffer 0 : Value of the middle Buffer 1 : Value of the Top Buffer 2 : Value of the Bottom Buffer 3 : Direction of renko (0.0 for top ; 1.0 for bottom) Buffer 4 : Ratio of the renko, for example, if it is twice, 3 times, ro more of
Renko Plus
Eadvisors Software Inc.
With Renko Plus you can use the features in the Indicator functionality, just add it to the Metatrader5 chart.             The Renko chart is a type of chart, developed by the Japanese, that is constructed using price movement rather than standardized prices and time intervals like most charts. It is believed to be named after the Japanese word for bricks, "renga", as the graphic looks like a series of bricks.             A new brick is created when the price moves a specified pri
Renko Chart
Marcin Konieczny
3.56 (9)
This indicator allows to display Renko charts in the indicator window. Renko charts show only price movements that are bigger than the specified box size. It helps to eliminate noise and allows to focus on main trends. Time is not a factor here. Only price movements are taken into account. That's why Renko chart is not synchronized with the main chart it is attached to. Indicator works in two modes: CLOSE - only close prices are taken into account while building the chart HIGH_LOW - only high/l
FREE
This is a buyer and seller aggression indicator that analyzes the shape of each candle and project this data in a histogram form. There are 4 histograms in one. On the front we have two: Upper - Buyer force. Lower - Seller force. At the background we also have two histogram, both with same color. They measure the combined strenght of buyers and sellers. This histograms can be turned off in Input Parameters. It is also possible to have the real or tick volume to help on this force measurement. IN
FREE
Contact me for instruction, any questions! - Lifetime update free - Non-repaint - I just sell my products in Elif Kaya Profile, any other websites are stolen old versions, So no any new updates or support. Introduction Breakout Trend Scanner indicator works based on the Elliott Wave in technical analysis describes price movements in the financial market that are related to changes in trader sentiment and psychology and finds end of movement and breakout trend. The Elliott Wave pattern that is f
Zigzag Price Arrows
Aiman Saeed Salem Dahbag
The Zigzag Price Arrow indicator is an enhanced version of the classic Zigzag indicator, combining the traditional zigzag pattern with advanced visual features. It not only identifies major market turning points but also provides clear trading signals through: • Directional arrows: Displays colored arrows (green for buy, magenta for sell) indicating potential trend directions. • Price labels: Shows the exact price values at each pivot point directly on the chart. • Improved visual clarity: Make
FREE
Anchored VWAP with Alert MT5
Trade The Volume Waves Single Member P.C.
5 (1)
What is the Volume Weighted Average Price (VWAP)? The volume weighted average price (VWAP) is a trading benchmark used by traders that gives the average price an instrument has traded at throughout the day, based on both volume and price.  It is important because it provides traders with insight into both the trend and value of the instrument. What is the Difference between VWAP and AVWAP? While VWAP is having as starting point the beggining of the day,week,month etc. in the AVWAP you can pla
KT Liquidity Sweep Filter MT5
KEENBASE SOFTWARE SOLUTIONS
KT Liquidity Sweep Filter, kritik likidite süpürme bölgelerini tespit eder ve vurgular. Bu bölgeleri net fiyat tepkileri ve uyarlanabilir bir trend filtresiyle birleştirerek, piyasa trendiyle uyumlu hassas alım ve satım sinyalleri üretir. Araç, ana ve ikincil likidite süpürme bölgeleri arasında ayrım yapar. Ana bölgeler büyük oklarla, ikincil bölgeler ise daha küçük oklarla işaretlenir, böylece kolayca ayırt edilebilir. Büyük Oklar: Ana likidite süpürme bölgelerinden gelen güçlü dönüş sinyalleri
Displays trends in current chart. You can display trends of multiple timeframes in one chart by inserting this indicator as often as you want. Key features: displays trend line by finding highs and lows counts number of high/low of current trend in different color (long/short) allows you to display multiple timeframe trends in one chart Settings: Indicator Name: if you want to show M5 and H1 on one chart add TITrend twice to your current chart and rename M5 to "TITrendM5" and H1 to "TITrendH1" C
VWAP Fibo Bands RSJ is an indicator that traces the lines of the daily VWAP and from it creates bands using Fibonacci proportions. This spectacular indicator creates 10 band levels through the selected VWAP period using Fibonacci ratios. It is fantastic how the prices respect each level of the bands, where it is possible to realize that almost every time the price closes above / below a level of the bands he will seek the next one. If close above will seek to reach the level above and if close
FREE
The ATR Indicator Based on Heiken Ashi is a unique volatility analysis tool that combines the Average True Range (ATR) with Heiken Ashi candlestick calculations to provide a smoother and more reliable measure of market volatility. Unlike the traditional ATR, which uses standard candlesticks, this indicator applies the Heiken Ashi formula to filter out market noise and deliver a clearer volatility signal. Key Features: • ATR Calculation Based on Heiken Ashi Candlesticks – Offers a more stable v
FREE
Watermark Centralized
Ronnie Ferreira Silva
3.67 (3)
Watermark Centralized Adds a watermark centered with the asset name and chosen period. It is possible to override the font type, font size, font color and separator character. The watermark is positioned behind the candles, not disturbing the visualization. It has automatic re-centering if the window is resized. Hope this indicator helps you, good trading ;)
FREE
Visual Heatmap Book Analyzer
Alexandre Moraes De Souza Lima
Visual Heatmap Book Analyser This indicator monitors the market liquidity and generates colors based on order patterns, quantities, and renewal activities in the book. This allows you to visualize the order flow and identify areas of high and low liquidity and activity. The indicator uses machine learning techniques to analyze the order behavior in the book, enabling it to detect patterns and trends in orders, allowing you to make informed decisions about your trading operations. The color pale
Short Description: Prop Firm Protector EZ MT5 is an EA designed to protect your funded account by managing risk and ensuring compliance with the Prop Firm's trading rules. This EA automatically monitors equity levels, closes trades when profit targets or drawdown limits are reached, and provides a visual display of key account metrics. The EA features a Super Easy setup, is simple to use, and works with all different Prop Firm service providers. Overview: Prop Firm Protector EZ MT5 is an Draw
Cumulative Vol Bands
Thalles Nascimento De Carvalho
CVB Cumulative Volume Bands: Birikmiş Hacim ile İşlemlerinizi Güçlendirin! CVB Cumulative Volume Bands , birikmiş hacme dayalı kesin sinyaller arayan traderlar için tasarlanmış ileri düzey bir göstergedir. Birikmiş hacim bantlarını kullanarak, bu gösterge piyasanın alım ve satım baskılarının net okumasını sağlar ve dönüşleri ve güçlü fiyat hareketlerini tanımlamada yardımcı olur. Temel Özellikler: Birikmiş Hacim Analizi : Hacme dayalı baskı noktalarını tespit edin. Açık Giriş/Ç
A Média Móvel é um indicador que faz parte da Análise Técnica. Com ela, é possível identificar o equilíbrio dos preços no mercado, observando tendências de alta, neutra ou baixa. Este indicador customizado traz opções extras pera definir o método de cálculo podendo-se esclolher entre SMA,EMA,SSMA,LWMA,JJMA,JurX,ParMA,T3,Vidya,AMA,HULL MA. Também conta com varias opções para escolher o método de cálculo para o preço base a ser usado no cáculo da média.
RENKO PRICE ACTION ATR is an "Expert Advisor" developed through the construction of the Renko Chart where each BRICK has the size calculated through the ATR of the period selected by the user. Renko charts are designed to filter out minor price movements, thus making it easier for traders to focus on important trends. Due to its efficiency in detecting price trends, it is also possible to clearly identify supports and resistances as well as top and bottom divergences, thus making better use of t
Point and Fignure (P&F) chart plots price against changes in direction by plotting a column of Xs as the price rises and a column of Os as the price falls. Features Support for several kinds of price types - High/Low and Close. Clean and easy-to-read chart. Displays column high and low prices as indicator values. Support for both 4 and 5-digit brokers. Customizeable colors. Advantages Filter insignificant price movements and noise. Less noise and more stable work. Focus on important price move
The   Visual Volatility Clustering   indicator clusters the market based on volatility. The indicator does not redraw and gives accurate data, does not use closing prices. Uses the opening prices or the highs or lows of the previous completed bar. Therefore, all information will be clear and unambiguous. The essence of the indicator is to divide the price market into certain areas according to a similar type of volatility. This can be done in any way. In this example, the indicator is configure
Fibonacci Auto
Makarii Gubaydullin
Belirtilen zaman dilimindeki Yüksek ve Düşük fiyatlara dayanarak otomatik olarak Fibo seviyelerini çizer Çoklu çubuklar   birleştirilebilir: örneğin, 10 günlük Yüksek ve Düşük fiyatlara dayalı bir Fibo elde edebilirsiniz Benim   #1   Aracım : 66+ özellik, bu gösterge dahil  |   Sorularınız için  iletişime geçin  |    MT4 sürümü Potansiyel dönüş seviyelerini görmeye yardımcı olur; Fibo seviyelerinde oluşan formasyonlar genellikle daha güçlüdür; Manuel   çizim   için   harcanan   zamanı   önemli  
HLC bar MT5 Wyckoff
Eduardo Da Costa Custodio Santos
MT5 için "HLC_bar_MT5 Wyckoff" göstergesi, işlem sırasında analizi kolaylaştırmak için oluşturulmuştur. HLC Çubuğu Richard Wyckoff tarafından kullanılmıştır ve şu anda "VSA" operasyonlarında yaygın olarak kullanılmaktadır. Wyckoff, Yüksek, Düşük ve Yakın kullanmanın grafiği çok daha temiz ve analiz etmeyi kolaylaştırdığını buldu. "HLC_bar_MT5 Wyckoff" Göstergesi şunları sağlar: # Çubuk genişliğini değiştirin; # Çubuğu aynı renkte bırakın; # Ve aynı fiyattan açılan ve kapanan çubuğu vurgulayın. R
Genel Açıklama Bu gösterge, klasik Donchian Kanalı ’nın geliştirilmiş bir versiyonudur ve gerçek işlem için pratik işlevlerle zenginleştirilmiştir. Standart üç çizgiye (üst, alt ve orta çizgi) ek olarak sistem breakout (fiyat kırılımı) noktalarını tespit eder ve bunları grafikte oklarla görsel olarak gösterir. Ayrıca grafiği sadeleştirmek için mevcut trend yönünün tersindeki çizgi yalnızca görüntülenir. Gösterge şunları içerir: Görsel sinyaller : Kırılım sırasında renkli oklar Otomatik bildiriml
FREE
L'indicatore SMC Venom Model BPR è uno strumento professionale per i trader che operano nell'ambito del concetto di Smart Money (SMC). Identifica automaticamente due modelli chiave sul grafico dei prezzi: FVG   (Fair Value Gap) è una combinazione di tre candele, in cui c'è un gap tra la prima e la terza candela. Forma una zona tra livelli in cui non c'è supporto di volume, il che spesso porta a una correzione dei prezzi. BPR   (Balanced Price Range) è una combinazione di due modelli FVG che for
Sonic R Pro Enhanced EA - Sürüm 2025 249$ - Sadece ilk 5 alıcıya özel! Canlı Sinyal Sonic R Pro Enhanced'in canlı performansını kontrol et: Ticaret Stratejisi Sonic R Pro Enhanced, Dragon Band (EMA 34 ve EMA 89) ile otomatik ticaret yapan Sonic R stratejisinin geliştirilmiş bir versiyonudur. Gelişmiş algoritmalarla maksimum performans sağlar. Zaman Dilimleri: M15, M30 Desteklenen Pariteler: XAUUSD, BTCUSD, AUDJPY, USDJPY Ticaret Tarzı: Swing Trading - Geri Çekilme ve Karşı Trend Minimu
AUTO FIBONACCI MULTI-TIMEFRAME TOOLKIT Technical analysis tool that automatically draws Fibonacci levels for 4H, Daily, Weekly, and Monthly sessions. AUTOMATIC FIBONACCI RETRACEMENTS (7 CLASSIC LEVELS): - 0.0% (Previous session Low - support level) - 23.6% (Fibonacci Golden Ratio - early entry level) - 38.2% (Strong retracement level) - 50.0% (Key pivot level highlighted in YELLOW - market equilibrium) - 61.8% (Main Golden Ratio - critical decision level) - 78.6% (Deep retracement level) - 100.0
Are you tired of drawing trendlines every time you're analyzing charts? Or perhaps you would like more consistency in your technical analysis. Then this is for you. This indicator will draw trend lines automatically when dropped on a chart. How it works Works similar to standard deviation channel found on mt4 and mt5. It has 2 parameters: 1. Starting Bar 2. Number of bars for calculation The   starting bar   is the bar which drawing of the trend lines will begin, while the   number of bars for c
FREE
Renko is a well-known Japanese charting technique that removes time from the chart. Instead of drawing bars in constant intervals (time) as a normal chart would, a Renko chart does so only when price moves beyond a predefined amount. In a Renko chart, a bar is created when price exceeds the previous bar’s high or low by a predefined amount or what we call the Box Size. The result is a chart with equally sized bars running up or down in 45 degree angles. Such a chart offers the following advant
Momentum Ninja Advanced MT5
Mohammed Maher Al-sayed Mohammed Ahmed Saleh
Momentum Ninja Advanced MT5 This indicator is an enhanced version of the classic Momentum indicator.  Main features: - Based on NinjaTrader-style momentum logic. - Uses EMA-based smoothing for cleaner and more stable readings. - Displays dynamic color changes to highlight bullish and bearish strength. - Sends alerts when the momentum crosses above or below zero. - Fully customizable and completely non-repainting. - Lightweight and optimized for all symbols and timeframes. How it differs from t
Bu ürünün alıcıları ayrıca şunları da satın alıyor
Bu indikatörü satın alırsanız, Profesyonel Trade Manager’ımı  + EA ÜCRETSİZ olarak alacaksınız. Öncelikle, bu Ticaret Sistemi'nin Non-Repainting, Non-Redrawing ve Non-Lagging Göstergesi olduğunu vurgulamak önemlidir, bu da hem manuel hem de robot ticareti için ideal hale getirir. Online kurs, kılavuz ve ön ayarları indir. "Smart Trend Trading System MT5", yeni ve deneyimli tüccarlar için özelleştirilmiş kapsamlı bir ticaret çözümüdür. 10'dan fazla premium göstergeyi birleştiriyor ve 7'den fazla
Power Candles – Tüm Piyasalar İçin Güce Dayalı Giriş Sinyalleri Power Candles , Stein Investments’ın kanıtlanmış güç analizini doğrudan fiyat grafiğinize taşır. Sadece fiyata tepki vermek yerine, her mum gerçek piyasa gücüne göre renklendirilir. Bu sayede momentum birikimleri, güç hızlanmaları ve net trend geçişleri anında görülebilir. Tüm Piyasalar İçin Tek Mantık Power Candles tüm işlem sembollerinde otomatik olarak çalışır. Gösterge, mevcut sembolün Forex mi yoksa Forex dışı bir piyasa mı old
Divergence Bomber
Ihor Otkydach
4.9 (79)
Bu göstergeyi satın alan herkese aşağıdaki ekstra içerikler ücretsiz olarak sunulmaktadır: Her işlemi otomatik olarak yöneten, Stop Loss ve Take Profit seviyelerini ayarlayan ve işlemleri strateji kurallarına göre kapatan özel yardımcı araç: "Bomber Utility" Göstergenin farklı varlıklar üzerinde kullanılmasına yönelik ayar dosyaları (set dosyaları) Bomber Utility için 3 farklı modda kullanım sunan ayar dosyaları: "Minimum Risk", "Dengeli Risk" ve "Bekle-Gör Stratejisi" Bu ticaret stratejisini hı
*** Entry In The Zone ve SMC Multi Timeframe, Smart Money Concepts (SMC) çerçevesine dayalı olarak geliştirilmiş gerçek zamanlı bir piyasa analiz aracıdır. Entry In The Zone ve SMC Multi Timeframe, yatırımcıların piyasa yapısını daha sistematik ve net bir şekilde analiz etmelerine yardımcı olmak, işlem verimliliğini artırmak ve stratejiniz için uzun vadeli sürdürülebilirlik yaratmak amacıyla geliştirilmiştir. Bu araç, Smart Money Concepts (SMC) çerçevesine dayanmaktadır. Birden fazla zaman dilim
ÜCRETSİZ AUX Göstergesi ve EA Desteğini Alın  Doğrudan indirme — Buraya tıklayın [ D.I.C.E ] The DICE Indicator  Divergence in Chaos Environment, Elliott Dalga Teorisi’ni Trading Chaos teknikleriyle birleştiren trader’lar için geliştirilmiş özel bir MT5 aracıdır. Bill Williams’ın tanımladığı kaotik piyasa ortamıyla senkronize olarak fiyat hareketlerindeki gizli ve normal uyumsuzlukları tespit eder. Ana Özellikler Elliott Dalgası Uyumlu Uyumsuzluk: Dalga yapılarıyla uyumlu boğa ve ayı uyumsuzluk
Atomic Analyst MT5
Issam Kassas
4.19 (27)
Öncelikle belirtmek gerekir ki bu Ticaret Göstergesi Yeniden Çizim Yapmaz, Gecikmez ve Gecikme Göstermez, bu da hem manuel hem de robot ticareti için ideal hale getirir. Kullanıcı kılavuzu: ayarlar, girişler ve strateji. Atom Analisti, Piyasada Daha İyi Bir Avantaj Bulmak İçin Fiyatın Gücünü ve Momentumunu Kullanan PA Fiyat Hareketi Göstergesidir. Gürültüleri ve Yanlış Sinyalleri Kaldırmaya ve Ticaret Potansiyelini Artırmaya Yardımcı Olan Gelişmiş Filtrelerle Donatılmıştır. Birden fazla katmanl
Quantum Trend Sniper
Bogdan Ion Puscasu
4.74 (53)
Tanıtım       Kuantum Trend Keskin Nişancı Göstergesi   , trend tersine dönmeleri belirleme ve ticaret yapma şeklinizi değiştiren çığır açan MQL5 Göstergesi! 13 yılı aşkın ticaret tecrübesine sahip deneyimli tüccarlardan oluşan bir ekip tarafından geliştirilmiştir.       Kuantum Trend Keskin Nişancı Göstergesi       trend dönüşlerini son derece yüksek doğrulukla belirlemenin yenilikçi yolu ile ticaret yolculuğunuzu yeni zirvelere taşımak için tasarlanmıştır. ***Kuantum Trend Keskin Nişancı Göst
Protect against whipsaws: revolutionize your swing trading approach Swing Trading is the first indicator designed to detect swings in the direction of the trend and possible reversal swings. It uses the baseline swing trading approach, widely described in trading literature. The indicator studies several price and time vectors to track the aggregate trend direction and detects situations in which the market is oversold or overbought and ready to correct. [ Installation Guide | Update Guide | Tro
Trend Screener Pro MT5
STE S.S.COMPANY
4.84 (100)
Trend Göstergesi, Trend Alım Satım ve Filtreleme için Çığır Açan Benzersiz Çözüm, Tüm Önemli Trend Özellikleriyle Tek Bir Araç İçinde Yerleştirildi! Forex, emtialar, kripto para birimleri, endeksler ve hisse senetleri gibi tüm sembollerde/araçlarda kullanılabilen %100 yeniden boyamayan çoklu zaman çerçevesi ve Çoklu para birimi göstergesidir. Trend Screener, grafikte noktalarla ok trend sinyalleri sağlayan etkili bir trend trend göstergesidir. Trend analizörü göstergesinde bulunan özellikler: 1.
Azimuth Pro
Ottaviano De Cicco
5 (1)
LAUNCH PROMO Azimuth Pro price is initially set at 299$ for the first 100 buyers. Final price will be 499$ . THE DIFFERENCE BETWEEN RETAIL AND INSTITUTIONAL ENTRIES ISN'T THE INDICATOR — IT'S THE LOCATION. Most traders enter at arbitrary price levels, chasing momentum or reacting to lagging signals. Institutions wait for price to reach structured levels where supply and demand actually shift. Azimuth Pro maps these levels automatically: swing-anchored VWAP, multi-timeframe structure lines, an
SuperScalp Pro
Van Minh Nguyen
5 (1)
SuperScalp Pro – Gelişmiş Çoklu Filtreli Scalping Gösterge Sistemi SuperScalp Pro, klasik Supertrend ile çok sayıda akıllı onay filtresini birleştiren gelişmiş bir scalping gösterge sistemidir. Gösterge M1’den H4’e kadar tüm zaman dilimlerinde verimli çalışır ve özellikle XAUUSD, BTCUSD ve ana Forex pariteleri için uygundur. Bağımsız bir sistem olarak kullanılabilir veya mevcut ticaret stratejilerine esnek şekilde entegre edilebilir. Gösterge, hız ve yavaş EMA’lar, trend belirleyen üç EMA, EMA e
FX Power MT5 NG
Daniel Stein
5 (29)
FX Power: Daha Akıllı Ticaret Kararları için Para Birimlerinin Gücünü Analiz Edin Genel Bakış FX Power , her piyasa koşulunda başlıca para birimlerinin ve altının gerçek gücünü anlamak için vazgeçilmez bir araçtır. Güçlü para birimlerini alıp zayıf olanları satarak, FX Power ticaret kararlarınızı basitleştirir ve yüksek olasılıklı fırsatları ortaya çıkarır. İster trendlere sadık kalın ister Delta'nın aşırı değerlerini kullanarak tersine dönüşleri öngörün, bu araç ticaret tarzınıza mükemmel bir
Super Signal – Skyblade Edition Profesyonel No-Repaint / Gecikmesiz Trend Sinyal Sistemi, Olağanüstü Kazanma Oranı ile | MT4 / MT5 için 1 dakika, 5 dakika ve 15 dakika gibi daha düşük zaman dilimlerinde en iyi şekilde çalışır. Temel Özellikler: Super Signal – Skyblade Edition, özellikle trend bazlı işlemler için geliştirilmiş akıllı bir sinyal sistemidir. Yalnızca güçlü, yönlü ve gerçek momentum destekli piyasa hareketlerini tespit etmek amacıyla çok katmanlı bir filtreleme yapısı kullanır.
Smart Stop Indicator – Stop-loss düzeylerini doğrudan grafikte akıllı ve hassas şekilde belirleyin Genel Bakış Smart Stop Indicator, stop-loss seviyesini tahmin ederek veya sezgilere güvenerek değil, net ve sistematik bir şekilde belirlemek isteyen traderlar için özel olarak geliştirilmiştir. Bu araç, klasik price-action mantığını (yükselen tepeler, düşen dipler) modern breakout algılama ile birleştirerek bir sonraki mantıklı stop seviyesini belirler. Trendlerde, yatay piyasalarda veya hızlı k
Trend indicator AI mt5
Ramil Minniakhmetov
5 (13)
Trend Ai göstergesi, trend tanımlamasını işlem yapılabilir giriş noktaları ve geri dönüş uyarılarıyla birleştirerek bir yatırımcının piyasa analizini geliştirecek harika bir araçtır. Bu gösterge, kullanıcıların forex piyasasının karmaşıklıklarında güvenle ve hassasiyetle yol almalarını sağlar. Birincil sinyallerin ötesinde, Trend Ai göstergesi geri çekilmeler veya düzeltmeler sırasında ortaya çıkan ikincil giriş noktalarını belirleyerek, yatırımcıların belirlenen trend içindeki fiyat düzeltmele
Grabber System MT5
Ihor Otkydach
4.81 (21)
Size mükemmel bir teknik gösterge olan Grabber’ı tanıtıyorum. Bu araç, kullanıma hazır bir “her şey dahil” işlem stratejisi olarak çalışır. Tek bir yazılım kodu içinde güçlü piyasa teknik analiz araçları, işlem sinyalleri (oklar), uyarı işlevleri ve push bildirimleri entegre edilmiştir. Bu göstergeyi satın alan herkes aşağıdaki hediyeleri ücretsiz olarak alır: Açık emirleri otomatik yönetmek için Grabber Yardımcı Aracı Kurulum, yapılandırma ve nasıl işlem yapılacağını adım adım anlatan video kıl
Quantum TrendPulse
Bogdan Ion Puscasu
5 (20)
SuperTrend   ,   RSI   ve   Stochastic'in   gücünü tek bir kapsamlı göstergede birleştirerek işlem potansiyelinizi en üst düzeye çıkaran nihai işlem aracı olan   Quantum TrendPulse'u   tanıtıyoruz. Hassasiyet ve verimlilik arayan yatırımcılar için tasarlanan bu gösterge, piyasa trendlerini, momentum değişimlerini ve en uygun giriş ve çıkış noktalarını güvenle belirlemenize yardımcı olur. Temel Özellikler: SuperTrend Entegrasyonu:   Güncel piyasa trendlerini kolayca takip edin ve karlılık dalgası
FX Levels MT5
Daniel Stein
5 (12)
FX Levels: Tüm Piyasalar İçin Son Derece Hassas Destek ve Direnç Hızlı Bakış Döviz kurları, endeksler, hisseler veya emtialar gibi herhangi bir piyasada güvenilir destek ve direnç seviyeleri belirlemek mi istiyorsunuz? FX Levels geleneksel “Lighthouse” yöntemini ileri düzey bir dinamik yaklaşımla birleştirerek neredeyse evrensel bir doğruluk sağlar. Gerçek broker deneyimimize ve otomatik günlük güncellemeler ile gerçek zamanlı güncellemelerin birleşimine dayalı olarak, FX Levels size dönüş nok
Gold Sniper Scalper Pro
Ich Khiem Nguyen
3.5 (8)
Gold Sniper Scalper Pro, trader'ların giriş noktalarını belirlemesine ve riski etkili bir şekilde yönetmesine destek olmak için tasarlanmış MetaTrader 5 için profesyonel bir göstergedir. Gösterge, sinyal tespit sistemi, otomatik Entry/SL/TP yönetimi, hacim analizi ve gerçek zamanlı performans istatistikleri içeren kapsamlı bir analiz araçları seti sunar. Sistemi anlamak için kullanım kılavuzu   |   Diğer diller için kullanım kılavuzu ANA ÖZELLİKLER Sinyal tespit sistemi Gösterge, price action a
" Dynamic Scalper System MT5 " göstergesi, trend dalgaları içinde işlem yapmak için scalping yöntemi için tasarlanmıştır. Başlıca döviz çiftleri ve altın üzerinde test edilmiştir, diğer işlem araçlarıyla uyumluluğu mümkündür. Ek fiyat hareketi desteğiyle trend boyunca pozisyonların kısa vadeli açılması için sinyaller sağlar. Göstergenin prensibi. Büyük oklar trend yönünü belirler. Küçük oklar şeklinde scalping için sinyaller üreten bir algoritma trend dalgaları içinde çalışır. Kırmızı oklar yü
MetaForecast M5
Vahidreza Heidar Gholami
5 (3)
MetaForecast, fiyat verilerindeki harmonileri kullanarak herhangi bir piyasanın geleceğini tahmin eder ve görselleştirir. Piyasa her zaman tahmin edilemezken, fiyatlarda bir desen varsa, MetaForecast geleceği mümkün olduğunca doğru bir şekilde tahmin edebilir. Benzer ürünlere göre, MetaForecast piyasa eğilimlerini analiz ederek daha kesin sonuçlar üretebilir. Giriş Parametreleri Past size (Geçmiş boyut) MetaForecast'ın gelecekteki tahminler oluşturmak için kullandığı çubuk sayısını belirtir. Mo
MT4 / MT5 için Astronomi Göstergesini Tanıtıyoruz: En İleri Göksel Ticaret Arkadaşınız Ticaret deneyiminizi göksel seviyelere yükseltmeye hazır mısınız? MT4 için devrim niteliğindeki Astronomi Göstergemizi arayın. Bu yenilikçi araç karmaşık algoritmaları kullanarak eşsiz astronomik içgörüler ve hassas hesaplamalar sunmak için geleneksel ticaret göstergelerini aşmaktadır. Bilgi Evreni Parmaklarınızın Ucunda:   Göksel verilerin hazinelerini açığa çıkaran kapsamlı bir paneli gözlemleyin. Gezegenl
Market Structure Patterns
Samuel Manoel De Souza
4.47 (19)
Uygun sürümler:   MT4   ve   MT5 . Market Structure Patterns kanalına katılın – çalışma materyallerini indirin ve ek bilgiler edinin. İlgili gönderiler: Market Structure Patterns – Giriş Şimdi %50 indirimle edinin | Önceki fiyat 90 $ | Kampanya 31 Aralık tarihine kadar geçerlidir | Büyük bir güncelleme yakında geliyor ve orijinal fiyat güncellenecektir. Market Structure Patterns , smart money concepts (akıllı para kavramları) temelinde geliştirilen ve SMC/ICT öğelerini grafik üzerinde gösteren
IX Power MT5
Daniel Stein
4.92 (12)
IX Power: Endeksler, Emtialar, Kripto Paralar ve Forex Piyasaları için İçgörüler Genel Bakış IX Power , endeksler, emtialar, kripto paralar ve forex sembollerinin gücünü analiz etmek için tasarlanmış çok yönlü bir araçtır. FX Power , tüm kullanılabilir döviz çiftlerinin verilerini kullanarak döviz çiftleri için maksimum doğruluk sağlarken, IX Power yalnızca temel sembolün piyasa verilerine odaklanır. Bu, IX Power 'ı forex dışındaki piyasalar için ideal ve daha basit forex analizleri için güven
Trade smarter, not harder: Empower your trading with Harmonacci Patterns This is arguably the most complete harmonic price formation auto-recognition indicator you can find for the MetaTrader Platform. It detects 19 different patterns, takes fibonacci projections as seriously as you do, displays the Potential Reversal Zone (PRZ) and finds suitable stop-loss and take-profit levels. [ Installation Guide | Update Guide | Troubleshooting | FAQ | All Products ] It detects 19 different harmonic pri
- Real price is 80$ - 45% Discount (It is 45$ now) Contact me for extra bonus   indicator, instruction or any questions! - Lifetime update free - Non-repaint - Related product: Gann Gold EA - I just sell my products in Elif Kaya Profile, any other websites are stolen old versions, So no any new updates or support. Advantages of  M1 Scalper Pro  Profitability: M1 Scalper Pro is highly profitable with a strict exit strategy. Frequent Opportunities: M1 Scalper Pro  takes advantage of numerous smal
Support And Resistance Screener, MetaTrader için tek bir gösterge içinde birden fazla araç sağlayan tek bir Düzey göstergesindedir. Kullanılabilir araçlar şunlardır: 1. Piyasa Yapısı Eleme Aracı. 2. Geri Çekilme Bölgesi Boğa. 3. Geri Çekilme Bölgesi Ayı. 4. Günlük Pivot Noktaları 5. haftalık Pivot Noktaları 6. aylık Pivot Puanları 7. Harmonik Modele ve hacme dayalı Güçlü Destek ve Direnç. 8. Banka Seviyesi Bölgeleri. SINIRLI SÜRELİ TEKLİF : YG Destek ve Direnç Göstergesi sadece 50 $ ve ömür boyu
ARIPoint
Temirlan Kdyrkhan
1 (1)
ARIPoint is a powerful trading companion designed to generate high-probability entry signals with dynamic TP/SL/DP levels based on volatility. Built-in performance tracking shows win/loss stats, PP1/PP2 hits, and success rates all updated live. Key Features: Buy/Sell signals with adaptive volatility bands Real-time TP/SL/DP levels based on ATR Built-in MA Filter with optional ATR/StdDev volatility Performance stats panel (Success, Profit/Loss, PP1/PP2) Alerts via popup, sound, push, or email Cu
Trend Forecaster
Alexey Minkov
5 (7)
The Trend Forecaster indicator utilizes a unique proprietary algorithm to determine entry points for a breakout trading strategy. The indicator identifies price clusters, analyzes price movement near levels, and provides a signal when the price breaks through a level. The Trend Forecaster indicator is suitable for all financial assets, including currencies (Forex), metals, stocks, indices, and cryptocurrencies. You can also adjust the indicator to work on any time frames, although it is recommen
Shock Pullback
Suleiman Alhawamdah
5 (1)
Basitçe söylemek gerekirse, mevcut mum çubuğunun yanında “pip” olarak bilinen beyaz sayıların hareketi görünmeye başladığında işlem yapmaya başlayabilirsiniz. Beyaz “pip”ler, bir alım veya satım işleminin şu anda aktif olduğunu ve beyaz renkleriyle belirtildiği gibi doğru yönde ilerlediğini gösterir. Beyaz pip hareketi durduğunda ve sabit yeşil renge dönüştüğünde, bu mevcut ivmenin sona erdiğini gösterir. Sayıların yeşil rengi, alım veya satım işlemiyle elde edilen toplam kârı “pip” cinsinden t
Yazarın diğer ürünleri
//////////////////////////////////////////////// ////////////////////////////////// An improved version of the standard Bulls Power and Bears Power indicators. Now it's two in one. The setup is simple - you just need to specify the period. It is also very easy to understand the readings of this indicator, a signal above zero is a buy, and below it is a sell. //////////////////////////////////////////////// /////////////////////////////////// I hope this indicator will be very useful to you
FREE
The indicator now includes vertical volumes. !!!! The indicator now includes a forecasting module !!!!. If you want to stop annoying messages use this expert together with the purchased paid indicator "V-Scale Live Trainer". Manual trading only. A simple expert makes traders lives easier. Note: To use it, just enable one-click trading. And don't forget to disable AUTO_TRADE. With each new start of the terminal, the metatrader 4, immediately, about two times, switch between all the timeframes i
FREE
//////////////////////////////////////////////// ////////////////////////////////// An improved version of the standard Average True Range indicator. It is now a responsive and smoothed line. The setup is not straightforward - but I hope you can do it. It is very easy to understand the readings of this indicator, the meaning is the same as that of the standard Average True Range. //////////////////////////////////////////////// /////////////////////////////////// I hope this indicator will
FREE
This expert is designed to work in pairs with the same indicator. https://www.mql5.com/ru/market/product/34836 The expert does not display anything on the screen and does not trade. It only performs calculations for the indicator, this is done to save your computer resources. Since the expert works with symbols from Market Watch, there is no way to test it in the tester. Instructions for use: 0) Select the required symbols in the Market Watch, which will be displayed in the indicator. (Note: !!
FREE
An improved version of the standard Standard Deviation indicator. It is now a responsive and smoothed line. The setup is not straightforward - but I hope you can do it. It is very easy to understand the readings of this indicator, the meaning is the same as that of the usual Standard Deviation. //////////////////////////////////////////////// /////////////////////////////////// I hope this indicator will be very useful to you in successful trading. Good luck.
FREE
This expert is designed to work in pairs with the same indicator. https://www.mql5.com/ru/market/product/34834 The expert does not display anything on the screen and does not trade. It only performs calculations for the indicator, this is done to save your computer resources. Since the expert works with symbols from Market Watch, there is no way to test it in the tester. Instructions for use: 0) Select the required symbols in the Market Watch, which will be displayed in the indicator. (Note: !!
FREE
//////////////////////////////////////////////// //////////////////////////////////////////////// ///////////////////////////////////// Go My Way is an ultra-accurate indicator of trend direction or price movement. This indicator is calculated on the basis of a dozen other indicators and has a very complex mechanism. //////////////////////////////////////////////// //////////////////////////////////////////////// ///////////////////////////////////// The settings are very simple, but it is
//////////////////////////////////////////////// ////////////////////////////////// This indicator uses polynomial regression to plot three channels and six lines accordingly. The first channel and its borders with a large period, the second with an average and the third with a small period. The setup is simple - you only need to specify the colors and enable / disable the display of price labels. It is also very easy to understand the readings of this indicator. Channel lines are used to set s
It's very simple - there are no settings. It is required to specify only the colors and the size of the arrows. It is also very easy to understand the readings of this indicator. An up arrow is a buy signal, and a down arrow is a sell signal. Try to test it in the strategy tester - you'll like it !!! //////////////////////////////////////////////// /////////////////////////////////// I hope this indicator will be very useful to you in successful trading. Good luck.
//////////////////////////////////////////////// ////////////////////////////////// An improved version of the standard Average True Range indicator. This is now double the precision and a colored a veraging  line. The setup is quite simple - you need to specify the main period and the averaging period. It is very easy to understand the readings of this indicator, the meaning is the same as that of the standard Average True Range. //////////////////////////////////////////////// //////////
//////////////////////////////////////////////// ////////////////////////////////// This indicator displays the range of price changes in 1 minute. Great for risk management. This is an improved version of the standard Average True Range indicator for Tick Chart. This is now double the precision and a colored averaging line. The setting is quite simple - you just need to change the colors if necessary. It is very easy to understand the readings of this indicator, the meaning is the same as
///////////////////////////////////////////// ////////////////////////////// Bu gösterge, doğrusal olmayan bir polinom regresyon kanalını görüntüler. Yıldırım gibi çok hızlı çalışır. Özellikle OpenCL hızlandırma teknolojisini kullanırken. Bu göstergenin özel bir versiyonu yakında sunulacak ve bu da bir süre sonra fiyatı da tahmin edecek. Bunlar uyarlanabilir ve pürüzsüz renkli çizgilerdir. Bu gösterge için dört seçenek vardır: 1) 1 saniyelik zaman dilimi 2) 2 saniyelik zaman aralığı 3) 12 saniy
Filtrele:
İnceleme yok
İncelemeye yanıt