Tick Poly Regression Channel

///////////////////////////////////////////// //////////////////////////////

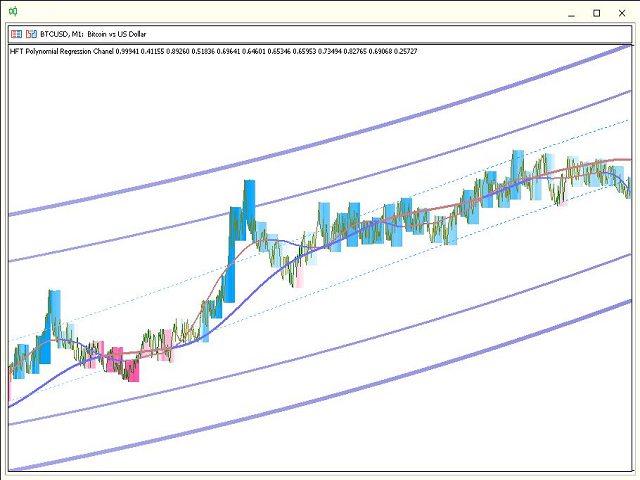
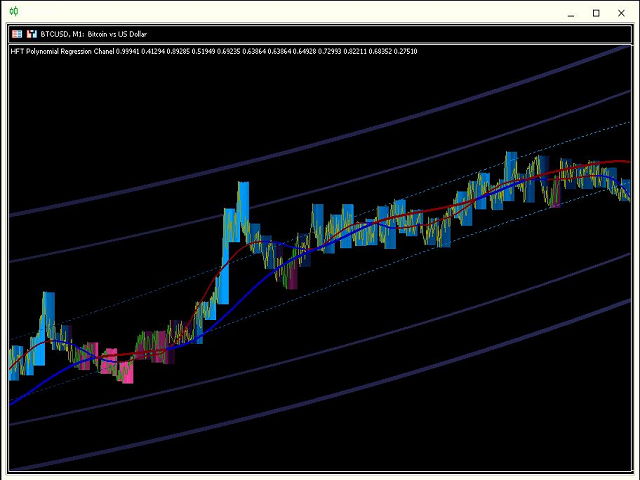
Bu gösterge, doğrusal olmayan bir polinom regresyon kanalını görüntüler. Yıldırım gibi çok hızlı çalışır. Özellikle OpenCL hızlandırma teknolojisini kullanırken.

Bu göstergenin özel bir versiyonu yakında sunulacak ve bu da bir süre sonra fiyatı da tahmin edecek.

Bunlar uyarlanabilir ve pürüzsüz renkli çizgilerdir.

Bu gösterge için dört seçenek vardır:

1) 1 saniyelik zaman dilimi

2) 2 saniyelik zaman aralığı

3) 12 saniyelik zaman aralığı

4) grafik zaman aralığı

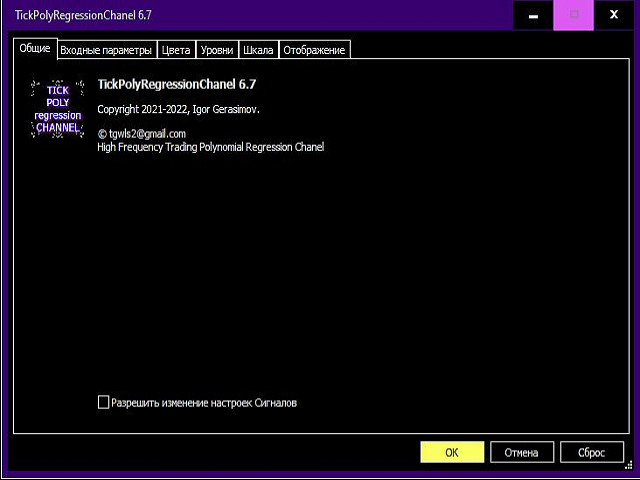
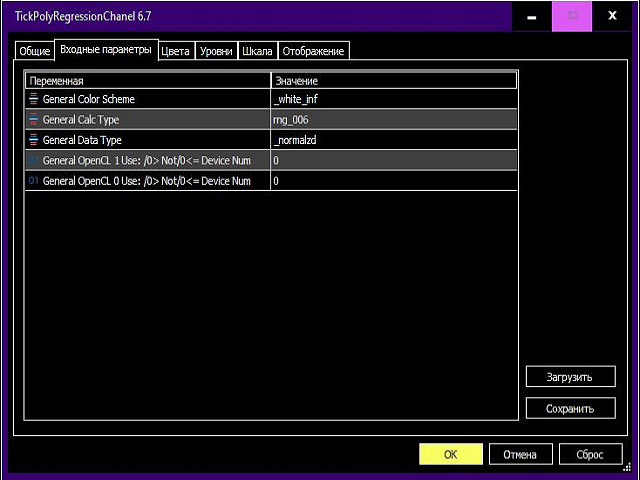
Tüm ayarlar çok basittir, bunlardan başlıcaları şunlardır:

0) zaman dilimlerinin seçimi

1) veri normalleştirme türünün seçimi.

2) OpenCL hızlandırıcı seçimi

3) diğer basit ayarlar.

Dilerseniz renkleri de değiştirebilirsiniz.

Bu göstergenin okumalarını anlamak çok basittir, mavi - al, kırmızı - sat.

Ayrıca, ayrıca eğim açısına bağlı olarak renk değiştiren kanal çizgileri de oluşturabilirsiniz.

Bu göstergeyi kullanmak için, kalıpları bulmak ve anlamak için çalışmalarını kısa bir süre gözlemlemek yeterlidir. Bu göstergeyi kullanmak, ticaretinizin verimliliğini artıracaktır.

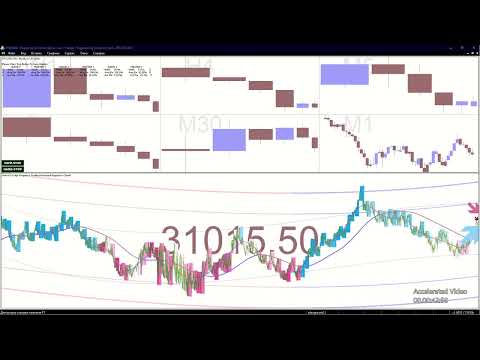
Bu gösterge strateji test cihazında çalışmaz, bu nedenle olasılıkları göstermek için videoyu izleyin.

///////////////////////////////////////////// ///////////////////////////////

Bu göstergeyi kullanmak için bilgisayarınız için minimum donanım gereksinimleri vardır:

1) İşlemcinin 4'ten fazla çekirdeğe sahip olması,

2) RAM miktarı 2 gigabayttan fazla.

3) Hızlandırılmış ve rahat kullanım için tercih edilir.

minimum OpenCL 2.0 standardını destekleyen modern bir video kartı kullanın

///////////////////////////////////////////// //////////////////////////////

Umarım bu gösterge başarılı ticarette sizin için çok faydalı olacaktır.


İyi şanlar.

Önerilen ürünler
Displays trends in current chart. You can display trends of multiple timeframes in one chart by inserting this indicator as often as you want. Key features: displays trend line by finding highs and lows counts number of high/low of current trend in different color (long/short) allows you to display multiple timeframe trends in one chart Settings: Indicator Name: if you want to show M5 and H1 on one chart add TITrend twice to your current chart and rename M5 to "TITrendM5" and H1 to "TITrendH1" C
Murrey Math Lines The concept of this technical analysis system was developed by T. Henning Murrey in 1995 and described in The Murrey Math Trading System; For All Markets. The main concept here is that all markets behave in the same manner based upon the observations made by W.D. Gann. To date, the Murrey Math Line X it is one the most popular methods of Forex analysis and trading. Formula The Murrey Math Line X is calculated with the help of price movement segment, which, in accordance to Gan
My Pivot
Ashok Kumar Singha
My Pivot is an Indicator based on Pivot Lines and Support-Resistance zones. This Indicator will Plot 11 SR zones including Pivot Line which will definitely help you to understand the exact SR zones of the Market. Steps to Setup the Indicator: Install the Custom Indicator; Set all the Lines Color, Width and Styles; Set visualization to All Timeframe; and DONE It can be used for: All Pairs: Forex, Cryptocurrencies, Metals, Stocks, Indices.  All Timeframe All Brokers All type of Trading S
Limitless MT5
Dmitriy Kashevich
Limitless MT5 is a universal indicator suitable for every beginner and experienced trader. works on all currency pairs, cryptocurrencies, raw stocks Limitless MT5 - already configured and does not require additional configuration And now the main thing Why Limitless MT5? 1 complete lack of redrawing 2 two years of testing by the best specialists in trading 3 the accuracy of correct signals exceeds 80% 4 performed well in trading during news releases Trading rules 1 buy signal - the ap
FiboChampion
Marius Ovidiu Sunzuiana
The Next Evolution in Fibonacci Intelligence FiboChampion  isn’t just another Fibonacci tool—it’s a paradigm shift in how traders interpret price action. Engineered for precision and adaptability, this advanced indicator fuses quantum-inspired logic , machine-learned pattern recognition , and non-linear Fibonacci geometry to uncover market turning points with uncanny accuracy. What Sets FiboChampion Apart: Non-Linear Fibonacci Mapping : Goes beyond static retracements by adapting to fractal m
Indicator Monthly Levels + Pin Bar Pro Description The Monthly Levels + Pin Bar Pro indicator combines the power of monthly key levels (High, Low, Open, Close) with automatic detection of Price Action reversal patterns (Pin Bars) . Designed for technical and institutional traders, it helps anticipate market reaction zones and generates clear visual signals directly on the chart. Main Features Automatic monthly levels : High, Low, Open, Close. Pin Bar detection (bullish & bearish) in r
The combined Levels Ib DTZ indicator helps to determine the trend direction when trading. Displaying signals on the chart about a possible upcoming trend change. The indicator is a combination of Fibonacci levels with overbought and oversold zones and a trend indicator based on ZigZag and ATR indicators. The Levels Ib DTZ indicator helps traders predict future price movements and adjust their strategy accordingly. It works on all timeframes.
FTFC, Rob Smith'in   The Strat   tarafından tanımlandığı şekliyle Tam Zaman Çerçevesi Sürekliliği anlamına gelir. Bu gösterge grafikte iki çizgi çizer; Üç Aylık, Aylık, Haftalık, Günlük veya Saatlik açılış seviyelerinin en yükseği ve bu değerlerin en küçüğünün ikincisi. Bu size, ticaretin tek yönde çok güçlü olma olasılığının daha yüksek olduğu bir kanal verir. Satırlar arasında fiyat hareketi daha dalgalı olacak ve daha geniş stoplar kullanabilirsiniz. Yükselişler ve düşüşler arasındaki orta no
Kingtrend
Antonio Blazquez
KingTrend — Price Action Trend Analysis Tool KingTrend is a trend-following indicator based on long-standing price action principles involving Highs, Lows, Open, and Close. The logic behind this tool comes from concepts passed on to me by my mentor and translated into code for consistent structure recognition. Features: Identifies market structure using price action logic Detects trend direction and key turning points Marks Higher Highs, Lower Lows, and extensions Suitable for discretionary or
Engulfing with EMAs Indicator Unlock the power of advanced candlestick pattern detection with the Engulfing with EMAs Indicator , a cutting-edge tool designed for MetaTrader 5. This futuristic indicator combines the precision of engulfing pattern analysis with the trend-following strength of Exponential Moving Averages (EMA 21 and EMA 50), empowering traders to identify high-probability setups across all currency pairs and timeframes. Key Features: Comprehensive Engulfing Detection : Detects b
Rivoluziona il Tuo Trading con l'Indicatore di Segnali Scalping su Timeframe Multipli   Scopri il segreto del successo nel trading con il nostro esclusivo indicatore di SEGNALI scalping su timeframe multipli. Questo strumento avanzato è progettato per trovare segnali efficienti e precisi, aiutandoti a massimizzare i profitti e a ridurre i rischi associati al trading veloce L'indicatore di segnali Alien Scalper MTF è uno strumento di analisi tecnica altamente efficace, progettato per identificare
Anchored Linear Regression Channel
Jorge Adalberto Do Valle Junior
English: Anchored Linear Regression Channel (ALRC) Description: The Anchored Linear Regression Channel (ALRC) is an advanced technical analysis tool that enhances the traditional linear regression channel by allowing it to be anchored to a confirmed pivot point. This provides a more accurate and reliable reading of price behavior in relation to key structural points on the chart. Key Features: Anchoring to Confirmed Pivots: Manually select a significant pivot to fix the channel, ensuring t
Ticks Candles Chart indicator build equi-volume candles and designed for Oracle Strategy The Period in ticks is set directly on the chart Tick chart opens in a separate window Recommended to use tick periods from 50 and above Works on real time only Input Parameters Ticks_In_Bar - default period in ticks Counting_Bars - how many tick bars of history to build Custom_Symbol_Suffix - additional suffix for symbols
SMC Retest Trading System, Break of Structure (BOS) ve Change of Character (CHoCH) olaylarını işlem yapan bir MetaTrader 5 göstergesidir. Fiyatın kırılmış yapısal seviyeyi yeniden test etmesini bekler, ardından dokuz mum formasyonundan biriyle girişi onaylar. Her sinyal üçlü uyuma sahiptir: yapısal olay, kırılmış seviyenin yeniden testi ve formasyon onayı. Tüm semboller ve zaman dilimlerinde çalışır. Ayrıntılı kullanıcı kılavuzu yazarın   MQL5 Blog'unda   mevcuttur. Ek güncellemeler yazarın  
Dynamic Market Insights for Smart Trading Our goal is to provide seamless, high-quality services that empower market participants, traders, and analysts with real-time market insights and key indicators for informed decision-making. Advanced & User-Friendly Trend Analysis This is a cutting-edge, highly robust, and easy-to-use dynamic trend analysis indicator. The  DYJ Market Watch Indicator  evaluates market bullish and bearish strength using two distinct methods—each designed to measure differe
This is a powerful multi cycle, multi currency pair, and multi indicator monitoring tool for MT5 version, with main functions including: 1. Monitor real-time performance of multiple indicators, including RSI, MACD, MA, and STO. 2. Monitor multiple currency pairs, customizable to add or delete currency pairs, and automatically update indicators. 3. Monitor multiple currency pairs over multiple cycles. 4. After clicking, you can directly switch to the chart and cycle you want to view. 5. Click th
RBreaker
Zhong Long Wu
RBreaker Gold Indicators is a short-term intraday trading strategy for gold futures that combines trend following and intraday reversal approaches. It not only captures profits during trending markets but also enables timely profit-taking and counter-trend trading during market reversals. This strategy has been ranked among the top ten most profitable trading strategies by the American magazine   Futures Truth   for 15 consecutive years. It boasts a long lifecycle and remains widely used and st
Take the stress out of trading with the Buy Sell Chill Indicator —your ultimate companion for effortless trend identification. This easy-to-use tool gives you a clear visual arrow to show the direction the market is about to take, making trading decisions as simple and "chill" as possible. Why Choose the Buy Sell Chill Indicator? Relaxed and Intuitive : Designed to make trading less stressful and more enjoyable by giving you straightforward signals with no clutter. Customizable Features : ATR Pe
AIS MT5 INDICATOR 5 ALL INCLLUSIVE SET GUIDE CHAPTER 1  IMPORTANT INFORMATION <1> THIS INDICATOR IS ONE OF THE SERIES OF NEW AIS INDICATORS AIS MT5 INDICATOR 1 =ADVANCED CLASSIC= AIS MT5 INDICATOR 2 =MULTIFRAMES= AIS MT5 INDICATOR 3 =LINES= AIS MT5 INDICATOR 4 =MARKET PROFILES= AIS MT5 INDICATOR 5 =ALL INCLUSIVE SET CHAPTER 2 GENERAL FEATURES OF THE SERIES <1> AIS MT5 INDICATOR 1 =ADVANCED CLASSIC= < DEVELOPMENT PAUSED >     DISPLAYS MAIN TIME POINTS AND PRICE LEVELS OF THE CHART      SUCH
### EMA Oscillator Analysis   **Working Principle:**   1. **Main Line Calculation (BufferV):**      - Computes price deviation from adaptive EMA.      - Formula: `BufferV[i] = Close[i] - (alpha * Close[i] + (1-alpha) * BufferV[i-1])`      - Where `alpha = 2/(ema_period+1)`.   2. **Volatility Bands:**      - `BufferDev`/`BufferNegDev`: ±1 standard deviation.      - `BufferDevLimit`/`BufferNegDevLimit`: ±2 standard deviations (multiplied by `limit_factor`).      - Standard deviation is calculate
Fibonacci'nin gücünü Adaptive Fibonacci Trend Ribbon (AFTR) ile serbest bırakın! Ticaret stratejinizi devrim niteliğinde değiştirmeye hazır mısınız? AFTR, sadece bir gösterge değil; eğilimleri yakalamak, ters yönleri analiz etmek ve benzersiz bir netlik ile kesin hamleler yapmak için nihai aracınızdır. Fibonacci dizilerinin güçlü uyumu ve gelişmiş hareketli ortalamalar serisi ile inşa edilen bu gösterge, hem hassasiyet hem de esneklik isteyen traderlar için tasarlanmıştır.  Sizi öne çıkaran Ana
Spike detector pro
Rocky Clyde Van Coller
the Spike detector show multiple indication for entries, for max profits enter on each indication  given u can also add on lots size as entries go to secure max profits before spike occure, the more entries you enter  along the way ,the more profits u have after the initial spike, after spike hold 3-5 candles before close for max profits .  good on al timeframes max stop loss  is 22candles.
Ortalama geri dönüş ticareti için profesyonel ve nicel bir yaklaşım uygulayan benzersiz gösterge. Fiyatın tahmin edilebilir ve ölçülebilir bir şekilde ortalamaya döndüğü ve yön değiştirdiği gerçeğinden yararlanır, bu da nicel olmayan ticaret stratejilerinden büyük ölçüde daha iyi performans gösteren net giriş ve çıkış kurallarına izin verir. [ Installation Guide | Update Guide | Troubleshooting | FAQ | All Products ] Ticaret sinyallerini temizle Ticaret yapmak inanılmaz derecede kolay Özelleşt
The Antique Trend Indicator is a revolutionary trend trading and filtering solution with all the important features of a trend tool built into one tool! The Antique Trend indicator is good for any trader, suitable for any trader both for Forex and binary options. There is no need to configure anything, everything has been perfected by time and experience, it works great during flats and trends. The Antique Trend indicator is a tool for technical analysis of financial markets, reflecting curren
Trend and Signals MT5  indicator scans  30 trading Instruments (Forex, Metals and Indices).     It uses special algorithm on the  current market   based on   Pure Price Action   and display the overall trend and signal on the dashboard. When signals are produced the indicator sends alert and notification. Strategy for Signals This indicator uses the daily timeframe to determine the direction of the trend. The hourly timeframe is used to identify possible entries. Main trend and is determined by
Manyal trading system, CovEchoTrend Robot, focuses on reliability and flexibility. By employing statistical analysis methods to study the relationships between the base indicator and market patterns, the system enables a deeper understanding of market processes. Intelligent pattern analysis: The application of statistical data processing helps identify key trend reversal points more accurately, signaling significant market shifts. Informed decision-making is based on the intersection of indicato
Heat Map OSW
William Oswaldo Mayorga Urduy
BAŞ HARİTASI OSW Bu gösterge, tüm para birimi kombinasyonlarının mevcut durumunu ve varyasyonlarını bilmek için idealdir. Varyasyon, fiyatın mevcut fiyattan 24 saat öncesine veya menüde yapılandırılan her şeye göre yüzde hareketiyle hesaplanır. Bir para biriminin varyasyonunu bilmek için birincil para birimine bakmanız yeterlidir, örneğin: EUR'da diğer para birimleriyle karşılaştırmak için dikey bakmanız gerekiyor ve hepsinin sonunda tüm bu varyasyon değerlerinin ortalamasını buluyorsunuz.
BeST Swing Strategy MT5 is a Metatrader indicator based on the corresponding Jim Berg's work about volatility as described in his article "The Truth About Volatitlity" (TASC 2/2005).The indicator consists of 2 channel lines deriving as (MA+/- times the ATR) and can be used as a standalone trading system.The outlier prices of the Market as of the indicator's values can be used for producing Entry and Exit Signals. Advantages of the indicator == Uses 2 Swing Strategies == Never repaints its Sig
Range Directional Force Indicator – Designed for You to Optimize! The Range Directional Force Indicator is a cutting-edge tool designed to empower traders by visualizing market dynamics and directional strength. Built to offer insights into market trends and reversals, this indicator is an invaluable asset for traders seeking precision in their strategies. However, it is important to note that this indicator is not optimized, leaving room for you to tailor it to your unique trading preferences.
BeansAssist
Ivanvielle Bonifacio Dupaya
BeansAssist Gives you fruitful information of the price of the symbol that you are trading. Improve your trades simply by following the suggestion that it gives you. Tracks deal stats daily so you keep track of your performance. Don't let emotions take control, be a better and profitable trader with BeansAssist to guide you. *Note: This utility is not for free 
Bu ürünün alıcıları ayrıca şunları da satın alıyor
Divergence Bomber
Ihor Otkydach
4.9 (86)
Bu göstergeyi satın alan herkese aşağıdaki ekstra içerikler ücretsiz olarak sunulmaktadır: Her işlemi otomatik olarak yöneten, Stop Loss ve Take Profit seviyelerini ayarlayan ve işlemleri strateji kurallarına göre kapatan özel yardımcı araç: "Bomber Utility" Göstergenin farklı varlıklar üzerinde kullanılmasına yönelik ayar dosyaları (set dosyaları) Bomber Utility için 3 farklı modda kullanım sunan ayar dosyaları: "Minimum Risk", "Dengeli Risk" ve "Bekle-Gör Stratejisi" Bu ticaret stratejisini hı
Azimuth Pro
Ottaviano De Cicco
5 (6)
Azimuth Pro V2: Synthetic Fractal Structure and Confirmed Entries for MT5 Overview Azimuth Pro is a multi-level swing structure indicator by Merkava Labs . Four nested swing layers, swing-anchored VWAP, ABC pattern detection, three-timeframe structural filtering, and closed-bar confirmed entries — one chart, one workflow from micro-swings to macro-cycles. This is not a blind signal product. It is a structure-first workflow for traders who care about location, context, and timing. V2 Launch Offe
Quantum TrendPulse
Bogdan Ion Puscasu
5 (23)
SuperTrend   ,   RSI   ve   Stochastic'in   gücünü tek bir kapsamlı göstergede birleştirerek işlem potansiyelinizi en üst düzeye çıkaran nihai işlem aracı olan   Quantum TrendPulse'u   tanıtıyoruz. Hassasiyet ve verimlilik arayan yatırımcılar için tasarlanan bu gösterge, piyasa trendlerini, momentum değişimlerini ve en uygun giriş ve çıkış noktalarını güvenle belirlemenize yardımcı olur. Temel Özellikler: SuperTrend Entegrasyonu:   Güncel piyasa trendlerini kolayca takip edin ve karlılık dalgası
OmniSync Projection
Antonio-alin Teculescu
5 (1)
Chronos Fractal Engine is an innovative price projection indicator for MetaTrader 5, designed to transform your technical analysis by intelligently identifying and projecting historical price patterns. Built upon an advanced correlation algorithm and the fractal principles of the market, this powerful tool visualizes potential future price movements, giving you a unique edge in your trading decisions. What is Chronos Fractal Engine? At its core, the Chronos Fractal Engine employs a sophisticat
Tanıtım       Quantum Breakout PRO   , Breakout Bölgeleri ile ticaret yapma şeklinizi değiştiren çığır açan MQL5 Göstergesi! 13 yılı aşkın ticaret tecrübesine sahip deneyimli tüccarlardan oluşan bir ekip tarafından geliştirilmiştir.       Kuantum Breakout PRO       yenilikçi ve dinamik koparma bölgesi stratejisiyle ticaret yolculuğunuzu yeni zirvelere taşımak için tasarlanmıştır. Kuantum Breakout Göstergesi, size 5 kar hedefi bölgesi ile kırılma bölgelerinde sinyal okları ve kırılma kutusuna da
CGE Trading Suite
Carl Gustav Johan Ekstrom
5 (2)
Institutional-Grade Analytics for MT5 C GE Trading Suite delivers the analytical edge typically reserved for professional trading desks. The platform integrates a full suite of analytical tools into one seamless workflow: dynamic grid mapping, liquidity behavior analysis, ECM, trend lines, MIDAS, trade cycles, and directional channel projections. Together, these provide a unified view of market structure and momentum. Directional clarity is further enhanced by the capital flow index, which meas
Grabber System MT5
Ihor Otkydach
4.83 (23)
Size mükemmel bir teknik gösterge olan Grabber’ı tanıtıyorum. Bu araç, kullanıma hazır bir “her şey dahil” işlem stratejisi olarak çalışır. Tek bir yazılım kodu içinde güçlü piyasa teknik analiz araçları, işlem sinyalleri (oklar), uyarı işlevleri ve push bildirimleri entegre edilmiştir. Bu göstergeyi satın alan herkes aşağıdaki hediyeleri ücretsiz olarak alır: Açık emirleri otomatik yönetmek için Grabber Yardımcı Aracı Kurulum, yapılandırma ve nasıl işlem yapılacağını adım adım anlatan video kıl
Btmm state engine pro
Garry James Goodchild
5 (4)
BTMM State Engine Pro is a MetaTrader 5 indicator for traders who use the Beat The Market Maker approach: Asian session context, kill zone timing, level progression, peak formation detection, and a multi-pair scanner from a single chart. It combines cycle state logic with a built-in scanner dashboard so you do not need the same tool on many charts at once. What it does Draws the Asian session range; session times can follow broker server offset or be set in inputs. Tracks level progression (L
RelicusRoad Pro: Kantitatif Piyasa İşletim Sistemi ÖMÜR BOYU ERİŞİMDE %70 İNDİRİM (SINIRLI SÜRE) - 2.000+ TRADER'A KATILIN Neden çoğu trader "mükemmel" indikatörlere rağmen başarısız olur? Çünkü tekil kavramları boşlukta trade ederler. Bağlamı olmayan bir sinyal kumardır. Sürekli kazanmak için KONFLÜANS (UYUM) gerekir. RelicusRoad Pro basit bir ok indikatörü değildir. Tam bir Kantitatif Piyasa Ekosistemi dir. Tescilli volatilite modellemesini kullanarak fiyatın ilerlediği "Adil Değer Yolu"nu har
ARICoins
Temirlan Kdyrkhan
ARICoin is a powerful trading companion designed to generate high-probability entry signals with dynamic TP/SL/DP levels based on volatility. Built-in performance tracking shows win/loss stats, PP1/PP2 hits, and success rates all updated live. Key Features: Buy/Sell signals with adaptive volatility bands Real-time TP/SL/DP levels based on ATR Built-in MA Filter with optional ATR/StdDev volatility Performance stats panel (Success, Profit/Loss, PP1/PP2) Alerts via popup, sound, push, or email Cust
ARIPoint
Temirlan Kdyrkhan
ARIPoint is a powerful trading companion designed to generate high-probability entry signals with dynamic TP/SL/DP levels based on volatility. Built-in performance tracking shows win/loss stats, PP1/PP2 hits, and success rates all updated live. Key Features: Buy/Sell signals with adaptive volatility bands Real-time TP/SL/DP levels based on ATR Built-in MA Filter with optional ATR/StdDev volatility Performance stats panel (Success, Profit/Loss, PP1/PP2) Alerts via popup, sound, push, or email Cu
SignalTech MT5 is a trading system for EURUSD, USDCHF, USDJPY, AUDUSD, NZDUSD, EURJPY, AUDJPY, NZDJPY, CADJPY H2 and H3 Timeframe.  It can generate signals with Buy/Sell Arrows and Pop-Up/Sound Alerts. Each signal has clear Entry and Stop Loss levels, which should be automatically flagged on the chart, as well as potential Targets 1, 2, and 3. The Entry and TP levels are fixed after the trade is taken. The exit level is dynamic. If there are signs of a potential short-term trend reversal, the
Master Edition, piyasa yapısını hacim ve para akışı merceğinden görselleştirmek için tasarlanmış profesyonel kalitede bir analiz aracıdır. Standart hacim göstergelerinin aksine, bu araç doğrudan grafiğinizde bir Günlük Hacim Profili görüntüleyerek, fiyat keşfinin tam olarak nerede gerçekleştiğini ve "akıllı paranın" nerede konumlandığını görmenizi sağlar. Bu Master Edition, netlik ve hız için tasarlanmıştır ve yüklendiğinde grafik düzeninizi anında güzelleştiren benzersiz bir Otomatik Tema Senkr
Öncelikle, bu Ticaret Aracının Non-Repainting, Non-Redrawing ve Non-Lagging Gösterge olduğunu vurgulamakta fayda var, bu da onu profesyonel ticaret için ideal hale getiriyor. Çevrimiçi kurs, kullanıcı kılavuzu ve demo. Akıllı Fiyat Hareketi Kavramları Göstergesi, hem yeni hem de deneyimli tüccarlar için çok güçlü bir araçtır. İleri ticaret fikirlerini, Inner Circle Trader Analizi ve Smart Money Concepts Ticaret Stratejileri gibi 20'den fazla kullanışlı göstergeyi bir araya getirerek bir araya
Gartley Hunter Multi
Siarhei Vashchylka
5 (11)
Gartley Hunter Multi - An indicator for searching for harmonic patterns simultaneously on dozens of trading instruments and on all possible timeframes. Manual (Be sure to read before purchasing) | Version for MT4 Advantages 1. Patterns: Gartley, Butterfly, Shark, Crab. Bat, Alternate Bat, Deep Crab, Cypher 2. Simultaneous search for patterns on dozens of trading instruments and on all possible timeframes 3. Search for patterns of all possible sizes. From the smallest to the largest 4. All fou
Bill Williams Advanced
Siarhei Vashchylka
5 (11)
Bill Williams Advanced is designed for automatic chart analysis using Bill Williams' "Profitunity" system. The indicator analyzes four timeframes at once. Manual (Be sure to read before purchasing) Advantages 1. Analyzes the chart using Bill Williams' "Profitunity" system. Signals are displayed in a table in the corner of the screen and on the price chart. 2. Finds all known AO and AC signals, as well as zone signals. Equipped with a trend filter based on the Alligator. 3. Finds "Divergence Bar
TPA True Price Action indicator reveals the true price action of the market makers through 100% non-repainting signals strictly at the close of a candle! TPA shows entries and re-entries, every time the bulls are definitely stronger than the bears and vice versa. Not to confuse with red/green candles. The shift of power gets confirmed at the earliest stage and is ONE exit strategy of several. There are available now two free parts of the TPA User Guide for our customers. The first "The Basics"
RFI levels PRO MT5
Roman Podpora
3.67 (3)
Bu gösterge, fiyat dönüş noktalarını ve fiyat geri dönüş bölgelerini doğru bir şekilde gösterir.       Başlıca oyuncular   . Yeni trendlerin nerede oluştuğunu görüyorsunuz ve her işlem üzerinde kontrolü elinizde tutarak, azami hassasiyetle kararlar alıyorsunuz. TREND LINES PRO   göstergesiyle birlikte kullanıldığında maksimum potansiyelini ortaya koyar.  VERSION MT4 Göstergenin gösterdiği şey: Yeni bir trendin başlangıcında aktivasyonla birlikte tersine dönüş yapıları ve tersine dönüş seviyeler
AriX
Temirlan Kdyrkhan
1 (4)
AriX Indicator for MT5 A powerful trend-following and signal-evaluation tool AriX is a custom MT5 indicator that combines Moving Averages and ATR-based risk/reward logic to generate clear buy/sell signals. It visualizes dynamic SL/TP levels, evaluates past trade outcomes, and displays win/loss statistics in a clean on-chart panel. Key features include: Buy/Sell signals based on MA crossovers ATR-based SL/TP1/TP2/TP3 levels with visual lines and labels Signal outcome tracking with real-time stat
Advanced Supply Demand MT5
Bernhard Schweigert
4.53 (15)
Herhangi bir Acemi veya Uzman Tüccar için En İyi Çözüm! Bu gösterge benzersiz, yüksek kaliteli ve uygun fiyatlı bir ticaret aracıdır çünkü bir dizi tescilli özelliği ve yeni bir formülü bir araya getirdik. Bu güncelleme ile çift zaman dilimi dilimlerini gösterebileceksiniz. Yalnızca daha yüksek bir TF gösteremeyeceksiniz, aynı zamanda TF grafiğini ve ARTIK daha yüksek TF'yi de gösterebileceksiniz: YUVARLAK BÖLGELERİ GÖSTERMEK. Tüm Arz Talebi tüccarları buna bayılacak. :) Önemli Bilgiler Açıkland
Meravith MT5
Ivan Stefanov
5 (1)
Göstergе, herhangi bir noktadan hacmi analiz eder ve bu hacim için piyasanın tükeniş seviyelerini hesaplar. Meravith’in ana çizgileri: Boğa hacim tükeniş çizgisi – hedef olarak kullanılır. Ayı hacim tükeniş çizgisi – hedef olarak kullanılır. Trend çizgisi – piyasa trendini gösterir. Piyasanın boğa mı ayı mı olduğuna bağlı olarak rengi değişir ve trend desteği görevi görür. Nasıl kullanılır: Mor dikey çizgiye çift tıklayın ve istediğiniz konuma taşıyın. Her şeyi analiz edebilirsiniz – trendleri v
Berma Bands
Muhammad Elbermawi
5 (8)
Berma Bantları (BB'ler) göstergesi, piyasa trendlerini belirlemeyi ve bunlardan yararlanmayı amaçlayan yatırımcılar için değerli bir araçtır. Fiyat ile BB'ler arasındaki ilişkiyi analiz ederek, yatırımcılar bir piyasanın trend veya aralıklı fazda olup olmadığını ayırt edebilir. Daha fazla bilgi edinmek için [ Berma Home Blog ] adresini ziyaret edin. Berma Bantları üç belirgin çizgiden oluşur: Üst Berma Bandı, Orta Berma Bandı ve Alt Berma Bandı. Bu çizgiler fiyatın etrafına çizilir ve genel tren
Omniview ICT Dashboard
Kayode Michael Oyetunde
Kurumsal Akışı Yönetin. Piyasaya Hükmedin. "A+" seviyesinde bir kurulum bulmak üç şey gerektirir: Yön Eğilimi (Bias), Likidite ve Yer Değiştirme (Displacement). Çoğu yatırımcı, düşük zaman dilimi gürültüsünde kaybolduğu veya sahte hareketlere kapıldığı için zorluk yaşar. OmniView ICT Dashboard, kurumsal merceğinizdir. Önemli piyasa faaliyetlerinin nerede gerçekleştiğini vurgulamak için tüm Piyasa Gözlemi (Market Watch) listenizi tarar; böylece işlem aramayı bırakıp hassasiyetle uygulamaya başlay
ZIVA Signal Intelligence
Hassan Abdullah Hassan Al Balushi
ZIVA Signal Intelligence An Adaptive, Modular Market Intelligence System ZIVA Signal Intelligence is not positioned as a conventional trading indicator. It is a fully integrated, proprietary market intelligence system engineered to deliver structured, high-precision interpretation of price behavior within a controlled analytical environment. Developed through an independent architectural approach, ZIVA does not rely on, derive from, or replicate existing indicators. It represents a standalone
Protect against whipsaws: revolutionize your swing trading approach Swing Trading is the first indicator designed to detect swings in the direction of the trend and possible reversal swings. It uses the baseline swing trading approach, widely described in trading literature. The indicator studies several price and time vectors to track the aggregate trend direction and detects situations in which the market is oversold or overbought and ready to correct. [ Installation Guide | Update Guide | Tro
Trend Forecaster
Alexey Minkov
5 (7)
12% OFF EASTER SALE The Trend Forecaster indicator utilizes a unique proprietary algorithm to determine entry points for a breakout trading strategy. The indicator identifies price clusters, analyzes price movement near levels, and provides a signal when the price breaks through a level. The Trend Forecaster indicator is suitable for all financial assets, including currencies (Forex), metals, stocks, indices, and cryptocurrencies. You can also adjust the indicator to work on any time frames, alt
Volatility Trend System , girişler için sinyaller sağlayan bir ticaret sistemidir. Volatilite sistemi, trend yönünde doğrusal ve nokta sinyallerinin yanı sıra, yeniden çizme veya gecikme olmadan trendden çıkış sinyallerini de verir. Trend göstergesi orta vadeli trendin yönünü izler, yönünü ve değişimini gösterir. Sinyal göstergesi oynaklıktaki değişikliklere dayanır ve piyasaya girişleri gösterir. Gösterge çeşitli uyarı türleri ile donatılmıştır. Çeşitli ticaret araçlarına ve zaman dilimlerine
TREND ÇİZGİLERİ PRO       Piyasanın gerçek yön değiştirdiği noktayı anlamaya yardımcı olur. Gösterge, gerçek trend dönüşlerini ve büyük oyuncuların piyasaya yeniden girdiği noktaları gösterir. Anlıyorsun   BOS hatları   Daha yüksek zaman dilimlerindeki trend değişiklikleri ve önemli seviyeler, karmaşık ayarlar veya gereksiz gürültü olmadan gösterilir. Sinyaller yeniden çizilmez ve çubuk kapandıktan sonra grafikte kalır. MT4 SÜRÜMÜ   -   RFI LEVELS PRO   göstergesiyle   birlikte kullanıldığında m
Ziva LSE System
Hassan Abdullah Hassan Al Balushi
ZIVA LSE System A Professional Liquidity & Structure Execution Framework Executive Overview ZIVA LSE System is a professionally engineered analytical framework designed to interpret market behavior through structural logic and liquidity dynamics. It is not positioned as a conventional indicator. Rather, it functions as a structured execution environment that organizes price action into a clear, disciplined decision-making model. The system is built to deliver consistency, clarity, and controlle
SunSignal ML — AI Gold Signals with Multi-Timeframe Confluence SunSignal ML is an advanced AI-powered signal indicator purpose-built for XAUUSD gold trading. It combines a proprietary adaptive trend algorithm with six machine learning models trained on confirmed price pivots to produce high-confidence entry signals with multi-timeframe validation. The indicator runs efficiently on M1, M5 and M15 timeframes and is designed for traders who want precision entries guided by data rather than guesswor
Yazarın diğer ürünleri
//////////////////////////////////////////////// ////////////////////////////////// An improved version of the standard Bulls Power and Bears Power indicators. Now it's two in one. The setup is simple - you just need to specify the period. It is also very easy to understand the readings of this indicator, a signal above zero is a buy, and below it is a sell. //////////////////////////////////////////////// /////////////////////////////////// I hope this indicator will be very useful to you
FREE
VScale Live Expert
Igor Gerasimov
4 (1)
The indicator now includes vertical volumes. !!!! The indicator now includes a forecasting module !!!!. If you want to stop annoying messages use this expert together with the purchased paid indicator "V-Scale Live Trainer". Manual trading only. A simple expert makes traders lives easier. Note: To use it, just enable one-click trading. And don't forget to disable AUTO_TRADE. With each new start of the terminal, the metatrader 4, immediately, about two times, switch between all the timeframes i
FREE
//////////////////////////////////////////////// ////////////////////////////////// An improved version of the standard Average True Range indicator. It is now a responsive and smoothed line. The setup is not straightforward - but I hope you can do it. It is very easy to understand the readings of this indicator, the meaning is the same as that of the standard Average True Range. //////////////////////////////////////////////// /////////////////////////////////// I hope this indicator will
FREE
An improved version of the standard Standard Deviation indicator. It is now a responsive and smoothed line. The setup is not straightforward - but I hope you can do it. It is very easy to understand the readings of this indicator, the meaning is the same as that of the usual Standard Deviation. //////////////////////////////////////////////// /////////////////////////////////// I hope this indicator will be very useful to you in successful trading. Good luck.
FREE
This expert is designed to work in pairs with the same indicator. https://www.mql5.com/ru/market/product/34834 The expert does not display anything on the screen and does not trade. It only performs calculations for the indicator, this is done to save your computer resources. Since the expert works with symbols from Market Watch, there is no way to test it in the tester. Instructions for use: 0) Select the required symbols in the Market Watch, which will be displayed in the indicator. (Note: !!
FREE
This expert is designed to work in pairs with the same indicator. https://www.mql5.com/ru/market/product/34836 The expert does not display anything on the screen and does not trade. It only performs calculations for the indicator, this is done to save your computer resources. Since the expert works with symbols from Market Watch, there is no way to test it in the tester. Instructions for use: 0) Select the required symbols in the Market Watch, which will be displayed in the indicator. (Note: !!
FREE
//////////////////////////////////////////////// //////////////////////////////////////////////// ///////////////////////////////////// Go My Way is an ultra-accurate indicator of trend direction or price movement. This indicator is calculated on the basis of a dozen other indicators and has a very complex mechanism. //////////////////////////////////////////////// //////////////////////////////////////////////// ///////////////////////////////////// The settings are very simple, but it is
//////////////////////////////////////////////// ////////////////////////////////// This indicator uses polynomial regression to plot three channels and six lines accordingly. The first channel and its borders with a large period, the second with an average and the third with a small period. The setup is simple - you only need to specify the colors and enable / disable the display of price labels. It is also very easy to understand the readings of this indicator. Channel lines are used to set s
It's very simple - there are no settings. It is required to specify only the colors and the size of the arrows. It is also very easy to understand the readings of this indicator. An up arrow is a buy signal, and a down arrow is a sell signal. Try to test it in the strategy tester - you'll like it !!! //////////////////////////////////////////////// /////////////////////////////////// I hope this indicator will be very useful to you in successful trading. Good luck.
Bu, ikinci formatta bir onay grafiğidir. OpenCL desteği var. Ayarlar çok basittir - göstergenin hesaplanacağı haftanın günlerini seçebilirsiniz: örneğin, fiyatları hafta sonları güncellenmeyen bu tür finansal araçlar için, 6. ve 7. günler için haftanın başka bir gününü seçmelisiniz, ancak örneğin bitcoin için, komisyoncu fiyatları güncellerse, şunları yapabilirsiniz: 6. gün - Cumartesi ve 7. gün - Pazar için belirtin. Dilerseniz renkleri de özelleştirebilirsiniz. Bu, uyarlanabilir ve pürüzsüz b
//////////////////////////////////////////////// ////////////////////////////////// An improved version of the standard Average True Range indicator. This is now double the precision and a colored a veraging  line. The setup is quite simple - you need to specify the main period and the averaging period. It is very easy to understand the readings of this indicator, the meaning is the same as that of the standard Average True Range. //////////////////////////////////////////////// //////////
//////////////////////////////////////////////// ////////////////////////////////// This indicator displays the range of price changes in 1 minute. Great for risk management. This is an improved version of the standard Average True Range indicator for Tick Chart. This is now double the precision and a colored averaging line. The setting is quite simple - you just need to change the colors if necessary. It is very easy to understand the readings of this indicator, the meaning is the same as
Filtrele:
Değerlendirme yok
Değerlendirmeye yanıt