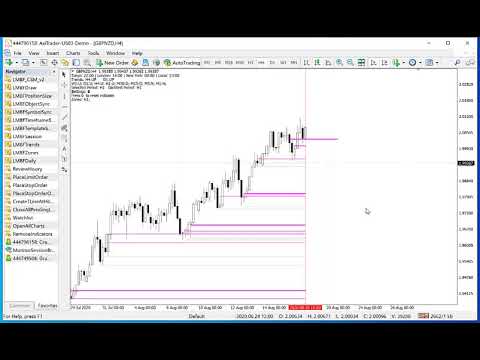
Identify and Backtest Supply and Demand

This may just look like another indicator for identifying and displaying supply and demand, but dig-in further and you will discover it has much more to offer.

In addition to the complete flexibility for displaying zones, consider the identification of recent support or resistance, the back-testing capability to help you learn how to identify the best supply and demand zones to trader from, the continuously updated trend information for all time frames, times from around the world displayed on your chart and the on-screen lot size calculation for if you decide to place a limit order on the zone.

This is an indicator that is not only powerful but won't bring your system to its knees as soon as its used on multiple charts.

In Standard mode

  • Zones calculated for all time frames from M1 to MN1
  • The latest line of support or resistance calculated for all time frames
  • Provides complete flexibility to change which time frame zones appear on your current chart. There is no limit to what combination of zones can be displayed, For example:
  • show daily and current time frame zones only
  • show lower time frame zones only
  • Gives visual clarity of time frame for zones by colour
  • Easy to increase or decrease the time frame of zones shown on your chart with a single key-stroke.
  • For any chosen time frame, use a single key to filter zones
  • toggle supply and demand zones on or off 
  • display only zones in line with the trend 
  • merge overlapping zones, or hide the zone closest to the current price
  • hide zones that have already been retested at least once
  • For selected time frames, add/remove fill for zones to provide greater visibility on your charts.
  • Display recent support/resistance for the chart time frame.
  • Temporarily hide any displayed zone just by double-clicking on it
  • Toggle the display of all zones on/off with one keystroke
  • Continuously see an indication of the trend across all time frames from W1 to M15
  • Whilst the markets are open, see what the time is in each of the major zones (Tokyo, London, New York) - automatically configured and adjusted for daylight savings.
  • Display zone labels that include lot size calculation based on parameters of account balance and percentage risk set for the indicator
  • Remove the indicator completely with a single key-press.
  • On-screen menu of shortcut keys available to toggle on/off
In Back-testing mode
  • All of the features available in standard mode also present in back-testing mode
  • Double click any candle to view zones and S&R as of that time
  • Step back or forward in time candle-by-candle on the chart
  • Step back or forward in time, candle-by-candle on a smaller time frame and see smaller time frame zones as they come and go.
  • Candles from the future hidden from view to give a more realistic chart display.
  • Display of what the time is in each major zone updated based on the back-testing candle time.
  • Display of trend for each time frame updated based on the back-testing candle time.
Chart Annotations
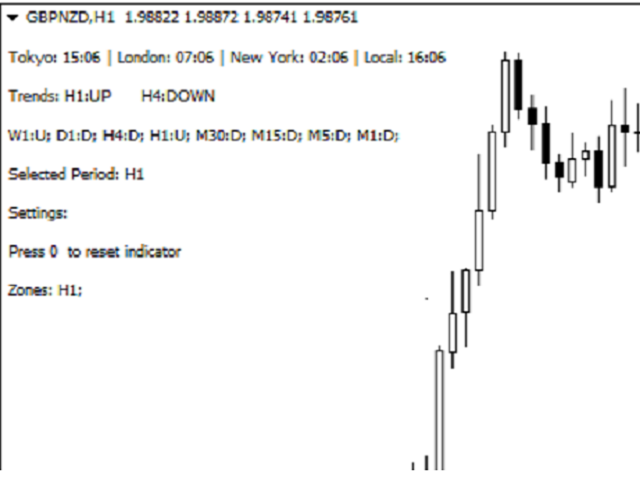
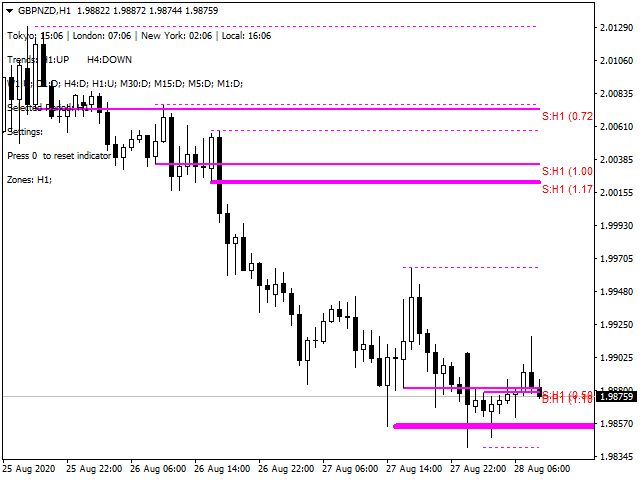
  • Refer to the diagram below:
  • Local time for Tokyo, London, New York and your local area (based on computer time).
  • Current and next higher time frame trends
  • Trends for all time frames from W1 down to M15
  • The currently selected period (e.g. for hiding/displaying zones or adding filters)
  • A list of filters or settings currently applied to the chart
  • A list of the zone time frames being displayed on the chart
  • Line of recent support or resistance (thick line protruding out to right)
  • An untested zone (drawn with thick solid lines)
  • A zone that has been retested at least once (drawn with thin solid lines)

Menu

It's possible to toggle the menu on or off any time the indicator is loaded on the chart by pressing the key with "?" on it. The following menu items will be listed:

  • C - Display on/off
  • H - Show next HTF zones
  • L - Show next LTF zones
  • T - Zones With trend only
  • D - Demand zones on/off
  • S = Supply zones on/off
  • M - Merge overlapping zones
  • O - Ignore overlapping zones
  • < - Select lower TF 
  • > - Select higher TF
  • Z - Zones on/off for TF
  • X - S/R on/off for TF
  • R - Retested zones on/off for TF
  • F - Shade zones on/off for TF
  • Mouse double click on zone - hide zone
  • -------------------
  • B - Back-testing mode on/off
  • < - Go back a candle
  • > - Go forward a candle
  • Mouse double click on candle - go to candle
  • -------------------
  • ? - Menu on/off
  • ' - Labels on/off
  • 0 - Reset indicator 
  • Q - Delete indicator
Önerilen ürünler
Bu, bir mumun kapanış fiyatını tahmin eden bir göstergedir. Gösterge öncelikle D1 çizelgelerinde kullanılmak üzere tasarlanmıştır. Bu gösterge hem geleneksel forex ticareti hem de ikili opsiyon ticareti için uygundur. Gösterge, bağımsız bir ticaret sistemi olarak kullanılabilir veya mevcut ticaret sisteminize ek olarak hareket edebilir. Bu gösterge, mevcut mumu analiz ederek mumun gövdesi içindeki belirli güç faktörlerini ve önceki mumun parametrelerini hesaplar. Böylece gösterge, piyasa hareket
TWO PAIRS SQUARE HEDGE METER INDICATOR Try this brilliant 2 pairs square indicator It draws a square wave of the relation between your two inputs symbols when square wave indicates -1 then it is very great opportunity to SELL pair1 and BUY Pair2 when square wave indicates +1 then it is very great opportunity to BUY pair1 and SELL Pair2 the inputs are : 2 pairs of symbols         then index value : i use 20 for M30 charts ( you can try other values : 40/50 for M15 , : 30 for M30 , : 10 for H1 ,
Infinity Trend Pro
Yaroslav Varankin
1 (1)
This is a trend indicator without redrawing Developed instead of the binary options strategy (by the color of the Martingale candlestick) Also works well in forex trading When to open trades (binary options) A signal will appear in the place with a candle signaling the current candle It is recommended to open a deal for one candle of the current timeframe M1 and M5 When a blue dot appears, open a deal up When a red dot appears, open a trade down. How to open trades on Forex. When a signal is rec
Trade with Gann on your side!! MASTER CIRCLE 360 CIRCLE CHART, originally created by Gann admitted that this is “The Mother of all charts”. It is one of the last studies that this great trader left for us. The numeric tab le is apparently quite simple like all the tables and is based on square numbers, the SQUARE OF 12 and is by evolution, one of the most important square numbers. Here we can find CYCLE, PRICE AND TIME thanks to angles and grades, to show past and future support and resistance.
Noize Absorption Index MT4
Ekaterina Saltykova
5 (1)
Noize Absorption Index - is the manual trading system that measures the difference of pressure between bears forces and bulls forces. Green line - is a noize free index that showing curent situation. Zero value of index shows totally choppy/flat market.Values above zero level shows how powerfull bullish wave is and values below zero measures bearish forces.Up arrow appears on bearish market when it's ready to reverse, dn arrow appears on weak bullish market, as a result of reverse expectation. S
SMC Venom Model BPR göstergesi, Akıllı Para (SMC) konseptinde çalışan yatırımcılar için profesyonel bir araçtır. Fiyat grafiğinde iki temel modeli otomatik olarak belirler: FVG   (Adil Değer Açığı), ilk ve üçüncü mum arasında boşluk bulunan üç mumun birleşimidir. Hacim desteğinin olmadığı seviyeler arasında bir bölge oluşturur ve bu da sıklıkla fiyat düzeltmesine yol açar. BPR   (Dengeli Fiyat Aralığı), bir "köprü" oluşturan iki FVG modelinin birleşimidir - bir kırılma bölgesi ve fiyatın düşük
The Th3Eng PipFinite indicator is based on a very excellent analysis of the right trend direction with perfect custom algorithms. It show the true direction and the best point to start trading. With StopLoss point and Three Take Profit points. Also it show the right pivot of the price and small points to order to replace the dynamic support and resistance channel, Which surrounds the price. And Finally it draws a very helpful Box on the left side on the chart includes (take profits and Stop loss
Volume Profile Sniper v11.1 – Piyasa analizi için kapsamlı bir araç  Ticarete profesyonel yaklaşım Volume Profile Sniper v11.1, piyasa durumunun kapsamlı değerlendirmesine dayalı olarak net sinyaller sağlayan tek bir göstergede 15'ten fazla temel filtreyi birleştirir.  Temel özellikler Hacim dengesizliği analizi – algoritma, her mumda alıcıların ve satıcıların oranını hesaplar ve bir tarafın baskın olduğunu bildirir (ayarlanabilir eşik %50 ile %90 arasındadır). Çok seviyeli sinyal filtreleme
The Super Arrow Indicator provides non-repainting buy and sell signals with exceptional accuracy. Key Features No repainting – confirmed signals remain fixed Clear visual arrows: green for buy, red for sell Real-time alerts via pop-up, sound, and optional email Clean chart view with no unnecessary clutter Works on all markets: Forex, gold, oil, indices, crypto Adjustable Parameters TimeFrame Default: "current time frame" Function: Sets the time frame for indicator calculation Options: Can be set
EZZ Elite Zig Zag is an indicator for the MetaTrader 4 terminal. This indicator traces the peak of the trend based on the market reversal, thus showing various opportunities in the financial market. EZZ Elite Zig Zag is a visual tool, intuitive, and easy to understand and use.  Test it Yourself by Downloading it for Free. Author Paulo Rocha all rights reserved
Phase Analytics Pro: Advanced Cyclic Market Analyzer Phase Analytics Pro is a sophisticated technical tool designed for traders who prioritize mathematical precision over lag-heavy traditional indicators. Based on the principles of digital signal processing, this indicator decomposes price action into phase and quadrature components to identify the dominant market cycle. How it works: The algorithm calculates the instantaneous phase of the market, allowing it to distinguish between trending and
Blahtech Market Profile
Blahtech Limited
4.53 (15)
Was: $249  Now: $99   Market Profile defines a number of day types that can help the trader to determine market behaviour. A key feature is the Value Area, representing the range of price action where 70% of trading took place. Understanding the Value Area can give traders valuable insight into market direction and establish the higher odds trade. It is an excellent addition to any system you may be using. Blahtech Limited presents their Market Profile indicator for the MetaTrader community. Ins
"Impulses and Corrections 4" is created to help traders navigate the market situation. The indicator shows multi-time frame upward and downward "Impulses" of price movements. These impulses are the basis for determining the "Base" , which is composed of zones of corrections of price movements, as well as "Potential" zones for possible scenarios of price movement. Up and down impulses are determined based on a modified formula of Bill Williams' "Fractals" indicator. The last impulse is always "U
VR Cub
Vladimir Pastushak
VR Cub , yüksek kaliteli giriş noktaları elde etmenin bir göstergesidir. Gösterge, matematiksel hesaplamaları kolaylaştırmak ve bir pozisyona giriş noktalarının aranmasını basitleştirmek için geliştirildi. Göstergenin yazıldığı ticaret stratejisi uzun yıllardan beri etkinliğini kanıtlamaktadır. Ticaret stratejisinin basitliği, acemi yatırımcıların bile başarılı bir şekilde ticaret yapmasına olanak tanıyan büyük avantajıdır. VR Cub, pozisyon açılış noktalarını ve Kâr Al ve Zararı Durdur hedef sev
Matrixs
Andriy Sydoruk
Matrix is a Forex arrow indicator. Displays signals simply and clearly! The arrows show the direction of the transaction, and are colored accordingly, which can be seen in the screenshots. As you can see, trading with such an indicator is easy. I waited for an arrow to appear in the desired direction - I opened a deal. An arrow formed in the opposite direction - closed the deal. The indicator also displays the lines with the help of which the arrow signals are formed, taking into account the int
Wave Wolf MT4
Andrei Salanevich
Forex Dalga Kurt MT4 göstergesi, Wolf dalgalarını aramak ve mevcut ticaret terminali penceresinde görüntülemek için tasarlanmıştır. Ticarette Wolfe dalgalarını kullanan tüccarlar için mükemmel bir gösterge. Ticaret stratejilerinde kullanımı, verimliliğini ve karlılığını önemli ölçüde artıracaktır. GÖSTERGE BİLGİSİ Diğer Wolf dalga göstergelerinin aksine, forex Wave Wold MT4 göstergesinin etkinliğini önemli ölçüde artıran birçok özelliği vardır: Birincisi, Açık Windows 5Point (true) ayarı bilg
## Smart Reversal Oscillator Pro Smart Reversal Oscillator Pro is an advanced hybrid trading utility designed for MetaTrader 4 that reinvents volatility and momentum analysis. Instead of analyzing raw price action, this indicator applies mathematical Bollinger Bands directly onto the Relative Strength Index (RSI) array data within a separate sub-window. Standard fixed oversold and overbought levels (like 30 and 70) often fail during strong market expansions. This professional oscillator solve
Basic Support and Resistance Göstergimiz, teknik analizinizi artırmak için ihtiyacınız olan çözümdür.Bu gösterge, destek ve direnç seviyelerini grafikte yansıtmanıza olanak tanır/ MT5 sürümü Özellikler Fibonacci seviyelerinin entegrasyonu: Fibonacci seviyelerini destek ve direnç seviyelerinin yanı sıra görüntüleme seçeneğiyle, göstergemiz size piyasa davranışı ve olası tersine dönme alanları hakkında daha derin bir fikir verir. Performans Optimizasyonu: Genişletilmiş satırları yalnızca her ç
Title : Market Bias Indicator - Oscillator-Based Trading Tool Introduction : Discover the potential of the "Market Bias Indicator," a revolutionary oscillator-based trading tool designed for precise market analysis. If you're in search of a robust alternative to traditional bias indicators, your quest ends here. Market Bias Indicator offers unparalleled accuracy in identifying market sentiment and is your gateway to confident trading decisions. Recommended Trading Pairs : Market Bias Indicator i
PZ Harmonacci Patterns
PZ TRADING SLU
3.17 (6)
Trade smarter, not harder: Empower your trading with Harmonacci Patterns This is arguably the most complete harmonic price formation auto-recognition indicator you can find for the MetaTrader Platform. It detects 19 different patterns, takes fibonacci projections as seriously as you do, displays the Potential Reversal Zone (PRZ) and finds suitable stop-loss and take-profit levels. [ Installation Guide | Update Guide | Troubleshooting | FAQ | All Products  ] It detects 19 different harmonic pric
WaveTrend Oscillator MT4 güçlü bir ticaret göstergesidir ve piyasa analizlerinizi momentum değişimlerini ve potansiyel trend dönüşlerini belirleyerek geliştirmek için tasarlanmıştır. Her seviyeden tüccar için ideal olan bu araç, forex, kripto para birimleri ve emtialar dahil olmak üzere çeşitli piyasalarda aşırı alım ve aşırı satım koşulları hakkında değerli bilgiler sunar. Doğru alım ve satım sinyalleri üretebilme yeteneği ile WaveTrend Oscillator MT4, tüccarların bilinçli kararlar almasını sağ
Trend Osilatörü - gelişmiş bir özel Crypto_Forex göstergesi, etkili bir ticaret aracıdır! - Gelişmiş yeni hesaplama yöntemi kullanılır - "Hesaplama için fiyat" parametresi için 20 seçenek. - Şimdiye kadar geliştirilen en akıcı osilatör. - Yükselen trendler için yeşil renk, düşen trendler için kırmızı renk. - Aşırı satım değerleri: 5'in altında, Aşırı alım değerleri: 95'in üzerinde. - Bu göstergeyle standart stratejileri bile yükseltmek için birçok fırsat vardır. - PC ve Mobil uyarılarla. Yüksek
Bu, fiyat etiketleriyle (devre dışı bırakılabilir)   Gelişmiş ZigZag Dinamik   ve/veya   Genişletilmiş Fraktallar   göstergesi ekstremumlarına dayalı destek ve direnç seviyelerinin bir MTF göstergesidir. MTF modu için daha yüksek TF'ler seçilebilir. Varsayılan olarak, seviyeler ZigZag gösterge noktalarına göre oluşturulur. Fraktal gösterge noktaları da ZigZag ile birlikte veya onun yerine kullanılabilir. Kullanımı basitleştirmek ve CPU zamanından tasarruf etmek için, açılışta her çubuk için bir
This indicator presents an alternative approach to identify Market Structure. The logic used is derived from learning material created by   DaveTeaches (on X) Upgrade v1.10: add option to put protected high/low value to buffer (figure 11, 12) When quantifying Market Structure, it is common to use fractal highs and lows to identify "significant" swing pivots. When price closes through these pivots, we may identify a Market Structure Shift (MSS) for reversals or a Break of Structure (BOS) for co
URGENCY “Limited launch pricing” “Price increases after version 2.0” Currencies Gold Momentum Flow Dashboard  — See Market Strength Instantly A powerful all-in-one dashboard that shows real-time momentum across multiple timeframes (M5–D1) for forex and gold. Multi-timeframe ROC analysis Built-in trade signals (alignment & momentum shifts) Currency strength meter Heatmap for instant trend recognition Alerts + one-click pair switching Stop switching charts — see the entire market in
RTrends
Nikolay Likhovid
The RTrends indicator does two things: first, it automatically draws the layout of the price chart by plotting trend lines and, secondly, it produces bearish and bullish signals. The layout reflects the fractal nature of the market. Trends from different time horizons are applied simultaneously on the chart. Thus, from a single chart a trader can see trend lines of higher timeframes. The lines, depending on the horizon, differ in color and width: the older the horizon, the thicker the line is. T
Profesyonel trader’lar ve değerlendirme hesapları (Prop) için Risk Yönetimi ve Limit İzleme Göstergesi Bu araç, risk yönetimi ve limitlere ilişkin bilgileri grafikte yalnızca görüntüler ve karar verme sürecinde odaklanmanıza yardımcı olur. Gösterge hiçbir işlemi açmaz/kapatmaz/değiştirmez ve Uzman Danışmanlar (EA) ile çakışmaz. Özellikler Günlük ve toplam drawdown izleme Günlük ve toplam drawdown’ı Bakiye (Balance) veya Özsermaye (Equity) bazında hesaplar ve gösterir (ayar yapılabilir). Tanımla
We present you the indicator "Candle closing counter", which will become your indispensable assistant in the world of trading. That’s why knowing when the candle will close can help: If you like to trade using candle patterns, you will know when the candle will be closed. This indicator will allow you to check if a known pattern has formed and if there is a possibility of trading. The indicator will help you to prepare for market opening and market closure. You can set a timer to create a pre
Super Reversal Pattern
Parfait Mujinga Ndalika
Super Reversal Pattern Indicator Unlock the power of advanced pattern recognition with our Super Reversal Pattern Indicator. Designed for traders seeking precision and reliability, this indicator identifies one of the most effective reversal patterns in technical analysis, offering a significant edge in your trading strategy. Key Features: Non-Repainting Accuracy: Enjoy the confidence of non-repainting technology. Once a Super Reversal Pattern is detected, it remains static, providing consiste
This is a new strategy for SUPPLY DEMAND areas It is based on a calculation using the tick volume to detect the big price action in market for both bear /bull actions this smart volume action candles are used to determine the supply and demand areas prices in between main supply and demand lines indicate sideway market  up arrows will be shown when prices moves above the main supply and the secondary supply lines Down arrows will be shown when prices moves below the main demand and the secondary
Bu ürünün alıcıları ayrıca şunları da satın alıyor
Neuro Poseidon MT4
Daria Rezueva
4.94 (31)
Neuro Poseidon is a new indicator by Daria Rezueva. It combines precise trading signals with adaptive TP/SL levels - creating best possible trades as a result! Message me and get  Neuro Poseidon Assistant  as a gift to automize your trading process! What makes it stand out? 1. Proven profitability on all assets and timeframes 2. Only confirmed BUY and SELL signals present on the chart 3. Adaptive TP & SL levels generated by the software for each trade 4. Easy to understand - suitable for all
Gann Made Easy
Oleg Rodin
4.84 (165)
Gann Made Easy , bay teorisini kullanarak ticaretin en iyi ilkelerine dayanan, profesyonel ve kullanımı kolay bir Forex ticaret sistemidir. WD Gann. Gösterge, Zararı Durdur ve Kâr Al Seviyeleri dahil olmak üzere doğru SATIN AL ve SAT sinyalleri sağlar. PUSH bildirimlerini kullanarak hareket halindeyken bile işlem yapabilirsiniz. Satın alma işleminden sonra, alım satım talimatlarını ve harika ek göstergeleri ücretsiz olarak almak için lütfen benimle iletişime geçin! Muhtemelen Gann ticaret yöntem
Dynamic Forex28 Navigator
Bernhard Schweigert
4.43 (7)
Dynamic Forex28 Navigator - Yeni Nesil Forex Ticaret Aracı. ŞU ANDA %49 İNDİRİM. Dynamic Forex28 Navigator, uzun zamandır popüler olan göstergelerimizin evrimidir ve üçünün gücünü tek bir göstergede birleştirir: Gelişmiş Döviz Gücü28 Göstergesi (695 inceleme) + Gelişmiş Döviz İMPULS ve UYARI (520 inceleme) + CS28 Kombo Sinyalleri (Bonus). Gösterge hakkında ayrıntılar https://www.mql5.com/en/blogs/post/758844 Yeni Nesil Güç Göstergesi Ne Sunuyor?  Orijinallerde sevdiğiniz her şey, şimdi yeni
M1 Sniper
Oleg Rodin
5 (24)
M1 SNIPER kullanımı kolay bir işlem göstergesi sistemidir. M1 zaman dilimi için tasarlanmış bir ok göstergesidir. Gösterge, M1 zaman diliminde scalping için bağımsız bir sistem olarak kullanılabilir ve mevcut işlem sisteminizin bir parçası olarak kullanılabilir. Bu işlem sistemi özellikle M1'de işlem yapmak için tasarlanmış olsa da, diğer zaman dilimleriyle de kullanılabilir. Başlangıçta bu yöntemi XAUUSD ve BTCUSD ticareti için tasarladım. Ancak bu yöntemi diğer piyasalarda işlem yaparken de ya
Scalper Inside PRO
Alexey Minkov
4.74 (68)
Scalper Inside PRO Scalper Inside PRO is an intraday trend and scalping indicator for MetaTrader 4 that uses an exclusive algorithm to quickly detect market direction and key target levels. It automatically calculates entry, exit and multiple profit targets, and shows detailed performance statistics so you can see how different instruments and strategies performed. This helps you choose the most suitable trading instruments for the current market conditions. Additionally, you can easily integrat
Enigmera
Ivan Stefanov
5 (8)
ENIGMERA: Pazarın Kalbi Önemli: MQL5.com demosu Strategy Tester'da çalışır ve Enigmera'nın tüm işlevlerini tam olarak yansıtmayabilir. Daha fazla bilgi için açıklamayı, ekran görüntülerini ve videoyu kontrol edin. Herhangi bir sorunuz varsa, bana mesaj göndermekten çekinmeyin! Göstergenin kodu tamamen yeniden yazılmıştır. 3.0 sürümü, yeni işlevler ekler ve göstergenin başlangıcından bu yana biriken hataları giderir. Giriş Bu gösterge ve ticaret sistemi, finansal piyasalara dikkat çekici bir ya
KT Alpha Hunter Arrows MT4
KEENBASE SOFTWARE SOLUTIONS
Çoğu ok göstergesi size yalnızca bir sinyal verir ve geri kalan her şeyi sizin çözmenizi bekler. KT Alpha Hunter Arrows ise size eksiksiz bir işlem planı sunar. Her sinyal oku, grafikte hazır bir planla birlikte görünür: giriş çizgisi, stop loss, dört take profit seviyesi ve bu sembol ile zaman diliminin o anda işlem yapmaya değer olup olmadığını gösteren canlı edge kararı. Pakete dahil olan Trade Manager EA, siz işleme girdikten sonra yönetimi üstlenir. Böylece piyasa hareketli ve duygusal açıd
Neo Wave PRO
Nikolay Raykov
5 (1)
Price & Time Market Structure Indicator A professional market structure tool that analyzes waves through both price and time — not price alone. Main Description NeoWave PRO is a professional market structure indicator for MetaTrader 4 designed for traders who want to move beyond traditional one-dimensional wave tools such as ZigZag, swing indicators, and basic high/low systems. Most wave indicators analyze only one thing: Price. But a real market wave is not only a price movement. A true wave de
PRO Renko Sistemi, RENKO grafikleri ticareti için özel olarak tasarlanmış son derece hassas bir ticaret sistemidir. Bu, çeşitli ticaret araçlarına uygulanabilen evrensel bir sistemdir. Sistemi etkin piyasa sana doğru ters sinyallerine erişim hakkı denilen ses nötralize eder. Göstergenin kullanımı çok kolaydır ve sinyal üretiminden sorumlu tek bir parametreye sahiptir. Aracı, seçtiğiniz herhangi bir ticaret aracına ve renko çubuğunun boyutuna kolayca uyarlayabilirsiniz. Yazılımımla karlı bir
Trend Lines PRO
Roman Podpora
5 (1)
TREND ÇİZGİLERİ PRO     Piyasanın gerçek yön değişimini anlamaya yardımcı olur. Gösterge, gerçek trend dönüşlerini ve büyük oyuncuların piyasaya yeniden girdiği noktaları gösterir. Anlıyorsun     BOS hatları  Daha yüksek zaman dilimlerindeki trend değişiklikleri ve önemli seviyeler, karmaşık ayarlar veya gereksiz gürültü olmadan gösterilir. Sinyaller yeniden çizilmez ve çubuk kapandıktan sonra grafikte kalır. VERSION MT 5     -    RFI LEVELS PRO  göstergesiyle birlikte kullanıldığında maksimum p
Trend Catcher ind
Ramil Minniakhmetov
5 (2)
TREND YAKALAYICI GÖSTERGE Trend Yakalayıcı Gösterge, yazarın tescilli ve özelleştirilmiş uyarlanabilir trend analiz göstergelerinin bir kombinasyonunu kullanarak piyasa fiyat hareketlerini analiz eder. Kısa vadeli gürültüyü filtreleyerek ve temel momentum gücüne, volatilite genişlemesine ve fiyat yapısı davranışına odaklanarak gerçek piyasa yönünü belirler. Ayrıca, hareketli ortalamalar, RSI ve volatilite filtreleri gibi yumuşatma ve trend filtreleme özelleştirilmiş göstergelerinin bir kombina
Genesis Matrix Pro is a professional multi-timeframe trend detection indicator designed to help traders identify high-quality market alignment with clarity and structure. It combines 12 different technical indicators into one visual alignment matrix, allowing traders to quickly see when market conditions are bullish, bearish, or neutral. A signal is generated only when the selected strategies are aligned, helping reduce noise and improve decision-making. PLEASE CONTACT ME AFTER PURCHASE TO GET
Current event:  https://c.mql5.com/1/326/A2SR2025_NoMusic.gif A. A2SR nedir ?   * Önde gelen bir teknik göstergedir (yeniden boyama yok, gecikme yok). -- Rehberlik : -- https://www.mql5.com/en/blogs/post/734748/page4#comment_16532516 adresinde -- ve https://www.mql5.com/en/users/yohana/blog A2SR, Destek (talep) ve Direnç (arz) seviyelerini belirlemede özel bir tekniğe sahiptir. İnternette gördüğümüz sıradan yoldan farklı olarak A2SR, gerçek SR seviyelerini belirlemede özgün bir konsepte sahi
PZ Trend Trading
PZ TRADING SLU
4.8 (5)
Capture every opportunity: your go-to indicator for profitable trend trading Trend Trading is an indicator designed to profit as much as possible from trends taking place in the market, by timing pullbacks and breakouts. It finds trading opportunities by analyzing what the price is doing during established trends. [ Installation Guide | Update Guide | Troubleshooting | FAQ | All Products ] Trade financial markets with confidence and efficiency Profit from established trends without getting whips
Step into the world of Forex trading with confidence, clarity, and precision using   Gold Indicator   a next-generation tool engineered to take your trading performance to the next level. Whether you’re a seasoned professional or just beginning your journey in the currency markets, Gold Indicator equips you with powerful insights and help you trade smarter, not harder. Built on the proven synergy of three advanced indicators, Gold Indicator focuses exclusively on medium and long-term trends eli
Bu ürün 2026 piyasası için güncellendi ve en son MT5 sürümleri için optimize edildi. FİYAT GÜNCELLEME BİLDİRİMİ: Smart Trend Trading System şu anda $99 fiyatıyla sunulmaktadır. Sonraki 30 satın alma işleminden sonra fiyat $199 olacaktır. ÖZEL TEKLİF: Smart Trend Trading System satın aldıktan sonra bana özel mesaj gönderin, Smart Universal EA’yı ÜCRETSİZ olarak alın ve Smart Trend sinyallerinizi otomatik işlemlere dönüştürün. Smart Trend Trading System, daha temiz sinyaller, daha iyi trend yönü
Scalper Vault
Oleg Rodin
5 (37)
Scalper Vault , başarılı bir scalping için ihtiyacınız olan her şeyi size sağlayan profesyonel bir scalping sistemidir. Bu gösterge, forex ve ikili opsiyon tüccarları tarafından kullanılabilecek eksiksiz bir ticaret sistemidir. Önerilen zaman çerçevesi M5'tir. Sistem size trend yönünde doğru ok sinyalleri sağlar. Ayrıca size üst ve alt sinyaller ve Gann piyasa seviyeleri sağlar. Göstergeler, PUSH bildirimleri dahil her türlü uyarıyı sağlar. Göstergeyi satın aldıktan sonra lütfen benimle iletişim
PZ Swing Trading
PZ TRADING SLU
5 (3)
Protect against whipsaws: revolutionize your swing trading approach Swing Trading is the first indicator designed to detect swings in the direction of the trend and possible reversal swings. It uses the baseline swing trading approach, widely described in trading literature. The indicator studies several price and time vectors to track the aggregate trend direction and detects situations in which the market is oversold or overbought and ready to correct. [ Installation Guide | Update Guide | Tro
BTMM State Engine Pro is a MetaTrader 4 indicator for traders who use the Beat The Market Maker approach: Asian session context, kill zone timing, level progression, peak formation detection, and a multi-pair scanner from a single chart. It combines cycle state logic with a built-in scanner dashboard so you do not need the same tool on many charts at once. What it does Draws the Asian session range; session times can follow broker server offset or be set in inputs. Tracks level progression (L
" Dynamic Scalper System " göstergesi, trend dalgaları içinde işlem yapmak için scalping yöntemi için tasarlanmıştır. Başlıca döviz çiftleri ve altın üzerinde test edilmiştir, diğer işlem araçlarıyla uyumluluğu mümkündür. Ek fiyat hareketi desteğiyle trend boyunca pozisyonların kısa vadeli açılması için sinyaller sağlar. Göstergenin prensibi. Büyük oklar trend yönünü belirler. Küçük oklar şeklinde scalping için sinyaller üreten bir algoritma trend dalgaları içinde çalışır. Kırmızı oklar yüksel
MonsterDash Harmonic Indicator is a harmonic pattern dashboard. It recognizes all major patterns. MonsterDash is a dashboard that displays all detected patterns for all symbols and (almost) all timeframes in sortable and scrollable format. Users can add their own user defined patterns . MonsterDash can open and update charts with the pattern found. Settings MonsterDash's default settings are good enough most of the time. Feel free to fine tune them to your needs. The color settings are for thos
Apollo SR Master , Destek/Direnç bölgelerinde alım satımı daha kolay ve güvenilir hale getiren özelliklere sahip bir Destek/Direnç göstergesidir. Gösterge, yerel fiyat zirvelerini ve diplerini tespit ederek Destek/Direnç bölgelerini herhangi bir gecikme olmadan gerçek zamanlı olarak hesaplar. Ardından, yeni oluşan Destek/Direnç bölgesini doğrulamak için, Destek/Direnç bölgesinin dikkate alınabileceğini ve gerçek bir SAT veya AL sinyali olarak kullanılabileceğini gösteren özel bir sinyal gösterir
Sismograf Marketquake Dedektörü. Description in English : https://www.mql5.com/en/market/product/113869?source=Site+Market+Product+Page#description How to use the Seismograph : https://www.mql5.com/en/market/product/113869#!tab=comments&page=2&comment=52806941 Create an EA : https://www.mql5.com/en/market/product/113869#!tab=comments&page=3&comment=52816509 Hangi şekilde işlem yaparsanız yapın, düşük likidite piyasasına girmekten kesinlikle kaçınmak istersiniz.- Sismograf, piyasa rallisin
ŞU ANDA %40INDIRIMLI Yeni Başlayanlar veya Uzman Tüccarlar için En İyi Çözüm! Bu Gösterge benzersiz, yüksek kaliteli ve uygun fiyatlı bir ticaret aracıdır çünkü bir dizi tescilli özellik ve yeni bir formül ekledik. Sadece BİR grafik ile 28 Forex çifti için Döviz Gücünü okuyabilirsiniz! Yeni bir trendin veya scalping fırsatının tam tetik noktasını belirleyebildiğiniz için ticaretinizin nasıl gelişeceğini hayal edin? Kullanım kılavuzu: buraya tıklayın Bu ilk olan, orijinal! Değersiz bir özent
Auto Optimized Parabolic RSI: Gelişmiş 3D Momentum Motoru Çoğu perakende indikatörü, piyasa volatilitesi değiştiği an çöken statik girdilere dayandığı için başarısız olur. Auto Optimized Parabolic RSI, kendi matematiksel avantajını sürekli olarak yeniden hesaplayarak "indikatör körelmesi" (indicator decay) sorununu çözer ve kurumsal düzeyde kantitatif adaptasyonu doğrudan MT5 terminalinize getirir. Temel Avantaj: Özel Bellek İçi (In-Memory) 3D Optimizasyon   Standart otomatik optimize ediciler,
Advanced Supply Demand
Bernhard Schweigert
4.91 (300)
Özel Ticaret –%40 İndirim Yeni Başlayanlar veya Uzman Yatırımcılar İçin En İyi Çözüm! Bu gösterge, bir dizi özel özellik ve yeni bir formül içerdiği için benzersiz, yüksek kaliteli ve uygun fiyatlı bir işlem aracıdır. Bu güncelleme ile çift zaman dilimi bölgeleri gösterebileceksiniz. Sadece daha yüksek bir zaman dilimini değil, hem grafik zaman dilimini hem de daha yüksek zaman dilimini gösterebileceksiniz: İÇ İÇE GEÇMİŞ BÖLGELER GÖSTERİYOR. Tüm Arz Talep yatırımcıları buna bayılacak. :) Önem
Bu gösterge, Elliott dalga teorisi ile iki şekilde çalışır: Otomatik Çalışma: Bu modda gösterge, Elliott dalga teorisine uygun olarak grafikteki beş hareket dalgasını otomatik olarak tespit edecek ve tahminlerde bulunacak, potansiyel ters dönüş bölgelerini belirleyecektir. Ayrıca, önemli gelişmeler hakkında tüccarları uyarılar ve bildirimlerle bilgilendirebilme yeteneğine sahiptir. Bu otomatik işlev, Elliott dalga desenlerinin tanımlanması ve analiz sürecini basit hale getirir. Manuel Çalışma: B
Introduction to Fractal Pattern Scanner Fractal Indicator refers to the technical indicator that makes use of the fractal geometry found in the financial market. Fractal Pattern Scanner is the advanced Fractal Indicator that brings the latest trading technology after the extensive research and development work in the fractal geometry in the financial market. The most important feature in Fractal Pattern Scanner is the ability to measure the turning point probability as well as the trend probabi
Bull versus Bear
Mohamed Hassan
4.5 (18)
Send us a message after your purchase to receive more information on how to get your  BONUS  for FREE  that works in great combination with Bull vs Bear ! Bull versus Bear is an easy-to-use Forex indicator that gives traders clear and accurate signals based on clear trend retests . Forget about lagging indicators or staring at charts for hours because  Bull vs Bear provides real-time entries with no lag and no repaint, so you can trade with confidence. Bull vs Bear  helps you enter trades during
The Propfolio Master Suite is the ultimate all-in-one analytical workstation for professional traders. Combining the power of the Beat The Market Maker (BTMM) methodology, Smart Money Concepts (SND/Liquidity), and Advanced Volume Profile, this suite replaces multiple different indicators with one optimized engine. Monitor up to 14 pairs simultaneously from a single chart, instantly identify market cycles, and seamlessly map institutional footprints with the click of a button. The Command Center
Yazarın diğer ürünleri
LMBFWatchlist is an interactive tool for Metatrader 4 that lets you create and manage watch lists directly on your Metatrader charts. ‌Functionality includes: ‌Add an unlimited number of watch lists with names of your choice Add different groups of watchlists for different time frames Add comments for symbols that always appear on the chart when that symbol is selected. Easily identify which symbols have comments against them. See watch lists instantly synchronise across all open charts that hav
Use this tool to plan your trades directly on your charts and get instant feedback on account risk, trade risk to reward and  required position size. Plus, purchase LMBF Executor separately to easily convert planned trades into orders and manage them from your charts. Features include: Plan multiple trades for one or more symbols visually on your charts at one time, either on the same of different time frames. Use your mouse to drag levels to change entry, stop loss and take profit levels.  See
Use this indicator to ensure all your open charts are constantly displaying the same time frame. Change the time frame in any one chart and watch the others instantly change to the same time frame. Also allows scrolling of candles in one chart to be replicated in all other synchronized charts. Analyze correlation between different symbols by linking charts together on the same time frame Display a vertical marker move across all your open charts, so you can quickly compare price action at the sa
FREE
The LMBFPositionSize indicator is a simple way to quickly determine the position size appropriate for your prospective trade interactively on your Metatrader 4 charts. When you first add the indicator to your chart, you will be given the option to set parameters including: the account balance to use in the calculation and a percentage of the balance you are prepared to risk.  Once attached to your chart, the indicator is available for you to use whenever you want and will continue to use these p
Completely change the way you use Metatrader 4 forever and give new meaning to using profiles and templates. Just attach the indicator to your open charts (e.g. include in your default template) and customised templates so you can do the following: Switch between different templates effortlessly without fear of losing any of the graphical objects (horizontal S&R, areas of supply and demand, text annotations) drawn on your charts Close a chart  and then watch it remember all the graphical objects
If you like to see different time frames for the same symbol side by side on your terminal, then this is the indicator for you. Attach the indicator to all chart instances for the symbol of interest. Then see any additions, edits or deletions made on graphical objects instantly replicated to all other open charts for the same symbol. Object types replicated include: trend lines, horizontal lines, vertical lines, rectangles, triangles, ellipses, arrows, text boxes and labels.
**IMPORTANT** THIS TOOL REQUIRES YOU TO FIRST PURCHASE "Graphical Trade Planner" https://www.mql5.com/en/market/product/56702. Without it, this tool will do nothing of any use. -------------------------- Use "Graphical Trade Planner"  to plan your trades directly on your charts and get instant feedback on account risk, trade risk to reward and  required position size. Plus, purchase LMBF Executor separately to easily convert planned trades into orders and manage them from your charts. Features i
Filtrele:
Değerlendirme yok
Değerlendirmeye yanıt