EZT Stochastic

5

EZT_Stochastic


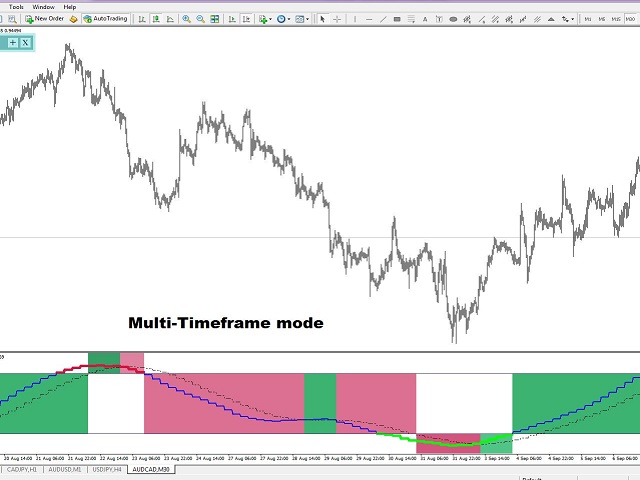
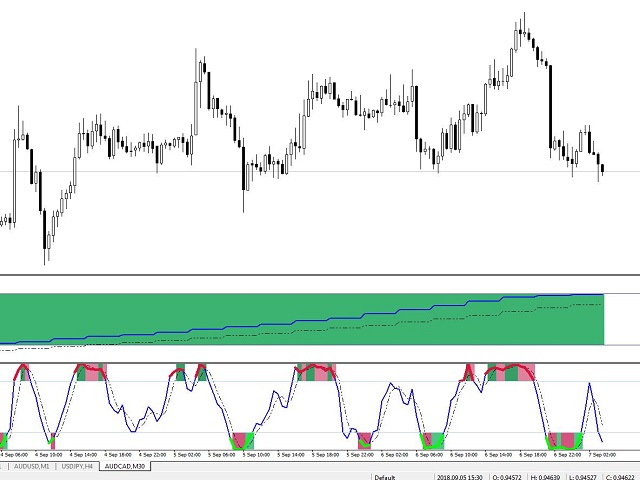
This is a Multi Timeframe stochastic indicator, with colored background. The colored background can be set to different colors based on the K and D line, (moving up, or down), and also about the position of the lines.

In the oversold or overbought zones you can choose different colors.


Settings:

You can choose the time-frame you want to see the stochastic.

Set the regular parameters in a same way like in the original stochastic.

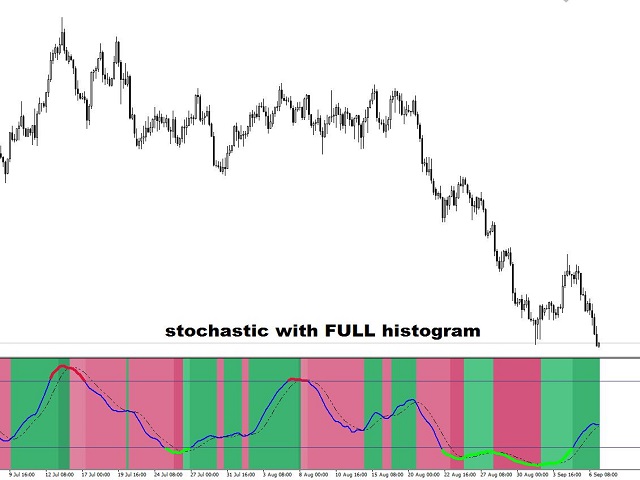
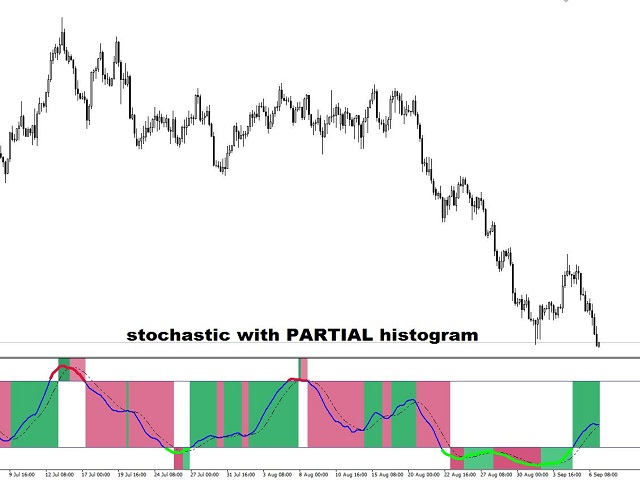
  • Histogram style: The style.
  • Histogram width: The width.
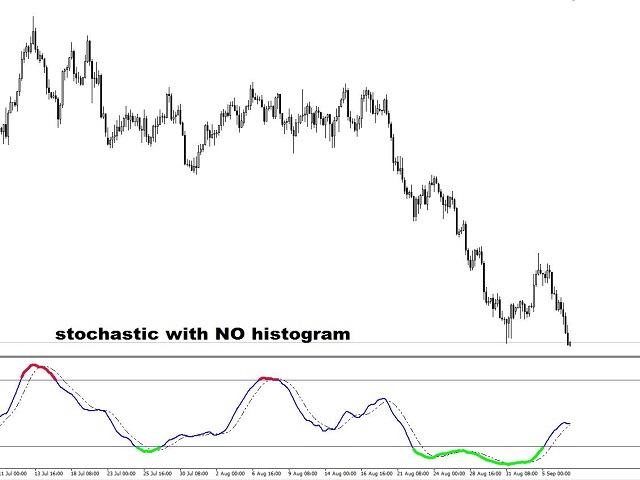
  • Histogram Drawing: Choose from 3 options: “No Histogram”, “Full Histogram”, or “Partial Histogram”     (See picture examples.)

You can set the oversold and overbought levels. (The default are: 20-80)

The background colors:

  • Oversold UP color: The stochastic are below the 20 level and K line crossed D line up.
  • Up color: The stochastic K line crossed up the 20 levels and goes until the D line crossed up the 80 level, or the K line cross D line down.
  • Overbought up color: The stochastic D line crossed up 80 level, and goes until K line cross down the D line.
  • Overbought down: The stochastic are above the 80 level and K line crossed D line down.
  • Down color: The stochastic K line crossed down the 80 levels and goes until the D line crossed down the 20 level, or the K line cross D line up.
  • Oversold down: The stochastic D line crossed down 20 level, and goes until K line cross up the D line.

You can chose the levels color and style.

You can chose the stochastic K and D line style, width and color, and for the K line you can set separate colors for oversold and overbought zones.


Değerlendirmeler 2
Lasse Michael Holm
1604
Lasse Michael Holm 2020.05.20 01:36 
 

I really love this indicator so much!! Best on this forum. The histogram makes it so easy to read. 10 star!

Sio Fong Fok
320
Sio Fong Fok 2019.09.29 14:05 
 

nice indicator

Önerilen ürünler
Trend Osilatörü - gelişmiş bir özel Crypto_Forex göstergesi, etkili bir ticaret aracıdır! - Gelişmiş yeni hesaplama yöntemi kullanılır - "Hesaplama için fiyat" parametresi için 20 seçenek. - Şimdiye kadar geliştirilen en akıcı osilatör. - Yükselen trendler için yeşil renk, düşen trendler için kırmızı renk. - Aşırı satım değerleri: 5'in altında, Aşırı alım değerleri: 95'in üzerinde. - Bu göstergeyle standart stratejileri bile yükseltmek için birçok fırsat vardır. - PC ve Mobil uyarılarla. Yüksek
Insider Scalper Binary This tool is designed to trade binary options. for short temporary spends. to make a deal is worth the moment of receiving the signal and only 1 candle if it is m1 then only for a minute and so in accordance with the timeframe. for better results, you need to select well-volatile charts.... recommended currency pairs eur | usd, usd | jpy .... the indicator is already configured, you just have to add it to the chart and trade .... The indicator signals the next candle.
Key level wedge
Presley Annais Tatenda Meck
5 (5)
The Key level wedge indicator automatically draws rising wedge pattern and falling wedge pattern for you on the chart. This pattern is really good when used as a confirmation entry at key support & resistance, supply & demand and reversal zones. Advantages  The Key level wedge block DOES NOT RE-PAINT, giving you confidence when a signal appears and also helps when looking back.  The Key level wedge includes an on/off button on the chart to easily keep the charts clean after analysis by just o
Crypto_Forex Göstergesi HTF Ichimoku MT4 için. - Ichimoku göstergesi en güçlü trend göstergelerinden biridir. HTF - Daha Yüksek Zaman Çerçevesi anlamına gelir. - Bu gösterge Trend Yatırımcıları için mükemmeldir ve Fiyat Hareketi girişleriyle birleştirilebilir. - HTF Ichimoku Göstergesi, daha yüksek zaman çerçevesinden Ichimoku'yu mevcut grafiğinize eklemenizi sağlar. - Yukarı trend - mavi olanın üzerindeki kırmızı çizgi (ve her iki çizgi de bulutun üzerindedir) / Aşağı trend - mavi olanın altı
The CCI Divergence is a reasonably useful indicator in itself, but it is even more effective when used with divergence pattern trading. The CCI Divergence indicator signal is one of the most potent signals among the indicators that exist in the market. Here is new version for Divergence Indicator using CCI method, with more improvements. Divergences indicate a potential investment point because the directional moment does not confirm the price. A bullish divergence occurs when the underlying va
Alpha Trend sign has been a very popular trading tool in our company for a long time. It can verify our trading system and clearly indicate trading signals, and the signals will not drift. Main functions: Based on the market display of active areas, indicators can be used to intuitively determine whether the current market trend belongs to a trend market or a volatile market. And enter the market according to the indicator arrows, with green arrows indicating buy and red arrows indicating se
Delta Fusion Pro
Francesco Secchi
5 (2)
Delta Fusion Pro – Gün İçi İşlem için Gelişmiş Emir Akışı Analizi Delta Fusion Pro, MetaTrader 4 için profesyonel bir göstergedir. Agresif emir akışını ortaya çıkarır ve kurumsal baskının yoğunluğunu ve yönünü gerçek zamanlı olarak gösterir. Geleneksel hacim göstergelerinden farklı olarak, Ask ve Bid hacimleri arasındaki delta farkını analiz eder; dönüşleri önceden tahmin eder, trendleri doğrular ve profesyonel ilgi alanlarını belirler. Ana Özellikler Akıllı Otomatik Ayar Sistemi Tüm parametr
PABT Pattern Indicator - it's classical system one of the signal patterns. Indicator logic - the Hi & Lo of the bar is fully within the range of the preceding bar, look to trade them as pullback in trend. In the way if indicator found PABT pattern it's drawing two lines and arrow what showing trend way.  - First line - it's entry point and drawing at: 1. On the high of signal bar or on middle of the signal bar (depending from indicator mode) for buy; 2. On the low of signal bar or on middle of t
DayTradingArrow v1
Nedyalka Zhelyazkova
5 (3)
Step into Confident Trading with DayTradingArrow v1 In trading, confidence comes from clarity, structure, and reliable signals . DayTradingArrow v1 is designed to give you exactly that – a tool that highlights opportunities, filters out noise, and supports smart, disciplined decisions. Every signal is confirmed and actionable , allowing you to trade with confidence rather than guesswork. Key Benefits Clear buy and sell signals for fast, confident decision-making Perfect for beginners and exper
Bu, bir mumun kapanış fiyatını tahmin eden bir göstergedir. Gösterge öncelikle D1 çizelgelerinde kullanılmak üzere tasarlanmıştır. Bu gösterge hem geleneksel forex ticareti hem de ikili opsiyon ticareti için uygundur. Gösterge, bağımsız bir ticaret sistemi olarak kullanılabilir veya mevcut ticaret sisteminize ek olarak hareket edebilir. Bu gösterge, mevcut mumu analiz ederek mumun gövdesi içindeki belirli güç faktörlerini ve önceki mumun parametrelerini hesaplar. Böylece gösterge, piyasa hareket
Color Stochastic Enhanced Stochastic Oscillator with Cross Detection and Visual Signal Support Overview Color Stochastic is a customized version of the classic Stochastic Oscillator designed for momentum analysis and crossover visualization. The indicator provides color-based signal marking and configurable crossover detection at user-defined overbought and oversold levels. It can be used as part of: Momentum analysis Mean reversion workflows DCA-based strategies Multi-indicator confirmation sys
Indicator without redrawing Divergent MAX The DivirgentMAX indicator is a modification based on the MACD. The tool detects divergence based on OsMA and sends signals to buy or sell (buy|sell), taking into account the type of discrepancies detected. Important!!!! In the DivirgentMAX indicator, the optimal entry points are drawn using arrows in the indicator's basement. Divergence is also displayed graphically. In this modification of the MACD, the lag problem characteristic of its predecessor i
Unlock hidden profits: accurate divergence trading for all markets Tricky to find and scarce in frequency, divergences are one of the most reliable trading scenarios. This indicator finds and scans for regular and hidden divergences automatically using your favourite oscillator. [ Installation Guide | Update Guide | Troubleshooting | FAQ | All Products ] Easy to trade Finds regular and hidden divergences Supports many well known oscillators Implements trading signals based on breakouts Display
The Stochastic Oscillator is a momentum indicator that uses support and resistance levels. The term "stochastic" refers to the point of a current price in relation to its price range over a period of time. You can use a New Stochastic in the same way as classical one: Overbought and Oversold areas to make a Buy or Sell orders. This new indicator shows all variety of Fibonacci Levels (from 23.6 to 76.4) which can be used as Overbought and Oversold levels as well as points to close an open positio
Trend Sniper Super Indicator is one of the best indicator which can provide you will perfect signals for short term and long term trades. This indicator is suitable for both scalping and swing trading strategies. The indicator is over 85% accurate. It uses terminal Message Alerts, Emails and Push notifications to your mobile device to inform you about the new trading opportunities and it will calculate the take profit and stop loss level for you. All you will need to do is to place a trade. Subs
Alpha Trend
Evgeny Belyaev
3 (4)
Alpha Trend is a trend indicator for the MetaTrader 4 platform; it has been developed by a group of professional traders. The Alpha Trend indicator finds the most probable tendency reversal points, which allows making trades at the very beginning of a trend. This indicator features notifications, which are generated whenever a new signal appears (alert, email, push-notification). This allows you to open a position in a timely manner. Alpha Trend does not redraw, which makes it possible to evalua
An Ultimate Tool  for quick and efficient market analysis. Unique combination of solid indicators defining market direction for trend tracking and filtration designed for you to stay on the   right   side of the market. Market Rider Oscillators  gives you access to one of the most used from professional trades indicators on worldwide, which were not build in for MT4 and MT5 terminals . These are unique non-repainting oscillators designed to be used on all time frames for all instruments classe
The indicator detects and displays М. Gartley's Butterfly pattern. The pattern is plotted by the extreme values of the ZigZag indicator (included in the resources, no need to install). After detecting the pattern, the indicator notifies of that by the pop-up window, a mobile notification and an email. The pattern and wave parameters are displayed on the screenshots. The default parameters are used for demonstration purposes only in order to increase the amount of detected patterns. Parameters z
VR Cub
Vladimir Pastushak
VR Cub , yüksek kaliteli giriş noktaları elde etmenin bir göstergesidir. Gösterge, matematiksel hesaplamaları kolaylaştırmak ve bir pozisyona giriş noktalarının aranmasını basitleştirmek için geliştirildi. Göstergenin yazıldığı ticaret stratejisi uzun yıllardan beri etkinliğini kanıtlamaktadır. Ticaret stratejisinin basitliği, acemi yatırımcıların bile başarılı bir şekilde ticaret yapmasına olanak tanıyan büyük avantajıdır. VR Cub, pozisyon açılış noktalarını ve Kâr Al ve Zararı Durdur hedef sev
Strong Signal System   indicator is designed for trend and signal trading. This indicator generates trend signals.  It uses many algorithms and indicators to generate this signal. It tries to generate a signal from the points with the highest trend potential. This indicator is a complete trading product. This indicator does not need any additional indicators.  You can only trade with this indicator. The generated signals are displayed on the graphical screen.  Thanks to the alert features you ca
MasterArrow
Pavel Krysanov
5 (1)
Correct market entries and exits are essential for any Forex trader. MasterArrow indicator addresses this issue. It has no redundant elements and draws only buy/sell arrows. The up arrow is a BUY signal, while the down arrow is a SELL one. The indicator is simple to configure. Change the Strength parameter to configure the signals frequency. The product is based on standard indicators (MA, RSI, ATR, etc.). But it also features the custom algorithm allowing to combine them into a single tool and
Monster Harmonic Indicator
Paul Geirnaerdt
4.59 (29)
Monster Harmonics Indicator is a harmonic pattern indicator. It recognizes Gartley, Bat, Crab, Butterfly, Cypher, White Swan, Black Swan, Shark and several other patterns. Projected patterns that are not yet completed are recognized, too. Monster even shows the PRZ (Potential Reversal Zone). Users can add their own user defined patterns to Monster. Besides the current pattern, Monster also shows all patterns in the symbols history. Monster will provide alerts for developing patterns. Introduced
Binary Options Support Resistance Indicator This indicator is designed for binary options trading and effectively shows retracements from support and resistance levels. Signals appear on the current candle. A red arrow pointing downwards indicates a potential selling opportunity, while a blue arrow pointing upwards suggests buying opportunities. All that needs adjustment is the color of the signal arrows. It is recommended to use it on the M1-M5 timeframes as signals are frequent on these timef
Noize Absorption Index MT4
Ekaterina Saltykova
5 (1)
Noize Absorption Index - is the manual trading system that measures the difference of pressure between bears forces and bulls forces. Green line - is a noize free index that showing curent situation. Zero value of index shows totally choppy/flat market.Values above zero level shows how powerfull bullish wave is and values below zero measures bearish forces.Up arrow appears on bearish market when it's ready to reverse, dn arrow appears on weak bullish market, as a result of reverse expectation. S
Lyne
Maksim Kalachev
About the Lyne indicator Lyne is a Metatrader 4 (MT4) indicator, the essence of which is to transform the accumulated historical data. The Lyne indicator makes it possible to detect various features and patterns in price dynamics that are invisible to the naked eye. Based on this information, traders can anticipate further price movement and adjust their strategy accordingly. This indicator has proven itself in the scalping strategy. The indicator works without repainting.
Big Trend Signal   indicator is designed for trend and signal trading. This indicator generates trend signals.  It uses many algorithms and indicators to generate this signal. It tries to generate a signal from the points with the highest trend potential. This indicator is a complete trading product. This indicator does not need any additional indicators.  You can only trade with this indicator. The generated signals are displayed on the graphical screen.  Thanks to the alert features you can ge
The   RSI Divergence + FVG Signal   indicator combines   Relative Strength Index (RSI) Divergence   with   Fair Value Gap (FVG)   detection to generate high-probability buy and sell signals based on both momentum shifts and institutional imbalance zones. Core Features: RSI Divergence Detection : Identifies both regular and hidden bullish/bearish divergences between price and RSI. Divergences indicate potential trend reversals or continuation. FVG Zone Recognition : Detects Fair Value Gaps (imbal
Meraz Trend V4 – High Accuracy 1-Minute Binary Options Signal Indicator Meraz Trend V4 is specially designed for binary options traders who trade on the 1-minute timeframe. It Best Work On Any OTC Pair Any Broker The indicator provides clear Buy and Sell arrow signals directly on the chart. When an arrow appears on a candle, you must enter the trade at the opening of the next candle. Expiry time is strictly 1 minute (1 candle). Entry Rules: If a Buy Arrow appears → Open a BUY (CALL)
Pullback Scanner Line – Pullback Signal Indicator by Mr. Rami Pullback Scanner Line is an advanced indicator that helps accurately identify trading opportunities based on reversals within the trend. It combines the strength of an exponential moving average (EMA) and Bollinger Bands to calculate a "pullback score," which reflects the probability of a favorable price reversal or continuation. Key Features: Uses a configurable EMA to detect trend direction. Uses Bollinger Bands to measure vola
The indicator displays the data of the Stochastic oscillator from a higher timeframe on the chart. The main and signal lines are displayed in a separate window. The stepped response is not smoothed. The indicator is useful for practicing "manual" forex trading strategies, which use the data from several screens with different timeframes of a single symbol. The indicator uses the settings that are identical to the standard ones, and a drop-down list for selecting the timeframe. Indicator Paramet
Bu ürünün alıcıları ayrıca şunları da satın alıyor
Neuro Poseidon MT4
Daria Rezueva
4.95 (37)
Neuro Poseidon is a new indicator by Daria Rezueva. It combines precise trading signals with adaptive TP/SL levels - creating best possible trades as a result! Message me and get  Neuro Poseidon Assistant  as a gift to automize your trading process! What makes it stand out? 1. Proven profitability on all assets and timeframes 2. Only confirmed BUY and SELL signals present on the chart 3. Adaptive TP & SL levels generated by the software for each trade 4. Easy to understand - suitable for all
Gann Made Easy
Oleg Rodin
4.84 (165)
Gann Made Easy , bay teorisini kullanarak ticaretin en iyi ilkelerine dayanan, profesyonel ve kullanımı kolay bir Forex ticaret sistemidir. WD Gann. Gösterge, Zararı Durdur ve Kâr Al Seviyeleri dahil olmak üzere doğru SATIN AL ve SAT sinyalleri sağlar. PUSH bildirimlerini kullanarak hareket halindeyken bile işlem yapabilirsiniz. Satın alma işleminden sonra, alım satım talimatlarını ve harika ek göstergeleri ücretsiz olarak almak için lütfen benimle iletişime geçin! Muhtemelen Gann ticaret yöntem
Trend Catcher ind
Ramil Minniakhmetov
5 (3)
TREND YAKALAYICI GÖSTERGE Trend Yakalayıcı Gösterge, yazarın tescilli ve özelleştirilmiş uyarlanabilir trend analiz göstergelerinin bir kombinasyonunu kullanarak piyasa fiyat hareketlerini analiz eder. Kısa vadeli gürültüyü filtreleyerek ve temel momentum gücüne, volatilite genişlemesine ve fiyat yapısı davranışına odaklanarak gerçek piyasa yönünü belirler. Ayrıca, hareketli ortalamalar, RSI ve volatilite filtreleri gibi yumuşatma ve trend filtreleme özelleştirilmiş göstergelerinin bir kombina
M1 Sniper
Oleg Rodin
5 (24)
M1 SNIPER kullanımı kolay bir işlem göstergesi sistemidir. M1 zaman dilimi için tasarlanmış bir ok göstergesidir. Gösterge, M1 zaman diliminde scalping için bağımsız bir sistem olarak kullanılabilir ve mevcut işlem sisteminizin bir parçası olarak kullanılabilir. Bu işlem sistemi özellikle M1'de işlem yapmak için tasarlanmış olsa da, diğer zaman dilimleriyle de kullanılabilir. Başlangıçta bu yöntemi XAUUSD ve BTCUSD ticareti için tasarladım. Ancak bu yöntemi diğer piyasalarda işlem yaparken de ya
Dynamic Forex28 Navigator
Bernhard Schweigert
4.43 (7)
Dynamic Forex28 Navigator - Yeni Nesil Forex Ticaret Aracı. ŞU ANDA %49 İNDİRİM. Dynamic Forex28 Navigator, uzun zamandır popüler olan göstergelerimizin evrimidir ve üçünün gücünü tek bir göstergede birleştirir: Gelişmiş Döviz Gücü28 Göstergesi (695 inceleme) + Gelişmiş Döviz İMPULS ve UYARI (520 inceleme) + CS28 Kombo Sinyalleri (Bonus). Gösterge hakkında ayrıntılar https://www.mql5.com/en/blogs/post/758844 Yeni Nesil Güç Göstergesi Ne Sunuyor?  Orijinallerde sevdiğiniz her şey, şimdi yeni
MetaBands M4
Vahidreza Heidar Gholami
3.5 (6)
MetaBands uses powerful and unique algorithms to draw channels and detect trends so that it can provide traders with potential points for entering and exiting trades. It’s a channel indicator plus a powerful trend indicator. It includes different types of channels which can be merged to create new channels simply by using the input parameters. MetaBands uses all types of alerts to notify users about market events. Features Supports most of the channel algorithms Powerful trend detection algorith
Scalper Inside PRO
Alexey Minkov
4.68 (69)
Scalper Inside PRO Scalper Inside PRO is an intraday trend and scalping indicator that uses exclusive built-in algorithms to evaluate market direction and key target levels. The indicator automatically calculates entry and exit points and several profit target levels, and it shows detailed performance statistics, so you can see how different instruments and strategies behaved on historical data. This helps you select instruments that fit current market conditions. You can also connect your own a
Advanced Supply Demand
Bernhard Schweigert
4.91 (300)
Özel Ticaret –%30 İndirim Yeni Başlayanlar veya Uzman Yatırımcılar İçin En İyi Çözüm! Bu gösterge, bir dizi özel özellik ve yeni bir formül içerdiği için benzersiz, yüksek kaliteli ve uygun fiyatlı bir işlem aracıdır. Bu güncelleme ile çift zaman dilimi bölgeleri gösterebileceksiniz. Sadece daha yüksek bir zaman dilimini değil, hem grafik zaman dilimini hem de daha yüksek zaman dilimini gösterebileceksiniz: İÇ İÇE GEÇMİŞ BÖLGELER GÖSTERİYOR. Tüm Arz Talep yatırımcıları buna bayılacak. :) Önem
Genesis Matrix Pro is a professional multi-timeframe trend detection indicator designed to help traders identify high-quality market alignment with clarity and structure. It combines 12 different technical indicators into one visual alignment matrix, allowing traders to quickly see when market conditions are bullish, bearish, or neutral. A signal is generated only when the selected strategies are aligned, helping reduce noise and improve decision-making. PLEASE CONTACT ME AFTER PURCHASE TO GET
Gann Kare Göstergesi, W.D. Gann tarafından yazılan "Piyasa Tahminleri için Matematiksel Formül" makalesine dayalı güçlü bir piyasa analizi aracıdır. Bu araç, piyasa analizi için matematiksel ve Gann teorilerini kullanarak hassas analizler gerçekleştirir. 144, 90, 52 karelerini ve ayrıca 9 karesini kullanır. Ayrıca, 'ın 9 karesi ve bu kareyle ilişkili kanallar ve yıldız modelleri için yöntemini içerir. Kullanıcı Kılavuzu ve Uygulama: Bu göstergeleri kullanmadan önce, kullanıcı kılavuzunu okumanız
Breakout Arrows Mt4
Michael Oko Oboh
5 (1)
Trend Breakout Arrows Indicator The Trend Breakout Arrows Indicator is a momentum-based signal tool designed to identify potential bullish and bearish breakout opportunities. It displays clear arrow signals directly on the price chart, helping traders quickly recognize possible trend changes and continuation setups. Up Arrow (Buy Signal) A magenta up arrow appears below a candle when bullish momentum begins to strengthen. This signal indicates that buying pressure may be overtaking selling press
Neo Wave PRO
Nikolay Raykov
5 (1)
Price & Time Market Structure Indicator A professional market structure tool that analyzes waves through both price and time — not price alone. Main Description NeoWave PRO is a professional market structure indicator for MetaTrader 4 designed for traders who want to move beyond traditional one-dimensional wave tools such as ZigZag, swing indicators, and basic high/low systems. Most wave indicators analyze only one thing: Price. But a real market wave is not only a price movement. A true wave de
Bu ürün 2026 piyasası için güncellendi ve en son MT5 sürümleri için optimize edildi. FİYAT GÜNCELLEME BİLDİRİMİ: Smart Trend Trading System şu anda $99 fiyatıyla sunulmaktadır. Sonraki 30 satın alma işleminden sonra fiyat $199 olacaktır. ÖZEL TEKLİF: Smart Trend Trading System satın aldıktan sonra bana özel mesaj gönderin, Smart Universal EA’yı ÜCRETSİZ olarak alın ve Smart Trend sinyallerinizi otomatik işlemlere dönüştürün. Smart Trend Trading System, daha temiz sinyaller, daha iyi trend yönü
BTMM State Engine Pro is a MetaTrader 4 indicator for traders who use the Beat The Market Maker approach: Asian session context, kill zone timing, level progression, peak formation detection, and a multi-pair scanner from a single chart. It combines cycle state logic with a built-in scanner dashboard so you do not need the same tool on many charts at once. What it does Draws the Asian session range; session times can follow broker server offset or be set in inputs. Tracks level progression (L
IQ FX Gann Levels a precision trading indicator based on W.D. Gann’s square root methods . It plots real-time, non-repainting support and resistance levels to help traders confidently spot intraday and scalping opportunities with high accuracy. William Delbert Gann (W.D. Gann) was an exceptional market analyst, whose trading technique was based on a complex blend of mathematics, geometry, astrology, and ancient mathematics which proved to be extremely accurate. Setup & Guide:  Download  MT5 Ver
PRO Renko Sistemi, RENKO grafikleri ticareti için özel olarak tasarlanmış son derece hassas bir ticaret sistemidir. Bu, çeşitli ticaret araçlarına uygulanabilen evrensel bir sistemdir. Sistemi etkin piyasa sana doğru ters sinyallerine erişim hakkı denilen ses nötralize eder. Göstergenin kullanımı çok kolaydır ve sinyal üretiminden sorumlu tek bir parametreye sahiptir. Aracı, seçtiğiniz herhangi bir ticaret aracına ve renko çubuğunun boyutuna kolayca uyarlayabilirsiniz. Yazılımımla karlı bir
GOLD Impulse with Alert
Bernhard Schweigert
4.67 (12)
Bu gösterge, 2 ürünümüz Advanced Currency IMPULSE with ALERT  +   Currency Strength Exotics  'in süper bir kombinasyonudur. Tüm zaman dilimleri için çalışır ve 8 ana para birimi artı bir Sembol için grafiksel olarak güç veya zayıflık dürtüsünü gösterir! Bu Gösterge, Altın, Egzotik Çiftler, Emtialar, Endeksler veya Vadeli İşlemler gibi herhangi bir sembol için para birimi gücü ivmesini göstermek için uzmanlaşmıştır. Türünün ilk örneğidir, Altın, Gümüş, Petrol, DAX, US30, MXN, TRY, CNH vb. içi
Market Structure Order Block Dashboard MT4, piyasa yapısını ve fiyatın ana tepki bölgelerini doğrudan grafikte okumak isteyen yatırımcılar için tasarlanmış bir MetaTrader 4 göstergesidir. BOS, ChoCH, Order Blocks, Fair Value Gaps (FVG), Likidite, Kill Zones, Volume Profile ve hızlı analiz için kompakt bir gösterge panelini birleştirir. Bu gösterge, piyasa yapısı, ICT ve Smart Money kavramlarını karar çerçevesi olarak kullanan yatırımcılara yöneliktir. Trend devamlarını, olası dönüşleri, fiyat de
Enigmera
Ivan Stefanov
5 (8)
ENIGMERA: Pazarın Kalbi Önemli: MQL5.com demosu Strategy Tester'da çalışır ve Enigmera'nın tüm işlevlerini tam olarak yansıtmayabilir. Daha fazla bilgi için açıklamayı, ekran görüntülerini ve videoyu kontrol edin. Herhangi bir sorunuz varsa, bana mesaj göndermekten çekinmeyin! Göstergenin kodu tamamen yeniden yazılmıştır. 3.0 sürümü, yeni işlevler ekler ve göstergenin başlangıcından bu yana biriken hataları giderir. Giriş Bu gösterge ve ticaret sistemi, finansal piyasalara dikkat çekici bir ya
Bu gösterge, pratik ticaret için mükemmel olan otomatik dalga analizine yönelik bir göstergedir! Dava... Not:   Dalga sınıflandırması için Batılı isimleri kullanmaya alışkın değilim. Tang Lun'un (Tang Zhong Shuo Zen) adlandırma kuralının etkisiyle, temel dalgayı   kalem   , ikincil dalga bandını ise   segment   olarak adlandırdım. aynı zamanda segmentin trend yönü vardır. Adlandırma   esas olarak trend segmentidir   (bu adlandırma yöntemi gelecekteki notlarda kullanılacaktır, öncelikle söyleyey
Introduction Harmonic Patterns are best used to predict potential turning point. Traditionally, Harmonic Pattern was identified manually connecting peaks and troughs points in the chart. Manual harmonic pattern detection is painfully tedious and not suitable for everyone. You are often exposed under subjective pattern identification with manual pattern detection. To avoid these limitations, Harmonic Pattern Plus was designed to automate your harmonic pattern detection process. The functionality
Current event:  https://c.mql5.com/1/326/A2SR2025_NoMusic.gif A. A2SR nedir ?   * Önde gelen bir teknik göstergedir (yeniden boyama yok, gecikme yok). -- Rehberlik : -- https://www.mql5.com/en/blogs/post/734748/page4#comment_16532516 adresinde -- ve https://www.mql5.com/en/users/yohana/blog A2SR, Destek (talep) ve Direnç (arz) seviyelerini belirlemede özel bir tekniğe sahiptir. İnternette gördüğümüz sıradan yoldan farklı olarak A2SR, gerçek SR seviyelerini belirlemede özgün bir konsepte sahi
Day Trader Master , günlük tüccarlar için eksiksiz bir ticaret sistemidir. Sistem iki göstergeden oluşmaktadır. Bir gösterge, satın almak ve satmak için bir ok işaretidir. Aldığınız ok göstergesidir. Size ikinci göstergeyi ücretsiz olarak sağlayacağım. İkinci gösterge, bu oklarla birlikte kullanılmak üzere özel olarak tasarlanmış bir trend göstergesidir. GÖSTERGELER TEKRARLAMAYIN VE GEÇ KALMAYIN! Bu sistemi kullanmak çok basittir. İki renkli bir çizgi olarak görüntülenen mevcut trend yönündeki o
Market Structure Patterns MT4
Samuel Manoel De Souza
5 (18)
Market Structure Patterns ,   smart money concepts   (akıllı para kavramları) temelinde geliştirilen ve   SMC/ICT   öğelerini grafik üzerinde gösteren bir göstergedir. Bu öğeler, işlem kararlarınızı bir üst seviyeye taşımanıza yardımcı olur. Grafikte bir unsur oluştuğunda, fiyat bir seviyeyi geçtiğinde veya bir kutu/bölgeye girdiğinde,   uyarılar ,   bildirimler   ve   e-posta mesajları   aracılığıyla anında bilgilendirilirsiniz. Geliştiriciler,   global variables   (küresel değişkenler) aracılı
PZ ABCD Retracement
PZ TRADING SLU
4 (5)
Identify precise entry and exit points with AB=CD patterns This indicator finds AB=CD retracement patterns. The AB=CD Retracement pattern is a 4-point price structure where the initial price segment is partially retraced and followed by an equidistant move from the completion of the pullback, and is the basic foundation for all harmonic patterns. [ Installation Guide | Update Guide | Troubleshooting | FAQ | All Products   ] Customizable pattern sizes Customizable AC and BD ratios Customizable b
Trend Lines PRO
Roman Podpora
5 (1)
TREND ÇİZGİLERİ PRO     Piyasanın gerçek yön değişimini anlamaya yardımcı olur. Gösterge, gerçek trend dönüşlerini ve büyük oyuncuların piyasaya yeniden girdiği noktaları gösterir. Anlıyorsun     BOS hatları  Daha yüksek zaman dilimlerindeki trend değişiklikleri ve önemli seviyeler, karmaşık ayarlar veya gereksiz gürültü olmadan gösterilir. Sinyaller yeniden çizilmez ve çubuk kapandıktan sonra grafikte kalır. VERSION MT 5     -    RFI LEVELS PRO  göstergesiyle birlikte kullanıldığında maksimum p
The Propfolio Master Suite is the ultimate all-in-one analytical workstation for professional traders. Combining the power of the Beat The Market Maker (BTMM) methodology, Smart Money Concepts (SND/Liquidity), and Advanced Volume Profile, this suite replaces multiple different indicators with one optimized engine. Monitor up to 14 pairs simultaneously from a single chart, instantly identify market cycles, and seamlessly map institutional footprints with the click of a button. The Command Center
Legacy of Gann
Pavel Zamoshnikov
4.83 (12)
The indicator very accurately determines the levels of the possible end of the trend and profit fixing. The method of determining levels is based on the ideas of W.D.Gann, using an algorithm developed by his follower Kirill Borovsky. Extremely high reliability of reaching levels (according to K. Borovsky  - 80-90%) Indispensable for any trading strategy – every trader needs to determine the exit point from the market! Precisely determines targets on any timeframes and any instruments (forex, met
RFI levels PRO
Roman Podpora
5 (1)
Bu gösterge, fiyat dönüş noktalarını ve fiyat geri dönüş bölgelerini doğru bir şekilde gösterir.       Başlıca oyuncular   . Yeni trendlerin nerede oluştuğunu görüyorsunuz ve her işlem üzerinde kontrolü elinizde tutarak, azami hassasiyetle kararlar alıyorsunuz. TREND LINES PRO   göstergesiyle birlikte kullanıldığında maksimum potansiyelini ortaya koyar.  VERSION MT5 Göstergenin gösterdiği şey: Yeni bir trendin başlangıcında aktivasyonla birlikte tersine dönüş yapıları ve tersine dönüş seviyeler
ŞU ANDA %40 INDIRIMLI !!! Yeni Başlayanlar veya Uzman Tüccarlar için En İyi Çözüm! Bu gösterge benzersiz, yüksek kaliteli ve uygun fiyatlı bir ticaret aracıdır çünkü bir dizi tescilli özellik ve gizli bir formül ekledik. Yalnızca BİR grafikle 28 döviz çiftinin tümü için Uyarılar verir. Yeni bir trendin veya scalping fırsatının tam tetik noktasını belirleyebildiğiniz için ticaretinizin nasıl gelişeceğini hayal edin! Yeni temel algoritmalar üzerine inşa edilen bu sistem, potansiyel işlemlerin
Yazarın diğer ürünleri
EZT Trend
Tibor Rituper
4.75 (4)
EZT Trend göstergesi size trendi, geri çekilmeyi ve giriş fırsatlarını gösterecektir. İsteğe bağlı filtreleme ve her türlü uyarı mevcuttur. E-posta ve anlık bildirim uyarıları eklendi. Ayrıca bu göstergeyi temel alan ve yakında kullanıma sunulacak bir EA da geliştiriyoruz. İki renkli histogram ve bir çizgiden oluşan çok işlevli bir göstergedir. Bu, bir trendin yönünün ve gücünün görsel bir temsilidir; ayrıca çizgide veya histogramda birçok kez sapma bulacaksınız. Gösterge, otomatik parametre
The FREE version works on Demo account and only CADCHF and NZDCHF pairs. The indicator predict the future candles direction, by scanning past candle movement. Based on the principal: “ The history repeat itself”. Programmed according to Kendall Correlation. In the settings menu, different scanning options are available. When the indicator find a match, start painting future candles from the current candle to the right, also from the current candle to the left as well, showing you the candle pa
FREE
This is a free version of our Great tool with limited functions. The ChartChanger is a great utility tool to reduce the number of open charts on your terminal. There is three section to it: Symbols, Time frames and Templates. You need only one chart to be open and still you can scroll up to multiple ones. Symbols: With the push of a button you can change from one symbol to another, and your applied indicators will stay on the next chart. For the symbols there is an auto detection mode, or you ca
FREE
This indicator can display 1-6 RSI indicator on different timeframes and settings. The active indicators can give visual and sound alert on oversold/overbought level if the user choose that option. Alert can be set on one or all active indicator, even if the timeframe, the period and the oversold/overbought level different on each.There is a display panel with buttons on the main chart, what is show the active indicators and their settings.There is an option to hide this panel. With the buttons
This indicator can display 1-3 CCI indicator on different time frames and settings. The active indicators can give visual and sound alert on oversold/overbought level if the user choose that option. Alert can be set on one or all active indicator, even if the time frame, the period and the oversold/overbought level different on each. There is a display panel with buttons on the main chart, what is show the active indicators and their settings. There is an option to hide this panel. With the butt
This indicator can display 1 or 2 MACD indicator on different time-frames and settings. Uses EMA for calculation. The active indicators can give visual and sound alert on zero-level-cross if the user choose that option. Alert can be set on one or both active indicator, even if the time-frame, and the period different on each. When alert set to both, the two MACD histogram must be on the same size of the 0 level to get an arrow. There is a display panel with buttons on the main chart, what is sho
EZT Macd Pro
Tibor Rituper
5 (4)
Yazılım açıklaması Bu gösterge, farklı zaman dilimlerinde ve ayarlarda 1 veya 2 MACD göstergesini görüntüleyebilir. Hesaplama için EMA'yı kullanan ÜCRETSİZ bir sürüm var. Bu Pro sürümü hesaplama için 4 Hareketli ortalama türünün tamamını kullanır: Basit, üstel, düzeltilmiş ve doğrusal ağırlıklı. Aktif göstergeler açılır pencere, ses, push veya e-posta uyarısı verebilir. Yalnızca sıfır seviye geçişinde ücretsiz sürüm uyarısı olan bu Pro sürüm uyarısı, kullanıcı bu seçeneği seçerse sıfır seviye g
ChartChanger, terminalinizdeki açık haritaların sayısını azaltmak için harika bir yardımcı araçtır. Üç bölüm vardır: Semboller, Zaman Çerçeveleri ve Şablonlar. Açmak için yalnızca bir grafiğe ihtiyacınız var ve yine de birden fazla grafiğe doğru ilerleyebilirsiniz. Semboller: Bir düğmeye basarak bir sembolden diğerine geçiş yapabilirsiniz ve uygulanan göstergeleriniz bir sonraki grafikte kalacaktır. Semboller için bir otomatik algılama modu vardır veya istediğiniz sembolleri manuel olarak girebi
Bu, Çoklu Zaman Çerçevesi Raptiye çubuğu uyarı göstergesidir. Yalnızca geçerli zaman diliminde veya 1 dakikadan aya kadar tüm zaman dilimlerinde kullanabilirsiniz. Tüm zaman dilimlerini seçtiğinizde, grafiğinizin açık olduğu mevcut zaman dilimi ve yukarıdaki zaman dilimleri hakkında uyarı alırsınız. Seçilen her zaman dilimi için ayrı ayrı Açılır pencere, e-posta ve anında bildirim uyarıları vardır. Gösterge fiyat tablosuna bir ok yerleştirir. Boğa yönlü/Uzun Pin çubuk için fiyat çizgisinin a
Bu, Çoklu Zaman Dilimi yutan mum uyarı göstergesidir. Yalnızca geçerli zaman diliminde veya 1 dakikadan aya kadar tüm zaman dilimlerinde kullanabilirsiniz. Bu, yeniden boyanmayan bir MTF göstergesidir. Seçilen zaman dilimleri seçeneğini (Çoklu Zaman Çerçevesi modu) kullandığınızda, gerçek geçerli zaman dilimi ve üzerindeki sinyalleri görebilirsiniz. Seçilen her zaman dilimi için ayrı ayrı Açılır pencere, e-posta ve anında bildirim uyarıları vardır. Gösterge fiyat tablosuna bir nokta yerleşt
This is a great utility tool to see valuable information on your chart. The panel is free-floating, grab with your mouse and move around on the chart with ease. Also the panel is collapsible so you can save space, and you can see only the information you wish. There is three section to the panel, when is closed you can see the top section only. Here the list of information you can see on the panel, from the top to bottom: The first part of the panel: Price : The color is changing according to d
EZT_Ichimoku_MTF Multitimeframe Ichimoku indicator. Display up to 4 different Ichimoku on the chart. Every line of every ichimoku is customizable, you can turn off/on or choose different thickness or color. You can choose to see only the cloud in multiple ichimokus. Optional info panel to identify the different Ichimokus. Works the same way like the original Ichimoku indicator.
EZT Trade History This is a great tool to analyze past trades or follow current ongoing trades, especially when you using an EA to manage your transactions. You will see the exact candle where the trade was opened and closed. Collapsible floating panel on the chart, free to move anywhere with your mouse. When you using multiple EA’s with different magic numbers, you have 5 options to separate those trades, so you will know which EA opened specific transactions. You can set the day limits how fa
EZT Bollinger Trendline Indicator based on multiple settings of Bollinger Band. In the menu you can choose the similar settings than bollinger band indicator. Trend period and trend deviations. Also paint and arrow on chart when direction change. Three different kind of alert , such as pop up, e-mail and push notification. Try different settings on different timeframes. Please help my work and rate and comment my products!
The indicator predict the future candles direction, by scanning past candle movement. Based on the principal: “ The history repeat itself”. Programmed according to Kendall Correlation. In the settings menu, different scanning options are available. When the indicator find a match, start painting future candles from the current candle to the right, also from the current candle to the left as well, showing you the candle pattern what the actual signal is based on. The left side candle are optiona
Filtrele:
Lasse Michael Holm
1604
Lasse Michael Holm 2020.05.20 01:36 
 

I really love this indicator so much!! Best on this forum. The histogram makes it so easy to read. 10 star!

Sio Fong Fok
320
Sio Fong Fok 2019.09.29 14:05 
 

nice indicator

Değerlendirmeye yanıt