EZT Macd Pro

5
Yazılım açıklaması
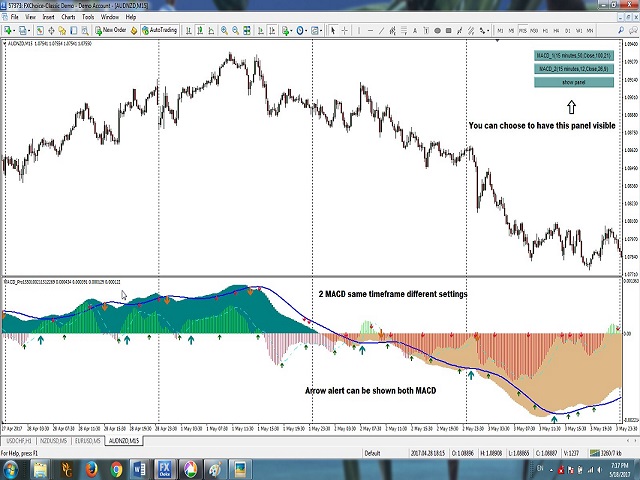
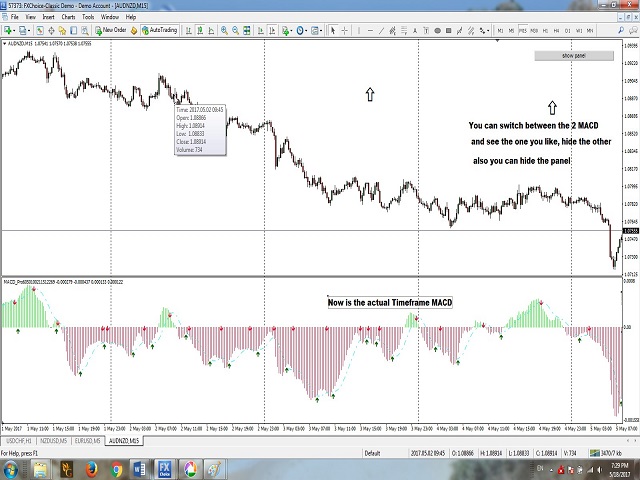
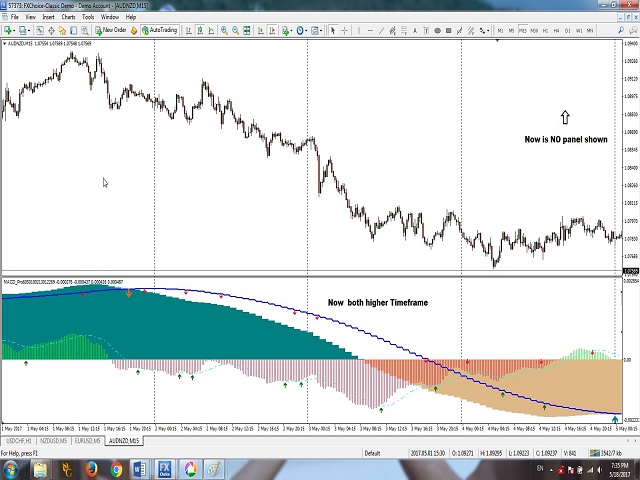
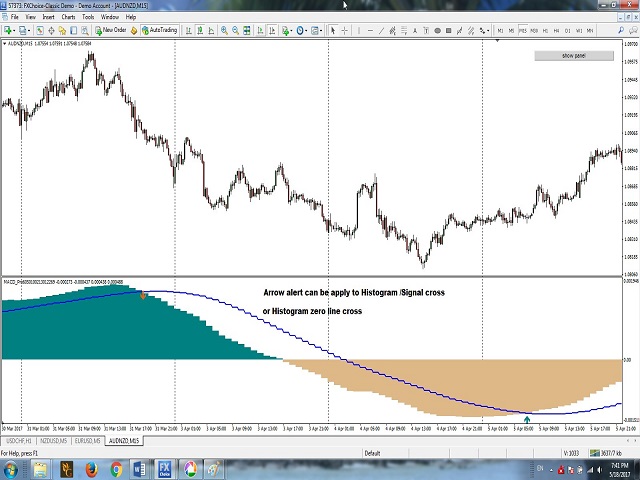
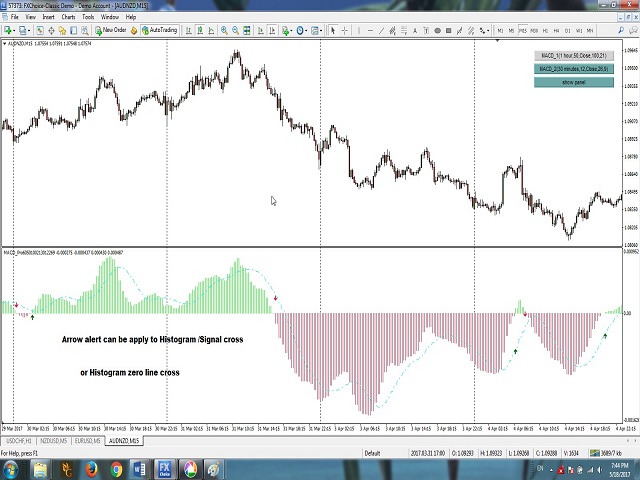
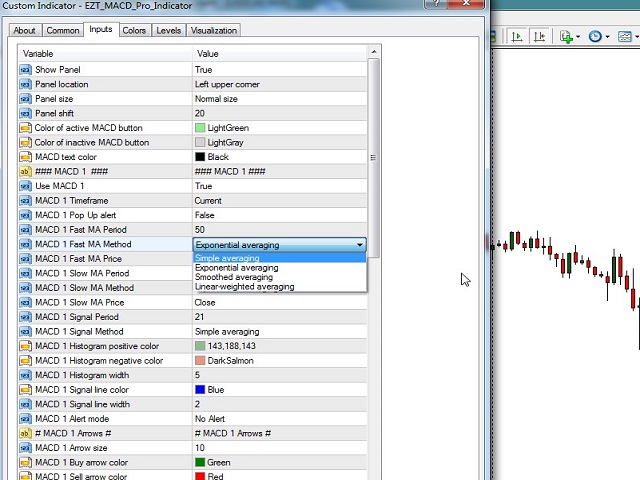
Bu gösterge, farklı zaman dilimlerinde ve ayarlarda 1 veya 2 MACD göstergesini görüntüleyebilir. Hesaplama için EMA'yı kullanan ÜCRETSİZ bir sürüm var. Bu Pro sürümü hesaplama için 4 Hareketli ortalama türünün tamamını kullanır: Basit, üstel, düzeltilmiş ve doğrusal ağırlıklı. Aktif göstergeler açılır pencere, ses, push veya e-posta uyarısı verebilir. Yalnızca sıfır seviye geçişinde ücretsiz sürüm uyarısı olan bu Pro sürüm uyarısı, kullanıcı bu seçeneği seçerse sıfır seviye geçişine veya histogram-sinyal hattı geçişine ayarlanabilir. Zaman çerçevesi ve dönem her birinde farklı olsa bile, aktif göstergelerden biri veya her ikisi için uyarı ayarlanabilir. 2 MACD göstergesi kullanıldığında uyarı her birinde ayrı ayrı çalışabilir.

Ana grafik üzerinde aktif göstergeleri ve ayarlarını gösteren butonların bulunduğu bir gösterge paneli bulunmaktadır. Bu paneli gizleme seçeneği var. Geçici düğmelerle aktif MACD'lerden birini gizleyebilirsiniz.

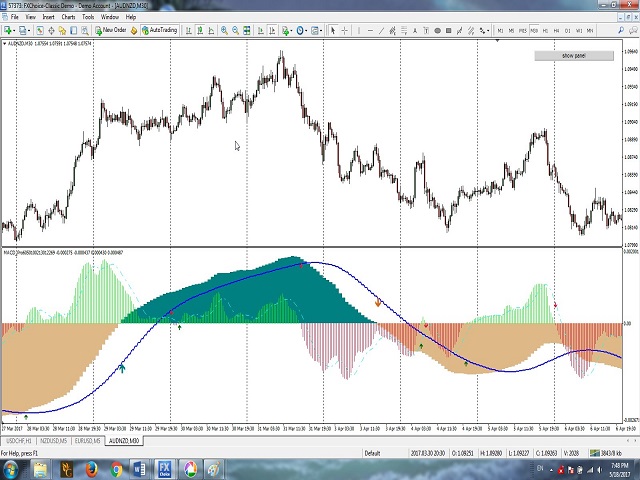
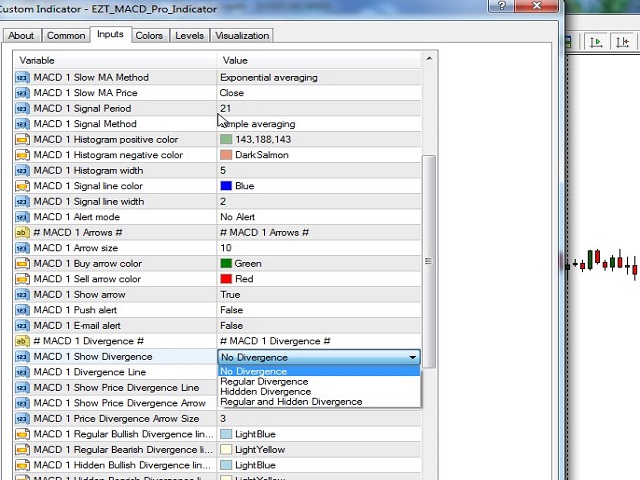
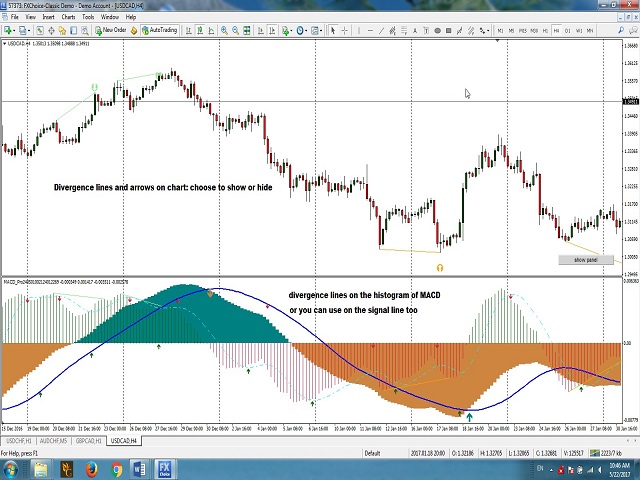
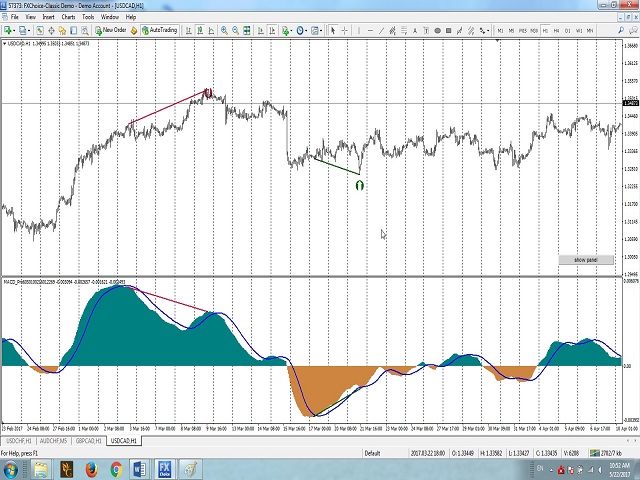
Ücretsiz sürümde bulunmayan ekstra özellik eklendi: Diverjans. Her iki MACD'de de Diverjansı göstermeyi seçebilirsiniz. Düzenli veya gizli sapmayı seçebilir veya her ikisine birden sahip olabilirsiniz. Farklılığın histogramda veya sinyal hattında olmasını seçebilirsiniz. Ayrıca çizgilerin yalnızca MACD alt penceresinde veya Fiyat grafiğinde ve MACD'de görüntülenmesini sağlayabilirsiniz. Fiyat grafiğinde ayrıca sapmayı gösteren okları da görüntüleyebilirsiniz. Uyarıları iki tür farklılık için ayrı ayrı ayarlayabilirsiniz. Renkler ve çizgi kalınlığı seçenekleri için tam özelleştirme.


Ayarlar
Panel konumu - Ana grafikteki görüntüleme paneli, hangi köşeyi görmek istiyorsunuz?
Paneli Göster - doğru veya yanlış. Yalnızca Pro sürümünde bu seçenek bulunur.
Panel boyutu - Normal veya büyük boyutu seçebilirsiniz.
Panel kaydırma - Panelin yandan ne kadar uzakta olmasını istediğiniz.
Etkin MACD düğmesinin rengi - Etkin MACD.
Etkin olmayan MACD düğmesinin rengi - Etkin MACD ancak geçici olarak gizlendi.
MACD kullanın - yalnızca birini veya her ikisini birden seçin: doğru/yanlış.
MACD zaman çerçevesi - her MACD farklı bir zaman diliminde olabilir.
Uyarı - doğru/yanlış: ok üzerinde açılır uyarı.
MA yöntemi - 4 hareketli ortalamadan herhangi birini kullanın: Basit, Üstel, Düzleştirilmiş, Doğrusal ağırlıklı / yalnızca Pro sürümü.
MA Fiyatı - 7 türden herhangi birini kullanın: Kapalı, Açık, Yüksek, Düşük, Medyan, Tipik, Ağırlıklı.
MACD Diverjansı gösterir - Türünüzü seçin: Diverjans yok, Normal, Gizli veya her ikisi.
MACD sapma çizgisi - Uzaklaşma çizgisini histograma veya sinyal çizgisine uygulayın. Yalnızca birini seçin.
Fiyat sapma çizgisini göster - Doğru olarak ayarlandığında, farklılık çizgisi fiyat grafiğinde de görünür.
Fiyat farklılaşma okunu göster - Doğru olarak ayarlandığında, fiyat grafiğindeki ok farklılığı gösterecektir.
Uyarı modu - Histogram-sıfır çizgisi geçişi veya histogram-sinyal çizgisi geçişi veya hiçbiri için uyarıyı ayarlayabilirsiniz. Uyarı türünüzü seçin.
lütfen bir inceleme veya derecelendirme yazarak işime yardımcı olun
Değerlendirmeler 4
Larrydeelf
598
Larrydeelf 2024.03.07 17:07 
 

after watching the indicator perform this week I can say that this is a very good indicator it help me verify on my direction regarding price movement great job.

intan08
1388
intan08 2021.07.28 09:08 
 

Worth every penny.

Lasse Michael Holm
1604
Lasse Michael Holm 2020.05.20 01:44 
 

At last, a MACD indicator that works for me. Love the MTF capabilities and the possibilities for divergens on chart. Just grab this one 😃👍

Önerilen ürünler
MACD Max
John Louis Fernando Diamante
A flexible 2-Line MACD indicator The default MACD indicator inside MT4, limits you to using the MACD with a fast-EMA, slow-EMA, and signal-SMA. This MACD indicator allows you to set your own MA-Method choices for these 3 components, separately! You can select from SMA-EMA-SMMA-LWMA-DEMA-TEMA, and can even use a separate method for each 3 fast-slow-signal periods. On-chart colored candles, with drawing condition types is included, with a show/hide button too. Features - MA Methods: SMA, EMA, SMM
Trend Osilatörü - gelişmiş bir özel Crypto_Forex göstergesi, etkili bir ticaret aracıdır! - Gelişmiş yeni hesaplama yöntemi kullanılır - "Hesaplama için fiyat" parametresi için 20 seçenek. - Şimdiye kadar geliştirilen en akıcı osilatör. - Yükselen trendler için yeşil renk, düşen trendler için kırmızı renk. - Aşırı satım değerleri: 5'in altında, Aşırı alım değerleri: 95'in üzerinde. - Bu göstergeyle standart stratejileri bile yükseltmek için birçok fırsat vardır. - PC ve Mobil uyarılarla. Yüksek
TT MACD Dashboard is multi-time frame and multi-currency market scanner. It is telling you the value of MACD and MACD histogram (a difference between MACD line and Signal line) in a form of small rectangle. If MACD value is above zero (MACD is bullish). Rectangle border color is bullish (Navy by default).  If MACD value is below zero (MACD is bearish). Rectangle border color is bearish (OrangeRed by default). If MACD histogram is rising and above zero (Bullish histogram). Rectangle color is bull
The indicator depends on the price action's analysis how is based on the rsi indicator and the moving average line from a platform containing multi symbols and different time-frames with the possibility to select your desired symbols and time-frames . Special Characteristics :  *  Real time analysis or at price close .  * The possibility to open several windows with the selected symbols .   *     Different alert systems .    Indicator  Characteristics :  * Multiple symbol and time frame with t
Power Renko is an indicator which plots Renko bricks underneath the chart using a histogram. You can select the brick size and the timeframe of the Renko bricks as well as whether or not to use the close price or the high/low price of the candles. Renko bricks are based on price alone, not time, therefor the Renko bricks will not be aligned with the chart's time. They are extremely useful for trend trading and many different strategies can be formed from them. Buffers are provided allowing you t
Color Stochastic Enhanced Stochastic Oscillator with Cross Detection and Visual Signal Support Overview Color Stochastic is a customized version of the classic Stochastic Oscillator designed for momentum analysis and crossover visualization. The indicator provides color-based signal marking and configurable crossover detection at user-defined overbought and oversold levels. It can be used as part of: Momentum analysis Mean reversion workflows DCA-based strategies Multi-indicator confirmation sys
[ZhiBiCCI] indicators are suitable for all cycle use, and are also suitable for all market varieties. [ZhiBiCCI] Green solid line is a reversal of bullish divergence. The green dotted line is a classic bullish divergence. [ZhiBiCCI] The solid line to the red is a reverse bearish divergence. The red dotted line is a classical bearish divergence. [ZhiBiCCI] can be set in the parameters (Alert, Send mail, Send notification), set to (true) to send instant signals to the alarm window, email, insta
Based on MACD indicator waves with standard parameters Applies Fibonacci levels to the last two MACD waves, positive and negative respectively, if at the moment the MACD indicator runs out of negative Wave - the color is green, if at the moment the MACD indicator runs out of positive Wave - the color is red. The Wave termination criterion is two ticks with a different MACD sign. Applies trend lines on the last four MACD Waves. Works well with the expert Figures MACD   https://www.mql5.com/ru/mar
Lyne
Maksim Kalachev
About the Lyne indicator Lyne is a Metatrader 4 (MT4) indicator, the essence of which is to transform the accumulated historical data. The Lyne indicator makes it possible to detect various features and patterns in price dynamics that are invisible to the naked eye. Based on this information, traders can anticipate further price movement and adjust their strategy accordingly. This indicator has proven itself in the scalping strategy. The indicator works without repainting.
FXC iDeM-DivergencE MT4 Indicator This is an advanced DeMarker indicator that finds trend-turn divergences on the current symbol. The indicator detects divergence between the DeMarker and the price movements as a strong trend-turn pattern. Main features: Advanced divergence settings Price based on Close, Open or High/Low prices Give Buy/Sell open signals PUSH notifications E-mail sending Pop-up alert Customizeable Information panel Input parameters: DeM Period: The Period size of the DeMarker in
The Stochastic Oscillator is a momentum indicator that uses support and resistance levels. The term "stochastic" refers to the point of a current price in relation to its price range over a period of time. You can use a New Stochastic in the same way as classical one: Overbought and Oversold areas to make a Buy or Sell orders. This new indicator shows all variety of Fibonacci Levels (from 23.6 to 76.4) which can be used as Overbought and Oversold levels as well as points to close an open positio
Garuda Fire MT4
Maldini Yoga Pratama
EA Garuda Fire MT4 .This is the logical development of EA Dragon Fire ultimate, with the addition of better logic and confirmation than before.   EA Garuda Fire MT4   is a trend following system for swing trading based on PLT indicator filtered by I-gentor LSMA. no need to add any indicators because everything is included in this EA code, so the trading decisions are simple and immediate without confusion that can result from the use of many indicators Only   10 download  of the EA left  at $69
Unlock hidden profits: accurate divergence trading for all markets Tricky to find and scarce in frequency, divergences are one of the most reliable trading scenarios. This indicator finds and scans for regular and hidden divergences automatically using your favourite oscillator. [ Installation Guide | Update Guide | Troubleshooting | FAQ | All Products ] Easy to trade Finds regular and hidden divergences Supports many well known oscillators Implements trading signals based on breakouts Display
Bu gösterge, fiyat ile Hareketli Ortalama Yakınsama Sapması ( MACD ) ve Göreceli Güç Endeksi ( RSI ) teknik göstergeleri arasındaki sapmaları tespit eder. Göstergenin sinyalleri yeniden çizilmez; ok işareti bulunan çubuk kapandıktan sonra giriş sinyali görünür. Sapma şu şekilde tanımlanır: Fiyat grafiği yeni bir zirve yaparsa ve MACD veya RSI değeri önceki seviyenin altında kalırsa, bu düşüş yönlü bir sapmadır. Fiyat grafiği yeni diplere düşerse ve MACD veya RSI değeri önceki seviyelerin üzer
The input parameter  counted_bars  determines on how many bars the indicator lines will be visible. The input parameter  barsNum is the period for bands calculation. When PriceClose for previous bar is above upper band a Long position may be opened. When PriceClose for previous bar is under lower band a Short position may be opened. If the current Price is between bands it is time to wait.
Mini Crypto Trading Dashboard
Opengates Success International
Micro Crypto Trading Dashboard This is a custom indicator created to give CRYPTO TRADERS a full view of what is going on in the Crypto market. It uses a real time data to access the market and display every bit of information needed to make successful trading. This is a Micro size of the Compact Crypto Market Trading Dashboard Indicator created mainly for trading Crypto Currencies Markets for a living. They practically perform the same operation but MicroMini FFMV Dashboard has a few features.
URGENCY “Limited launch pricing” “Price increases after version 2.0” Currencies Gold Momentum Flow Dashboard  — See Market Strength Instantly A powerful all-in-one dashboard that shows real-time momentum across multiple timeframes (M5–D1) for forex and gold. Multi-timeframe ROC analysis Built-in trade signals (alignment & momentum shifts) Currency strength meter Heatmap for instant trend recognition Alerts + one-click pair switching Stop switching charts — see the entire market in
Stochastic Divergen MT4
Komang Putra Riswanjaya
Overview The Stochastic Divergence Indicator is a tool designed to help identify potential market turning points by analyzing divergences between price and the Stochastic Oscillator. It highlights divergence signals visually on the chart, assisting traders in observing possible trend changes. Key Features No Repaint: Once a signal is formed, it remains on the chart. Adjustable Parameters: Settings can be modified to fit different trading preferences and timeframes. Visual Display: Arrows are pl
Wave Wolf MT4
Andrei Salanevich
Forex Dalga Kurt MT4 göstergesi, Wolf dalgalarını aramak ve mevcut ticaret terminali penceresinde görüntülemek için tasarlanmıştır. Ticarette Wolfe dalgalarını kullanan tüccarlar için mükemmel bir gösterge. Ticaret stratejilerinde kullanımı, verimliliğini ve karlılığını önemli ölçüde artıracaktır. GÖSTERGE BİLGİSİ Diğer Wolf dalga göstergelerinin aksine, forex Wave Wold MT4 göstergesinin etkinliğini önemli ölçüde artıran birçok özelliği vardır: Birincisi, Açık Windows 5Point (true) ayarı bilg
Super Reversal Pattern
Parfait Mujinga Ndalika
Super Reversal Pattern Indicator Unlock the power of advanced pattern recognition with our Super Reversal Pattern Indicator. Designed for traders seeking precision and reliability, this indicator identifies one of the most effective reversal patterns in technical analysis, offering a significant edge in your trading strategy. Key Features: Non-Repainting Accuracy: Enjoy the confidence of non-repainting technology. Once a Super Reversal Pattern is detected, it remains static, providing consiste
Forex Gump
Andrey Kozak
2.4 (5)
Forex Gump is a fully finished semi-automatic trading system. In the form of arrows, signals are displayed on the screen for opening and closing deals. All you need is to follow the instructions of the indicator. When the indicator shows a blue arrow, you need to open a buy order. When the indicator shows a red arrow, you need to open a sell order. Close orders when the indicator draws a yellow cross. In order to get the most effective result, we recommend using the timeframes H1, H4, D1. There
Infinity Trend Pro
Yaroslav Varankin
1 (1)
This is a trend indicator without redrawing Developed instead of the binary options strategy (by the color of the Martingale candlestick) Also works well in forex trading When to open trades (binary options) A signal will appear in the place with a candle signaling the current candle It is recommended to open a deal for one candle of the current timeframe M1 and M5 When a blue dot appears, open a deal up When a red dot appears, open a trade down. How to open trades on Forex. When a signal is rec
Concept Mean reversion is a concept in trading based on prices eventually returning to their mean or average level after a period of divergence or departure from the historical mean. Traders deploying mean reversion techniques typically wait for assets to diverge significantly from their mean values and then place trades on the assumption the price will return to the mean at some point in the future- this is also known as re-coupling or convergence. There are several mean reversion based trading
Elegant RSI
Syed Oarasul Islam
Elegant RSI indicator can generate RSI divergence with the availability of user defined filters. It can generate voice alerts for RSI oversold and RSI Overbought situations. Moreover it can also generate voice alerts for RSI Divergneces as well as when price breaks above or breaks below the support and resistances created upon divergence ouccurence.  The voice alerts are generated in a way that you will know which market has reached the oversold and overbought conditions as well as the rsi Dive
Insider Scalper Binary This tool is designed to trade binary options. for short temporary spends. to make a deal is worth the moment of receiving the signal and only 1 candle if it is m1 then only for a minute and so in accordance with the timeframe. for better results, you need to select well-volatile charts.... recommended currency pairs eur | usd, usd | jpy .... the indicator is already configured, you just have to add it to the chart and trade .... The indicator signals the next candle.
Noize Absorption Index MT4
Ekaterina Saltykova
5 (1)
Noize Absorption Index - is the manual trading system that measures the difference of pressure between bears forces and bulls forces. Green line - is a noize free index that showing curent situation. Zero value of index shows totally choppy/flat market.Values above zero level shows how powerfull bullish wave is and values below zero measures bearish forces.Up arrow appears on bearish market when it's ready to reverse, dn arrow appears on weak bullish market, as a result of reverse expectation. S
MetaTrader 4 (MT4) için "Two Moving Average Crossover" göstergesi, iki hareketli ortalamayı görüntüleyen ve hareketli ortalamalar birbirini geçtiğinde bildirimde bulunan bir teknik analiz aracıdır. Gösterge, biri daha hızlı ve diğeri daha yavaş olan iki hareketli ortalamayı hesaplar ve çizer. Daha hızlı hareketli ortalama daha yavaş hareketli ortalamanın üzerine çıktığında, bu bir yükseliş sinyali olarak kabul edilir ve potansiyel bir trendin tersine döndüğünü veya yeni bir yükseliş trendinin b
The indicator detects and displays Shark harmonic pattern (see the screenshot). The pattern is plotted by the extreme values of the ZigZag indicator (included in the resources, no need to install). After detecting the pattern, the indicator notifies of that by a pop-up window, a mobile notification and an email. The indicator highlights the process of the pattern formation and not just the complete pattern. In the former case, it is displayed in the contour triangles. After the pattern is comple
An indicator of pattern #31 ("Long Island") from Encyclopedia of Chart Patterns by Thomas N. Bulkowski. The second gap is in the opposite direction. Parameters: Alerts - show alert when an arrow appears   Push - send a push notification when an arrow appears (requires configuration in the terminal) GapSize - minimum gap size in points ArrowType - a symbol from 1 to 17 ArrowVShift - vertical shift of arrows in points   ShowLevels - show levels ColUp - color of an upward line ColDn - color of a
Download the free USDJPY version   here. MACD Indicator The Moving Average Convergence and Divergence (MACD) is a trend following momentum indicator which shows the relationship between two moving averages that we chose and configure them on the indicator. The MACD is calculated by subtracting the 26-period exponential moving average and the 12 period D.A.M. These are the default parameters when you put the MACD indicator on the charts, and the period is usually 9 which means the last 9 candles
Bu ürünün alıcıları ayrıca şunları da satın alıyor
Neuro Poseidon MT4
Daria Rezueva
4.96 (27)
Neuro Poseidon is a new indicator by Daria Rezueva. It combines precise trading signals with adaptive TP/SL levels - creating best possible trades as a result! Message me and get  Neuro Poseidon Assistant  as a gift to automize your trading process! What makes it stand out? 1. Proven profitability on all assets and timeframes 2. Only confirmed BUY and SELL signals present on the chart 3. Adaptive TP & SL levels generated by the software for each trade 4. Easy to understand - suitable for all
M1 Sniper
Oleg Rodin
5 (23)
M1 SNIPER kullanımı kolay bir işlem göstergesi sistemidir. M1 zaman dilimi için tasarlanmış bir ok göstergesidir. Gösterge, M1 zaman diliminde scalping için bağımsız bir sistem olarak kullanılabilir ve mevcut işlem sisteminizin bir parçası olarak kullanılabilir. Bu işlem sistemi özellikle M1'de işlem yapmak için tasarlanmış olsa da, diğer zaman dilimleriyle de kullanılabilir. Başlangıçta bu yöntemi XAUUSD ve BTCUSD ticareti için tasarladım. Ancak bu yöntemi diğer piyasalarda işlem yaparken de ya
Gann Made Easy
Oleg Rodin
4.84 (164)
Gann Made Easy , bay teorisini kullanarak ticaretin en iyi ilkelerine dayanan, profesyonel ve kullanımı kolay bir Forex ticaret sistemidir. WD Gann. Gösterge, Zararı Durdur ve Kâr Al Seviyeleri dahil olmak üzere doğru SATIN AL ve SAT sinyalleri sağlar. PUSH bildirimlerini kullanarak hareket halindeyken bile işlem yapabilirsiniz. Satın alma işleminden sonra, alım satım talimatlarını ve harika ek göstergeleri ücretsiz olarak almak için lütfen benimle iletişime geçin! Muhtemelen Gann ticaret yöntem
Scalper Inside PRO
Alexey Minkov
4.74 (68)
Scalper Inside PRO Scalper Inside PRO is an intraday trend and scalping indicator for MetaTrader 4 that uses an exclusive algorithm to quickly detect market direction and key target levels. It automatically calculates entry, exit and multiple profit targets, and shows detailed performance statistics so you can see how different instruments and strategies performed. This helps you choose the most suitable trading instruments for the current market conditions. Additionally, you can easily integrat
Dynamic Forex28 Navigator
Bernhard Schweigert
4.43 (7)
Dynamic Forex28 Navigator - Yeni Nesil Forex Ticaret Aracı. ŞU ANDA %49 İNDİRİM. Dynamic Forex28 Navigator, uzun zamandır popüler olan göstergelerimizin evrimidir ve üçünün gücünü tek bir göstergede birleştirir: Gelişmiş Döviz Gücü28 Göstergesi (695 inceleme) + Gelişmiş Döviz İMPULS ve UYARI (520 inceleme) + CS28 Kombo Sinyalleri (Bonus). Gösterge hakkında ayrıntılar https://www.mql5.com/en/blogs/post/758844 Yeni Nesil Güç Göstergesi Ne Sunuyor?  Orijinallerde sevdiğiniz her şey, şimdi yeni
PRO Renko Sistemi, RENKO grafikleri ticareti için özel olarak tasarlanmış son derece hassas bir ticaret sistemidir. Bu, çeşitli ticaret araçlarına uygulanabilen evrensel bir sistemdir. Sistemi etkin piyasa sana doğru ters sinyallerine erişim hakkı denilen ses nötralize eder. Göstergenin kullanımı çok kolaydır ve sinyal üretiminden sorumlu tek bir parametreye sahiptir. Aracı, seçtiğiniz herhangi bir ticaret aracına ve renko çubuğunun boyutuna kolayca uyarlayabilirsiniz. Yazılımımla karlı bir
Enigmera
Ivan Stefanov
5 (8)
ENIGMERA: Pazarın Kalbi Önemli: MQL5.com demosu Strategy Tester'da çalışır ve Enigmera'nın tüm işlevlerini tam olarak yansıtmayabilir. Daha fazla bilgi için açıklamayı, ekran görüntülerini ve videoyu kontrol edin. Herhangi bir sorunuz varsa, bana mesaj göndermekten çekinmeyin! Göstergenin kodu tamamen yeniden yazılmıştır. 3.0 sürümü, yeni işlevler ekler ve göstergenin başlangıcından bu yana biriken hataları giderir. Giriş Bu gösterge ve ticaret sistemi, finansal piyasalara dikkat çekici bir ya
Trend Lines PRO
Roman Podpora
5 (1)
TREND ÇİZGİLERİ PRO     Piyasanın gerçek yön değişimini anlamaya yardımcı olur. Gösterge, gerçek trend dönüşlerini ve büyük oyuncuların piyasaya yeniden girdiği noktaları gösterir. Anlıyorsun     BOS hatları  Daha yüksek zaman dilimlerindeki trend değişiklikleri ve önemli seviyeler, karmaşık ayarlar veya gereksiz gürültü olmadan gösterilir. Sinyaller yeniden çizilmez ve çubuk kapandıktan sonra grafikte kalır. VERSION MT 5     -    RFI LEVELS PRO  göstergesiyle birlikte kullanıldığında maksimum p
KT Alpha Hunter Arrows MT4
KEENBASE SOFTWARE SOLUTIONS
Çoğu ok göstergesi size yalnızca bir sinyal verir ve geri kalan her şeyi sizin çözmenizi bekler. KT Alpha Hunter Arrows ise size eksiksiz bir işlem planı sunar. Her sinyal oku, grafikte hazır bir planla birlikte görünür: giriş çizgisi, stop loss, dört take profit seviyesi ve bu sembol ile zaman diliminin o anda işlem yapmaya değer olup olmadığını gösteren canlı edge kararı. Pakete dahil olan Trade Manager EA, siz işleme girdikten sonra yönetimi üstlenir. Böylece piyasa hareketli ve duygusal açıd
Trend Catcher ind
Ramil Minniakhmetov
5 (1)
TREND YAKALAYICI GÖSTERGE Trend Yakalayıcı Gösterge, yazarın tescilli ve özelleştirilmiş uyarlanabilir trend analiz göstergelerinin bir kombinasyonunu kullanarak piyasa fiyat hareketlerini analiz eder. Kısa vadeli gürültüyü filtreleyerek ve temel momentum gücüne, volatilite genişlemesine ve fiyat yapısı davranışına odaklanarak gerçek piyasa yönünü belirler. Ayrıca, hareketli ortalamalar, RSI ve volatilite filtreleri gibi yumuşatma ve trend filtreleme özelleştirilmiş göstergelerinin bir kombina
Bu gösterge, pratik ticaret için mükemmel olan otomatik dalga analizine yönelik bir göstergedir! Dava... Not:   Dalga sınıflandırması için Batılı isimleri kullanmaya alışkın değilim. Tang Lun'un (Tang Zhong Shuo Zen) adlandırma kuralının etkisiyle, temel dalgayı   kalem   , ikincil dalga bandını ise   segment   olarak adlandırdım. aynı zamanda segmentin trend yönü vardır. Adlandırma   esas olarak trend segmentidir   (bu adlandırma yöntemi gelecekteki notlarda kullanılacaktır, öncelikle söyleyey
Genesis Matrix Pro is a professional multi-timeframe trend detection indicator designed to help traders identify high-quality market alignment with clarity and structure. It combines 12 different technical indicators into one visual alignment matrix, allowing traders to quickly see when market conditions are bullish, bearish, or neutral. A signal is generated only when the selected strategies are aligned, helping reduce noise and improve decision-making. PLEASE CONTACT ME AFTER PURCHASE TO GET
Bu ürün 2026 piyasası için güncellendi ve en son MT5 sürümleri için optimize edildi. FİYAT GÜNCELLEME BİLDİRİMİ: Smart Trend Trading System şu anda $99 fiyatıyla sunulmaktadır. Sonraki 30 satın alma işleminden sonra fiyat $199 olacaktır. ÖZEL TEKLİF: Smart Trend Trading System satın aldıktan sonra bana özel mesaj gönderin, Smart Universal EA’yı ÜCRETSİZ olarak alın ve Smart Trend sinyallerinizi otomatik işlemlere dönüştürün. Smart Trend Trading System, daha temiz sinyaller, daha iyi trend yönü
PZ Trend Trading
PZ TRADING SLU
4.8 (5)
Capture every opportunity: your go-to indicator for profitable trend trading Trend Trading is an indicator designed to profit as much as possible from trends taking place in the market, by timing pullbacks and breakouts. It finds trading opportunities by analyzing what the price is doing during established trends. [ Installation Guide | Update Guide | Troubleshooting | FAQ | All Products ] Trade financial markets with confidence and efficiency Profit from established trends without getting whips
Step into the world of Forex trading with confidence, clarity, and precision using   Gold Indicator   a next-generation tool engineered to take your trading performance to the next level. Whether you’re a seasoned professional or just beginning your journey in the currency markets, Gold Indicator equips you with powerful insights and help you trade smarter, not harder. Built on the proven synergy of three advanced indicators, Gold Indicator focuses exclusively on medium and long-term trends eli
MetaBands M4
Vahidreza Heidar Gholami
3.5 (6)
MetaBands uses powerful and unique algorithms to draw channels and detect trends so that it can provide traders with potential points for entering and exiting trades. It’s a channel indicator plus a powerful trend indicator. It includes different types of channels which can be merged to create new channels simply by using the input parameters. MetaBands uses all types of alerts to notify users about market events. Features Supports most of the channel algorithms Powerful trend detection algorith
PZ Swing Trading
PZ TRADING SLU
5 (3)
Protect against whipsaws: revolutionize your swing trading approach Swing Trading is the first indicator designed to detect swings in the direction of the trend and possible reversal swings. It uses the baseline swing trading approach, widely described in trading literature. The indicator studies several price and time vectors to track the aggregate trend direction and detects situations in which the market is oversold or overbought and ready to correct. [ Installation Guide | Update Guide | Tro
Current event:  https://c.mql5.com/1/326/A2SR2025_NoMusic.gif A. A2SR nedir ?   * Önde gelen bir teknik göstergedir (yeniden boyama yok, gecikme yok). -- Rehberlik : -- https://www.mql5.com/en/blogs/post/734748/page4#comment_16532516 adresinde -- ve https://www.mql5.com/en/users/yohana/blog A2SR, Destek (talep) ve Direnç (arz) seviyelerini belirlemede özel bir tekniğe sahiptir. İnternette gördüğümüz sıradan yoldan farklı olarak A2SR, gerçek SR seviyelerini belirlemede özgün bir konsepte sahi
M30/H1/H4 Swing versiyonu mevcut Büyük hareketleri yakalamak mı istiyorsunuz? Gold Signal Swing Pro (M30/H1/H4). Hedef: işlem başına $20-$80+. https://www.mql5.com/en/market/product/177643 KURAMA GOLD SIGNAL PRO (MT4) — 7 Katmanlı Filtre, Otomatik TP/SL ve Kalite Puanı ile Komple XAUUSD Trading Sistemi REPAINT YOK. YENİDEN ÇİZİM YOK. GECİKME YOK. Her sinyal kalıcıdır. Gördüğün, aldığındır. BONUS: Ömür boyu lisansı al ve AI Zone Radar ($59 değerinde)
BTMM State Engine Pro is a MetaTrader 4 indicator for traders who use the Beat The Market Maker approach: Asian session context, kill zone timing, level progression, peak formation detection, and a multi-pair scanner from a single chart. It combines cycle state logic with a built-in scanner dashboard so you do not need the same tool on many charts at once. What it does Draws the Asian session range; session times can follow broker server offset or be set in inputs. Tracks level progression (L
" Dynamic Scalper System " göstergesi, trend dalgaları içinde işlem yapmak için scalping yöntemi için tasarlanmıştır. Başlıca döviz çiftleri ve altın üzerinde test edilmiştir, diğer işlem araçlarıyla uyumluluğu mümkündür. Ek fiyat hareketi desteğiyle trend boyunca pozisyonların kısa vadeli açılması için sinyaller sağlar. Göstergenin prensibi. Büyük oklar trend yönünü belirler. Küçük oklar şeklinde scalping için sinyaller üreten bir algoritma trend dalgaları içinde çalışır. Kırmızı oklar yüksel
Price & Time Market Structure Indicator A professional market structure tool that analyzes waves through both price and time — not price alone. Main Description NeoWave PRO is a professional market structure indicator for MetaTrader 4 designed for traders who want to move beyond traditional one-dimensional wave tools such as ZigZag, swing indicators, and basic high/low systems. Most wave indicators analyze only one thing: Price. But a real market wave is not only a price movement. A true wave de
Quant Direction
Georgios Kalomoiropoulos
Quant Direction, 3 boyutlu bir piyasa analiz aracıdır. Çeşitli parametrelerdeki yüzdesel sapmaları hassas bir şekilde hesaplayan, tamamen objektif, algoritma tabanlı piyasa analizi sunar. Gelişmiş yapay zeka tabanlı modelleme araçları kullanılarak geliştirilen ve titizlikle test edilen bu algoritma, piyasayı benzersiz bir hassasiyetle analiz eder. Platformda herhangi bir döviz çiftini veya finansal enstrümanı analiz edebilirsiniz. İster kısa vadeli, ister günlük, isterse swing trading yapın, Qua
MonsterDash Harmonic Indicator is a harmonic pattern dashboard. It recognizes all major patterns. MonsterDash is a dashboard that displays all detected patterns for all symbols and (almost) all timeframes in sortable and scrollable format. Users can add their own user defined patterns . MonsterDash can open and update charts with the pattern found. Settings MonsterDash's default settings are good enough most of the time. Feel free to fine tune them to your needs. The color settings are for thos
RFI levels PRO
Roman Podpora
5 (1)
Bu gösterge, fiyat dönüş noktalarını ve fiyat geri dönüş bölgelerini doğru bir şekilde gösterir.       Başlıca oyuncular   . Yeni trendlerin nerede oluştuğunu görüyorsunuz ve her işlem üzerinde kontrolü elinizde tutarak, azami hassasiyetle kararlar alıyorsunuz. TREND LINES PRO   göstergesiyle birlikte kullanıldığında maksimum potansiyelini ortaya koyar.  VERSION MT5 Göstergenin gösterdiği şey: Yeni bir trendin başlangıcında aktivasyonla birlikte tersine dönüş yapıları ve tersine dönüş seviyeler
Apollo SR Master , Destek/Direnç bölgelerinde alım satımı daha kolay ve güvenilir hale getiren özelliklere sahip bir Destek/Direnç göstergesidir. Gösterge, yerel fiyat zirvelerini ve diplerini tespit ederek Destek/Direnç bölgelerini herhangi bir gecikme olmadan gerçek zamanlı olarak hesaplar. Ardından, yeni oluşan Destek/Direnç bölgesini doğrulamak için, Destek/Direnç bölgesinin dikkate alınabileceğini ve gerçek bir SAT veya AL sinyali olarak kullanılabileceğini gösteren özel bir sinyal gösterir
ŞU ANDA %40INDIRIMLI Yeni Başlayanlar veya Uzman Tüccarlar için En İyi Çözüm! Bu Gösterge benzersiz, yüksek kaliteli ve uygun fiyatlı bir ticaret aracıdır çünkü bir dizi tescilli özellik ve yeni bir formül ekledik. Sadece BİR grafik ile 28 Forex çifti için Döviz Gücünü okuyabilirsiniz! Yeni bir trendin veya scalping fırsatının tam tetik noktasını belirleyebildiğiniz için ticaretinizin nasıl gelişeceğini hayal edin? Kullanım kılavuzu: buraya tıklayın Bu ilk olan, orijinal! Değersiz bir özent
Auto Optimized Parabolic RSI: Gelişmiş 3D Momentum Motoru Çoğu perakende indikatörü, piyasa volatilitesi değiştiği an çöken statik girdilere dayandığı için başarısız olur. Auto Optimized Parabolic RSI, kendi matematiksel avantajını sürekli olarak yeniden hesaplayarak "indikatör körelmesi" (indicator decay) sorununu çözer ve kurumsal düzeyde kantitatif adaptasyonu doğrudan MT5 terminalinize getirir. Temel Avantaj: Özel Bellek İçi (In-Memory) 3D Optimizasyon   Standart otomatik optimize ediciler,
Advanced Supply Demand
Bernhard Schweigert
4.91 (300)
Özel Ticaret –%40 İndirim Yeni Başlayanlar veya Uzman Yatırımcılar İçin En İyi Çözüm! Bu gösterge, bir dizi özel özellik ve yeni bir formül içerdiği için benzersiz, yüksek kaliteli ve uygun fiyatlı bir işlem aracıdır. Bu güncelleme ile çift zaman dilimi bölgeleri gösterebileceksiniz. Sadece daha yüksek bir zaman dilimini değil, hem grafik zaman dilimini hem de daha yüksek zaman dilimini gösterebileceksiniz: İÇ İÇE GEÇMİŞ BÖLGELER GÖSTERİYOR. Tüm Arz Talep yatırımcıları buna bayılacak. :) Önem
Market Makers
Mohamed Hassan
5 (4)
After purchase, contact me privately to receive 1 month of free testing with EA Forex Proton! This advanced MT4 trading robot automatically executes signals from any MT4 indicator, including Market Makers. The latest version also includes AI integration, allowing each trade signal to be analyzed using Artificial Intelligence. Live Signal with EA Forex Proton: Click here Market Makers is a powerful price action trading system designed to identify high-probability Buy and Sell opportunities based
Yazarın diğer ürünleri
EZT Trend
Tibor Rituper
4.75 (4)
EZT Trend göstergesi size trendi, geri çekilmeyi ve giriş fırsatlarını gösterecektir. İsteğe bağlı filtreleme ve her türlü uyarı mevcuttur. E-posta ve anlık bildirim uyarıları eklendi. Ayrıca bu göstergeyi temel alan ve yakında kullanıma sunulacak bir EA da geliştiriyoruz. İki renkli histogram ve bir çizgiden oluşan çok işlevli bir göstergedir. Bu, bir trendin yönünün ve gücünün görsel bir temsilidir; ayrıca çizgide veya histogramda birçok kez sapma bulacaksınız. Gösterge, otomatik parametre
The FREE version works on Demo account and only CADCHF and NZDCHF pairs. The indicator predict the future candles direction, by scanning past candle movement. Based on the principal: “ The history repeat itself”. Programmed according to Kendall Correlation. In the settings menu, different scanning options are available. When the indicator find a match, start painting future candles from the current candle to the right, also from the current candle to the left as well, showing you the candle pa
FREE
This is a free version of our Great tool with limited functions. The ChartChanger is a great utility tool to reduce the number of open charts on your terminal. There is three section to it: Symbols, Time frames and Templates. You need only one chart to be open and still you can scroll up to multiple ones. Symbols: With the push of a button you can change from one symbol to another, and your applied indicators will stay on the next chart. For the symbols there is an auto detection mode, or you ca
FREE
This indicator can display 1-6 RSI indicator on different timeframes and settings. The active indicators can give visual and sound alert on oversold/overbought level if the user choose that option. Alert can be set on one or all active indicator, even if the timeframe, the period and the oversold/overbought level different on each.There is a display panel with buttons on the main chart, what is show the active indicators and their settings.There is an option to hide this panel. With the buttons
This indicator can display 1-3 CCI indicator on different time frames and settings. The active indicators can give visual and sound alert on oversold/overbought level if the user choose that option. Alert can be set on one or all active indicator, even if the time frame, the period and the oversold/overbought level different on each. There is a display panel with buttons on the main chart, what is show the active indicators and their settings. There is an option to hide this panel. With the butt
This indicator can display 1 or 2 MACD indicator on different time-frames and settings. Uses EMA for calculation. The active indicators can give visual and sound alert on zero-level-cross if the user choose that option. Alert can be set on one or both active indicator, even if the time-frame, and the period different on each. When alert set to both, the two MACD histogram must be on the same size of the 0 level to get an arrow. There is a display panel with buttons on the main chart, what is sho
ChartChanger, terminalinizdeki açık haritaların sayısını azaltmak için harika bir yardımcı araçtır. Üç bölüm vardır: Semboller, Zaman Çerçeveleri ve Şablonlar. Açmak için yalnızca bir grafiğe ihtiyacınız var ve yine de birden fazla grafiğe doğru ilerleyebilirsiniz. Semboller: Bir düğmeye basarak bir sembolden diğerine geçiş yapabilirsiniz ve uygulanan göstergeleriniz bir sonraki grafikte kalacaktır. Semboller için bir otomatik algılama modu vardır veya istediğiniz sembolleri manuel olarak girebi
Bu, Çoklu Zaman Çerçevesi Raptiye çubuğu uyarı göstergesidir. Yalnızca geçerli zaman diliminde veya 1 dakikadan aya kadar tüm zaman dilimlerinde kullanabilirsiniz. Tüm zaman dilimlerini seçtiğinizde, grafiğinizin açık olduğu mevcut zaman dilimi ve yukarıdaki zaman dilimleri hakkında uyarı alırsınız. Seçilen her zaman dilimi için ayrı ayrı Açılır pencere, e-posta ve anında bildirim uyarıları vardır. Gösterge fiyat tablosuna bir ok yerleştirir. Boğa yönlü/Uzun Pin çubuk için fiyat çizgisinin a
Bu, Çoklu Zaman Dilimi yutan mum uyarı göstergesidir. Yalnızca geçerli zaman diliminde veya 1 dakikadan aya kadar tüm zaman dilimlerinde kullanabilirsiniz. Bu, yeniden boyanmayan bir MTF göstergesidir. Seçilen zaman dilimleri seçeneğini (Çoklu Zaman Çerçevesi modu) kullandığınızda, gerçek geçerli zaman dilimi ve üzerindeki sinyalleri görebilirsiniz. Seçilen her zaman dilimi için ayrı ayrı Açılır pencere, e-posta ve anında bildirim uyarıları vardır. Gösterge fiyat tablosuna bir nokta yerleşt
This is a great utility tool to see valuable information on your chart. The panel is free-floating, grab with your mouse and move around on the chart with ease. Also the panel is collapsible so you can save space, and you can see only the information you wish. There is three section to the panel, when is closed you can see the top section only. Here the list of information you can see on the panel, from the top to bottom: The first part of the panel: Price : The color is changing according to d
EZT Stochastic
Tibor Rituper
5 (2)
EZT_Stochastic   This is a Multi Timeframe stochastic indicator, with colored background. The colored background can be set to different colors based on the K and D line, (moving up, or down), and also about the position of the lines. In the oversold or overbought zones you can choose different colors.   Settings: You can choose the time-frame you want to see the stochastic. Set the regular parameters in a same way like in the original stochastic. Histogram style: The style. Histogram width: The
EZT_Ichimoku_MTF Multitimeframe Ichimoku indicator. Display up to 4 different Ichimoku on the chart. Every line of every ichimoku is customizable, you can turn off/on or choose different thickness or color. You can choose to see only the cloud in multiple ichimokus. Optional info panel to identify the different Ichimokus. Works the same way like the original Ichimoku indicator.
EZT Trade History This is a great tool to analyze past trades or follow current ongoing trades, especially when you using an EA to manage your transactions. You will see the exact candle where the trade was opened and closed. Collapsible floating panel on the chart, free to move anywhere with your mouse. When you using multiple EA’s with different magic numbers, you have 5 options to separate those trades, so you will know which EA opened specific transactions. You can set the day limits how fa
EZT Bollinger Trendline Indicator based on multiple settings of Bollinger Band. In the menu you can choose the similar settings than bollinger band indicator. Trend period and trend deviations. Also paint and arrow on chart when direction change. Three different kind of alert , such as pop up, e-mail and push notification. Try different settings on different timeframes. Please help my work and rate and comment my products!
The indicator predict the future candles direction, by scanning past candle movement. Based on the principal: “ The history repeat itself”. Programmed according to Kendall Correlation. In the settings menu, different scanning options are available. When the indicator find a match, start painting future candles from the current candle to the right, also from the current candle to the left as well, showing you the candle pattern what the actual signal is based on. The left side candle are optiona
Filtrele:
Larrydeelf
598
Larrydeelf 2024.03.07 17:07 
 

after watching the indicator perform this week I can say that this is a very good indicator it help me verify on my direction regarding price movement great job.

intan08
1388
intan08 2021.07.28 09:08 
 

Worth every penny.

Lasse Michael Holm
1604
Lasse Michael Holm 2020.05.20 01:44 
 

At last, a MACD indicator that works for me. Love the MTF capabilities and the possibilities for divergens on chart. Just grab this one 😃👍

Muhammet Simsek
923
Muhammet Simsek 2018.07.02 09:19 
 

Very good!

Değerlendirmeye yanıt