• Genel bakış
  • İncelemeler (3)
  • Yorumlar (1)

Turtle ATR Channel

5

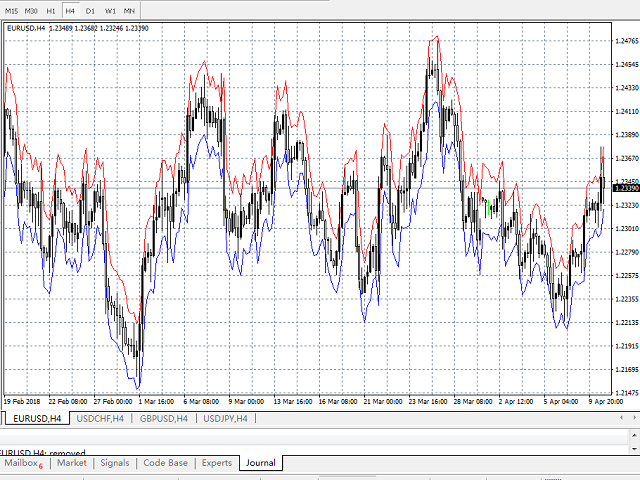
This indicator was modified according to the 'Way Of The Turtle'. It generates a channel based on the opening price and ATR values of the current bar. Turtle ATR Channel can be used to help identify overbought and oversold conditions in a market.


Calculation

upper channel = Open + r1*ATR

lower channel = Open - r2*ATR

Among them:

  • Open is the opening price of the current bar.
  • ATR is the ATR value of the current bar.
  • r1, r2 are the ATR ratios.
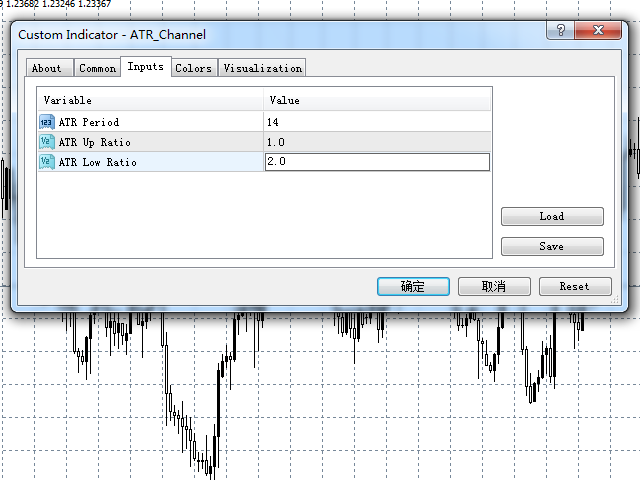

Input Parameters

  • ATR Period - set the period of the ATR indicator, default value is 14.
  • ATR Up Ratio - set the value of r1, default value is 1.0.
  • ATR Low Ratio - set the value of r2, default value is 1.0.


How to trade

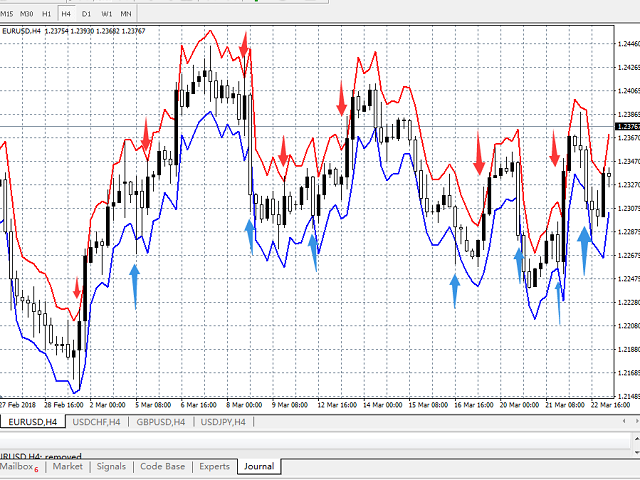
Basically Turtle ATR Channel can be used to help identify overbought and oversold conditions in a market. When a market’s price break through the upper channel, the market is considered overbought (selling area). Conversely, when a market’s price break through the lower channel, the market is considered oversold (buying area).

Note: When your opening position is lost out, stop trading at the same direction next time. For example, you opened a sell position when price broke through the upper channel and it was lost out. After that price broke through the upper channel again. At that moment you should not open a sell position and wait for the price to break through the lower channel.

It is applicable to all currencies and all timeframes.

Önerilen ürünler
Note: this product is a free limited version of the full featured product Currency Timeframe Strength Matrix . It only includes AUD, CAD, CHF currencies instead of all 8 currencies. It includes only 5S, 1M, 5M time frames instead of all 8 (5S, 1M, 5M, 15M, 30M, 1H, 4H, 1D). What is it? The Currency TimeFrame Strength Matrix is a simple and comprehensive Forex map that gives a snapshot of what is happening in the Forex market at the very present time. It illustrates the strength and momentum
FREE
The purpose of this new version of the MT4 standard indicator provided in your platform is to display in a sub-window multiple timeframes of the same indicator. See the example shown in the picture below. But the display isn’t like a simple MTF indicator. This is the real display of the indicator on its timeframe. Here's the options available in the FFx indicator: Select the timeframes to be displayed (M1 to Monthly) Define the width (number of bars) for each timeframe box Alert pop up/sound/ema
FREE
Purpose: The function of this indicator is to draw 3 moving averages (MA's) lines on the main MT4 price chart.   The MA's are from 3 different timeframes specified by the user independent of the chart that is currently displayed. When you toggle your chart view through different time frames, the 3 MA's will continue to display the MA lines for the time frames specified in the properties. Example: The default settings map out three 50 bars MA's for H4, D1 and W1 time frames. During intraday tradi
FREE
Extremum Reverse Bar
Yurij Izyumov
2.8 (5)
This indicator has been created for finding the probable reversal points of the symbol price. A small candlestick reversal pattern is used it its operation in conjunction with a filter of extremums. The indicator is not redrawn! If the extremum filter is disabled, the indicator shows all points that have a pattern. If the extremum filter is enabled, the condition works – if the history Previous bars 1 candles back contains higher candles and they are farther than the Previous bars 2 candle, such
FREE
FFx RVI
Eric Venturi-Bloxs
5 (1)
The purpose of this new version of the MT4 standard indicator provided in your platform is to display in a sub-window multiple timeframes of the same indicator. See the example shown in the picture below. But the display isn’t like a simple MTF indicator. This is the real display of the indicator on its timeframe. Here's the options available in the FFx indicator: Select the timeframes to be displayed (M1 to Monthly) Define the width (number of bars) for each timeframe box Alert pop up/sound/ema
FREE
The indicator detects and displays Shark harmonic pattern (see the screenshot). The pattern is plotted by the extreme values of the ZigZag indicator (included in the resources, no need to install). After detecting the pattern, the indicator notifies of that by a pop-up window, a mobile notification and an email. The indicator highlights the process of the pattern formation and not just the complete pattern. In the former case, it is displayed in the contour triangles. After the pattern is comple
TrendPlus
Sivakumar Subbaiya
4.08 (12)
Trend Plus   Trendplus  Indicator   Time Frame: Suitable for any time frame.  Purpose: Trend Prediction. Blue and red candle indicate the buy and sell call respectively. Buy: When the blue candle is formed buy call is initiated. close the buy trades when the next red candle will formed.   Sell: When the Red candle is formed Sell call is initiated. close the Sell trades when the next blue candle will formed.   Happy trade!!
FREE
FFx ADX
Eric Venturi-Bloxs
2.5 (2)
The purpose of this new version of the MT4 standard indicator provided in your platform is to display in a sub-window multiple timeframes of the same indicator. See the example shown in the picture below. But the display isn’t like a simple MTF indicator. This is the real display of the indicator on its timeframe. Here's the options available in the FFx indicator: Select the timeframes to be displayed (M1 to Monthly) Define the width (number of bars) for each timeframe box Alert pop up/sound/ema
FREE
Useful indicator that incorporates three moving averages, for your favorite trading strategy. Moving averages are fully configurable, Period, Method, Color, Etc Just place it on your favorite timeframe. The benefits you get : Never redesigns, does not retreat, never recalculates. Works on forex and CFD, timeframe from M1 to Monthly. Easy to use. Convenience for your trading. 
FREE
Useful indicator that incorporates two moving averages, for your favorite trading strategy. Moving averages are fully configurable, Period, Method, Color, Etc Just place it on your favorite timeframe. The benefits you get : Never redesigns, does not retreat, never recalculates. Works on forex and CFD, timeframe from M1 to Monthly. Easy to use. Convenience for your trading.
FREE
FFx Ichimoku
Eric Venturi-Bloxs
4.5 (4)
The purpose of this new version of the MT4 standard indicator provided in your platform is to display in a sub-window multiple timeframes of the same indicator. See the example shown in the picture below. But the display isn’t like a simple MTF indicator. This is the real display of the indicator on its timeframe. Here's the options available in the FFx indicator: Select the timeframes to be displayed (M1 to Monthly) Define the width (number of bars) for each timeframe box Alert pop up/sound/ema
FREE
This semaphore indicator is based in the standard RSI, which is applied over the Envelopes indicator that shows an envelope or envelope fluctuation borders. This is a version of RSI vs Envelopes drawn in the symbol window . A sell signal emerges when the upper envelope/border is broken by the RSI indicator from top to bottom. A buy signal emerges when the lower envelope/border is broken by the RSI indicator from bottom upwards. The indicator can draw arrows on the indicator, draw vertical lines
FREE
FFx Moving Average
Eric Venturi-Bloxs
4.75 (4)
The purpose of this new version of the MT4 standard indicator provided in your platform is to display in a sub-window multiple timeframes of the same indicator. See the example shown in the picture below. But the display isn’t like a simple MTF indicator. This is the real display of the indicator on its timeframe. Here's the options available in the FFx indicator: Select the timeframes to be displayed (M1 to Monthly) Define the width (number of bars) for each timeframe box Alert pop up/sound/ema
FREE
Moving Average Crossing Scanner
Teddy Mutugi Mworia Teddy Mutugi Mworia
4.33 (3)
This indicator scans the Moving Average values for 2 Moving Averages on multiple pairs and multiple timeframes in realtime and displays a Buy signal when the fast MA is above the slow MA and a Sell signal when the fast MA is below the slow MA.  -All the MA parameters(Period, Method and Applied price) can be changed from the inputs window. -You can either add your own list of pairs to scan or set the scanner to automatically use the pairs in the market watch using the Symbols Source input.
FREE
Spread Display Indicator
DMITRII GRIDASOV
4.86 (7)
This is Free product you are welcome to use for your needs! Also I very appreciate your positive feedbacks! Thanks a lot! // More great Expert Advisors and Indicators are available here:  https://www.mql5.com/en/users/def1380/seller Forex Indicator Spread Display for MT4 , Trading Support . Spread Display indicator shows current spread of forex pair where it is attached. It is possible to locate Spread display value in any corner of the chart: 0 - for top-left corner, 1 - top-right, 2 - bottom-
FREE
MTF Alligator
Alexander Pekhterev
4.71 (7)
This is an indicator detecting trend direction. It uses the popular Bill Williams Alligator. It shows market state on all timeframes on one chart. As is well known, traders gain the main profit on the Forex market trading by trend, and losses usually occur when the market is flat. So, in order to gain profit a trader should learn to detect trend market and direction of a current trend in a rapid manner. This indicator has been developed for this purpose. MTF Alligator helps to: Profitably trade
FREE
Wise Men Indicator demo
Bohdan Kasyanenko
3 (2)
The indicator displays signals according to the strategy of Bill Williams on the chart. Demo version of the indicator has the same features as the paid, except that it can work only on a demo account . Signal "First Wise Man" is formed when there is a divergent bar with angulation.  Bullish divergent bar - with lower minimum and closing price in the upper half. Bearish divergent bar - higher maximum and the closing price at the bottom half. Angulation is formed when all three lines of Alligat
FREE
The  Stochastic Basket Currency Strenght  brings the Stochastic indicator to a new level.  Expanding the boundaries of TimeFrames and mono-currency analysis, the SBCS take the movements of each currency that composes the cross and confront them in the whole basket of 7 crosses.  The indicator works with any combination of  AUD, CAD, CHF, EUR, GBP, JPY, NZD, USD  pairs and with full automation takes in account every stochastic value (main line) for the selected Time Frame.  After that, the indica
FREE
The Scaled Awesome Oscillator (SAO) represents a refined adaptation of the Awesome Oscillator, aimed at establishing consistent benchmarks for identifying market edges. Unlike the standard Awesome Oscillator, which records the variation in pips across different commodities, the only unchanging reference point is the zero line. This limitation hampers investors and traders from pinpointing specific levels for trend reversals or continuations using the traditional Awesome Indicator, a creation of
FREE
This indicator is a perfect tool able to compare which brokers have the lower latency. It shows us immediately which brokers are slower or faster. When you see the dot icon on the line, it means this broker is the faster one and the red line (Broker_A) is the slower one. See the example on the screenshot. How It Works? This indicator shares the prices information to and from the "shared" common data folder. It compares all the prices. The price is based on average by (Ask + Bid) / 2. There are
FREE
The ' Average OHLC ZigZag ' indicator was designed for entry confirmations as well as scalping with a larger trend. A custom formula to average the last two bars to generate arrows following market trends with bar 1 confirmation. Key Features An extreme scalper calculating the averages between the last two market periods to generate a buy or sell arrow. No settings are available due to it's simplicity of custom price action pattern and using repainting four OHLC prices.  Input Parameters Zig
FREE
MASi Impulse System
Aleksey Terentev
5 (1)
The implementation of the impulse system described by Dr. Alexander Elder. The indicator colors the bars according to the following pattern: Moving average and MACD histogram increase - green bar, it is forbidden to sell; Moving average and MACD histogram have different directions - blue bar, the ban is removed; Moving average and MACD histogram decrease - red bar, it is forbidden to buy. Indicator Parameters EMA - period of the indicator's moving average MACD Fast - period of the fast moving
FREE
MACalcAuto MT4
Tatiana Savkevych
As you know, the main invariable indicator of all traders is the moving average; it is used in some way in most strategies. It is also obvious that this indicator is capable of showing good entries in every local area. For which it usually needs to be optimized or just visually adjusted. This development is intended for automatic optimization of the indicator. Once placed on the chart, the indicator will automatically re-optimize itself with the specified period ( PeriodReOptimization ) and dis
Italo Trend Indicator
Italo Santana Gomes
4.75 (32)
BUY INDICATOR AND GET EA FOR FREE AS A BONUS + SOME OTHER GIFTS! ITALO TREND INDICATOR  is the best trend indicator on the market, the Indicator works on all time-frames and assets, indicator built after 7 years of experience on forex and many other markets. You know many trend indicators around the internet are not complete, does not help, and it's difficult to trade, but the Italo Trend Indicator is different , the Italo Trend Indicator shows the signal to buy or sell, to confirm the signal t
The Analytical cover trend indicator is a revolutionary trend trading and filtering solution with all the important features of a trend tool built into one tool! The Analytical cover indicator is good for any trader, suitable for any trader for both forex and binary options. You don’t need to configure anything, everything is perfected by time and experience, it works great during a flat and in a trend. The Analytical cover trend indicator is a tool for technical analysis of financial markets
SpectorMA
Sergii Krasnyi
5 (1)
Size sadece grafiğin görsel yönünü geliştirmekle kalmayan, aynı zamanda ona canlı, dinamik bir karakter kazandıran bir gösterge sunuyoruz. Göstergemiz, renklerini sürekli değiştirerek ilginç ve renkli bir görünüm yaratan bir veya daha fazla Hareketli Ortalama (MA) göstergesinin bir kombinasyonudur. Bu ürün grafiksel bir çözümdür, bu nedenle metinde ne yaptığını açıklamak zordur, indirerek görmek daha kolaydır, ayrıca ürün ücretsizdir. Bu gösterge, video düzenleme için güzel bir grafik resmi o
FREE
StrikePin
Mike Pascal Plavonil
1 (1)
The StrikePin indicator is a technical, analytical tool designed to identify trend reversals and find optimal market entries.  The StrikePin indicator is based on the pin bar pattern, which is the Price Action reversal pattern. An entry signal, in a trending market, can offer a very high-probability entry and a good risk to reward scenario. Be careful: the indicator is repainting since it is looking for highest high and lowest lows.  You should avoid to use it in experts but you can use it
FREE
Pulse Indicator
Igor Kryuchkov
3.83 (6)
This indicator is suitable for trading Forex and Binary Options, depending on its settings. The indicator is designed for trend trading. A buy signal: An up arrow appears on the chart. A sell signal: A down arrow appears on the chart. Input parameters === Setup CCI === Period CCI 1 - Period of the CCI Period CCI 2 - Period of the CCI Level BUY - Level of the CCI for buying Level SELL - Level of the CCI for selling === Setup RSI === Level SELL - Level of the RSI for selling Period SELL - Period
FREE
Free automatic Fibonacci is an indicator that automatically plots a Fibonacci retracement based on the number of bars you select on the BarsToScan setting in the indicator. The Fibonacci is automatically updated in real time as new highest and lowest values appears amongst the selected bars. You can select which level values to be displayed in the indicator settings. You can also select the color of the levels thus enabling the trader to be able to attach the indicator several times with differe
FREE
Delta AG Free
Yurij Kozhevnikov
5 (2)
The difference between the arithmetic and geometric means at the specified range. Since the greater is the difference between the values, the greater the resulting figure is, actually the indicator shows volatility fluctuations. The arithmetic mean of a certain number of values ​​is the sum of the values ​​divided by their number. The geometric mean is the root of the power of the number of values ​​extracted from the product of these values. If all values ​​are equal, the arithmetic mean and th
FREE
Bu ürünün alıcıları ayrıca şunları da satın alıyor
Gann Made Easy
Oleg Rodin
4.85 (82)
Gann Made Easy , bay teorisini kullanarak ticaretin en iyi ilkelerine dayanan, profesyonel ve kullanımı kolay bir Forex ticaret sistemidir. WD Gann. Gösterge, Zararı Durdur ve Kâr Al Seviyeleri dahil olmak üzere doğru SATIN AL ve SAT sinyalleri sağlar. PUSH bildirimlerini kullanarak hareket halindeyken bile işlem yapabilirsiniz. Lütfen satın aldıktan sonra benimle iletişime geçin! Alım satım ipuçlarımı ve harika bonus göstergelerini ücretsiz olarak sizinle paylaşacağım! Muhtemelen Gann ticaret y
TPSpro RFI Levels
Roman Podpora
4.82 (22)
TALİMATLAR         RUS   -        ENG       Bir gösterge ile kullanılması   önerilir       -       TPSpro   TREND PRO -   Sürüm MT4         Ticarette önemli bir unsur, bir ticaret aracını satın alma veya satma kararlarının alındığı bölgeler veya seviyelerdir. Büyük oyuncuların piyasadaki varlıklarını gizleme girişimlerine rağmen, kaçınılmaz olarak izler bırakırlar. Bizim görevimiz bu izleri nasıl tanımlayacağımızı ve doğru şekilde nasıl yorumlayacağımızı öğrenmekti. Ana işlevler:: Satıcılar ve
Gold Stuff
Vasiliy Strukov
4.89 (239)
Gold Stuff, özellikle altın için tasarlanmış bir trend göstergesidir ve herhangi bir finansal enstrümanda da kullanılabilir. Gösterge yeniden çizilmez ve gecikmez. Önerilen zaman dilimi H1. Bu göstergede tam otomatik Uzman Danışman EA Gold Stuff çalışır. Profilimde bulabilirsiniz. Ayarları ve kişisel bir bonusu almak için satın alma işleminden hemen sonra benimle iletişime geçin!  Güçlü Destek ve Trend Tarayıcı göstergemizin ücretsiz bir kopyasını pm'den alabilirsiniz. Ben! AYARLAR Ok Ç
Atomic Analyst
Issam Kassas
5 (2)
Öncelikle belirtmek gerekir ki bu Ticaret Göstergesi Yeniden Çizim Yapmaz, Gecikmez ve Gecikme Göstermez, bu da hem manuel hem de robot ticareti için ideal hale getirir. Kullanıcı kılavuzu: ayarlar, girişler ve strateji. Atom Analisti, Piyasada Daha İyi Bir Avantaj Bulmak İçin Fiyatın Gücünü ve Momentumunu Kullanan PA Fiyat Hareketi Göstergesidir. Gürültüleri ve Yanlış Sinyalleri Kaldırmaya ve Ticaret Potansiyelini Artırmaya Yardımcı Olan Gelişmiş Filtrelerle Donatılmıştır. Birden fazla katma
Trend Punch
Mohamed Hassan
4.95 (19)
This indicator is unstoppable when combined with our other indicator called  Support & Resistance . After purchase, send us a message and you will get it   for  FREE as a BONUS! Introducing Trend Punch , the revolutionary forex trend indicator that will transform the way you trade! Trend Punch is uniquely designed to provide precise buy and sell arrows during strong market trends, making your trading decisions clearer and more confident. Whether you're trading major currency pairs or exotic sym
TPSproTREND PrO
Roman Podpora
4.79 (19)
TPSpro TREND PRO,   piyasayı otomatik olarak analiz eden, trend ve değişimlerinin her biri hakkında bilgi sağlayan, ayrıca yeniden çizmeden işlemlere girme sinyalleri veren bir trend göstergesidir! Gösterge her mumu ayrı ayrı analiz ederek kullanır. farklı dürtülere atıfta bulunur - yukarı veya aşağı dürtü. Para birimleri, kripto paralar, metaller, hisse senetleri ve endeksler için işlemlere tam giriş noktaları! Sürüm MT5                   GÖSTERGENİN TAM AÇIKLAMASI       Bunu -   RFI SEVİYELER
Trend Screener
STE S.S.COMPANY
4.8 (87)
Trend Göstergesi, Trend Alım Satım ve Filtreleme için Çığır Açan Benzersiz Çözüm, Tüm Önemli Trend Özellikleriyle Tek Bir Araç İçinde Yerleştirildi! Forex, emtialar, kripto para birimleri, endeksler ve hisse senetleri gibi tüm sembollerde/araçlarda kullanılabilen %100 yeniden boyamayan çoklu zaman çerçevesi ve Çoklu para birimi göstergesidir. SINIRLI SÜRELİ TEKLİF: Destek ve Direnç Tarama Göstergesi sadece 50$ ve ömür boyu mevcuttur. (Orijinal fiyat 250$) (teklif uzatıldı) Trend Screener, grafik
FX Power MT4 NG
Daniel Stein
5 (12)
Sabah Brifingimiz burada mql5 ve on Telegram! FX Power MT4 NG , uzun zamandır çok popüler olan döviz gücü ölçerimiz FX Power'ın yeni neslidir. Peki bu yeni nesil güç ölçer ne sunuyor? Orijinal FX Power hakkında sevdiğiniz her şey PLUS GOLD/XAU güç analizi Daha da hassas hesaplama sonuçları Ayrı ayrı yapılandırılabilir analiz dönemleri Daha da iyi performans için özelleştirilebilir hesaplama limiti Özel çokluDaha fazlasını görmek isteyenler için örnek ayarlar Her grafikte en sevdiğiniz renkler i
FX Volume
Daniel Stein
4.58 (33)
Sabah Brifingimiz aracılığıyla ayrıntılar ve ekran görüntüleri ile günlük piyasa güncellemenizi alın burada mql5 ve on Telegram ! FX Volume, bir brokerin bakış açısından piyasa duyarlılığı hakkında GERÇEK bir fikir veren İLK ve TEK hacim göstergesidir. COT raporlarından çok daha hızlı bir şekilde, brokerlar gibi kurumsal piyasa katılımcılarının Forex piyasasında nasıl konumlandıklarına dair harika bilgiler sağlar. Bu bilgileri doğrudan grafiğinizde görmek, ticaretiniz için gerçek oyun değiştir
Scalper Inside PRO
Alexey Minkov
4.73 (56)
An exclusive indicator that utilizes an innovative algorithm to swiftly and accurately determine the market trend. The indicator automatically calculates opening, closing, and profit levels, providing detailed trading statistics. With these features, you can choose the most appropriate trading instrument for the current market conditions. Additionally, you can easily integrate your own arrow indicators into Scalper Inside Pro to quickly evaluate their statistics and profitability. Scalper Inside
- Real price is 80$ - 40% Discount ( It is 49$ now ) Contact me for instruction, add group and any questions! Related EA Product: Bitcoin Expert Introduction The breakout and retest strategy is traded support and resistance levels. it involves price breaking through a previous level.  The break and retest strategy is designed to help traders do two main things, the first is to avoid false breakouts. Many false breakouts start with a candlestick that breaks out of a level but ends with an immedi
Enigmera
Ivan Stefanov
5 (3)
ENIGMERA: Pazarın çekirdeği https://www.enigmera.com Giriş Bu gösterge ve ticaret sistemi, finansal piyasalar için dikkate değer bir yaklaşımdır. ENIGMERA, destek ve direnç seviyelerini doğru bir şekilde hesaplamak için fraktal döngüleri kullanır. Gerçek birikim aşamasını gösterir ve yön ve hedefler verir.  İster bir trendde ister bir düzeltmede olalım çalışan bir sistem.  Nasıl çalışır? ENIGMERA üç çizgiden oluşur: destek/direnç çizgisi, hedef çizgisi ve sapma çizgisi. Sistem, geçmiş veril
Chart Patterns All-in-One göstergesi, traderların teknik analizde yaygın olarak kullanılan çeşitli grafik desenlerini görselleştirmelerine yardımcı olur. Bu gösterge, potansiyel piyasa hareketlerini belirlemeye yardımcı olur ancak kârlılığı garanti etmez. Satın almadan önce göstergeyi demo modunda test etmeniz önerilir. Mevcut Teklif : "Chart Patterns All in One" göstergesinde %50 indirim. Dahil Edilen Desenler : 1-2-3 Deseni : Üç önemli nokta (yüksekler veya düşükler) kullanarak piyasa tersine
MetaBands M4
Vahidreza Heidar Gholami
5 (2)
MetaBands uses powerful and unique algorithms to draw channels and detect trends so that it can provide traders with potential points for entering and exiting trades. It’s a channel indicator plus a powerful trend indicator. It includes different types of channels which can be merged to create new channels simply by using the input parameters. MetaBands uses all types of alerts to notify users about market events. Features Supports most of the channel algorithms Powerful trend detection algorith
Fiyat tersine döndükçe ve geri çekildikçe piyasa yapısından elde edilen kâr değişir. Piyasa yapısını tersine çevirme uyarısı göstergesi, bir trendin veya fiyat hareketinin ne zaman tükenmeye yaklaştığını ve tersine dönmeye hazır olduğunu tanımlar. Genellikle bir geri dönüş veya büyük bir geri çekilme meydana gelmek üzereyken meydana gelen piyasa yapısındaki değişiklikler konusunda sizi uyarır. Gösterge, olası bir tükenme noktasının yakınında her yeni yüksek veya düşük oluştuğunda, başlangıçta
Şu anda %20 İNDİRİMLİ! Herhangi bir Acemi veya Uzman Tüccar için En İyi Çözüm! Bu gösterge paneli yazılımı 28 döviz çifti üzerinde çalışıyor. Ana göstergelerimizden 2'sine (Gelişmiş Para Birimi Gücü 28 ve Gelişmiş Para Birimi Dürtüsü) dayanmaktadır. Tüm Forex piyasasına harika bir genel bakış sağlar. Gelişmiş Para Birimi Gücü değerlerini, para birimi hareket hızını ve tüm (9) zaman dilimlerinde 28 Forex çifti için sinyalleri gösterir. Trendleri ve / veya scalping fırsatlarını belirlemek içi
Bomb Bank Signal
Igor Pereira Calil
5 (1)
Bomb Bank Signal: Your Trusted Indicator for MetaTrader 4 The Bomb Bank Signal is a powerful indicator for MetaTrader 4, designed to identify the most relevant trends in the financial market. If you are looking for a tool that accurately anticipates movements, Bomb Bank is the ally you need. How it Works: This indicator combines three distinct methods – volume analysis, candle closes and symmetrical trend – to detect and signal buying and selling opportunities. Bomb Bank is like a "bomb"
Trend Cutter
Oleg Rodin
5 (2)
Trend Cutter, M1 ve M5 gibi daha düşük zaman dilimleri de dahil olmak üzere herhangi bir zaman diliminde kullanılabilen bir trend göstergesidir. Gösterge, gün içi ticareti tercih eden yatırımcılar için idealdir ve uzun vadeli ticareti tercih edenlere de yardımcı olacaktır. Bu göstergeyi ticaret sisteminiz için bir temel olarak veya bağımsız bir ticaret çözümü olarak kullanabilirsiniz. Gösterge, PUSH bildirimleri de dahil olmak üzere her türlü uyarıyı sağlar. Göstergenin kullanımı çok kolaydır. S
Currency Strength Wizard , başarılı ticaret için size hepsi bir arada çözüm sağlayan çok güçlü bir göstergedir. Gösterge, birden çok zaman dilimindeki tüm para birimlerinin verilerini kullanarak şu veya bu forex çiftinin gücünü hesaplar. Bu veriler, şu veya bu para biriminin gücünü görmek için kullanabileceğiniz, kullanımı kolay para birimi endeksi ve para birimi güç hatları biçiminde temsil edilir. İhtiyacınız olan tek şey, işlem yapmak istediğiniz tabloya göstergeyi eklemektir ve gösterge size
TakePropips Donchian Trend Pro
Eric John Pajarillaga Aldana
4.44 (16)
TakePropips Donchian Trend Pro   (MT4), Donchian Kanalı'nı kullanarak trendin yönünü otomatik olarak tespit eden ve size ticarete giriş ve çıkış sinyalleri sağlayan güçlü ve etkili bir araçtır! Bu çok işlevli gösterge, bir trend tarayıcı, ticaret sinyalleri, istatistiksel panel, tarayıcı, ticaret oturumları ve uyarı geçmişi panosu içerir. Size ticaret sinyalleri sağlamak ve çizelgeleri analiz ederek saatlerce tasarruf etmenizi sağlamak için tasarlanmıştır! Kullanım kılavuzunu ve kurulum kılavuzu
Supply and Demand Dashboard PRO
Bernhard Schweigert
4.8 (20)
Şu anda %20 İNDİRİMLİ! Bu gösterge paneli, birden fazla sembol ve 9 zaman dilimine kadar çalışan çok güçlü bir yazılım parçasıdır. Ana göstergemize dayanmaktadır (En iyi yorumlar: Advanced Supply Demand ).     Gösterge paneli harika bir genel bakış sağlar. Gösterir:    Bölge mukavemet derecesi dahil filtrelenmiş Arz ve Talep değerleri, Bölgelere/ve bölgeler içindeki pip mesafeleri, İç içe geçmiş bölgeleri vurgular, Tüm (9) zaman dilimlerinde seçilen semboller için 4 çeşit uyarı verir. Kişis
ŞU ANDA %26 INDIRIMLI Yeni Başlayanlar veya Uzman Tüccarlar için En İyi Çözüm! Bu Gösterge benzersiz, yüksek kaliteli ve uygun fiyatlı bir ticaret aracıdır çünkü bir dizi tescilli özellik ve yeni bir formül ekledik. Sadece BİR grafik ile 28 Forex çifti için Döviz Gücünü okuyabilirsiniz! Yeni bir trendin veya scalping fırsatının tam tetik noktasını belirleyebildiğiniz için ticaretinizin nasıl gelişeceğini hayal edin? Kullanım kılavuzu: buraya tıklayın Bu ilk olan, orijinal! Değersiz bir
ŞU ANDA %31 INDIRIMLI !!! Yeni Başlayanlar veya Uzman Tüccarlar için En İyi Çözüm! Bu gösterge benzersiz, yüksek kaliteli ve uygun fiyatlı bir ticaret aracıdır çünkü bir dizi tescilli özellik ve gizli bir formül ekledik. Yalnızca BİR grafikle 28 döviz çiftinin tümü için Uyarılar verir. Yeni bir trendin veya scalping fırsatının tam tetik noktasını belirleyebildiğiniz için ticaretinizin nasıl gelişeceğini hayal edin! Yeni temel algoritmalar üzerine inşa edilen bu sistem, potansiyel işlemler
IX Power MT4
Daniel Stein
5 (5)
IX Power nihayet FX Power'ın rakipsiz hassasiyetini Forex dışı sembollere getiriyor. En sevdiğiniz endeksler, hisse senetleri, emtialar, ETF'ler ve hatta kripto para birimlerindeki kısa, orta ve uzun vadeli eğilimlerin yoğunluğunu doğru bir şekilde belirler. Terminalinizin sunduğu her şeyi analiz edebilirsiniz. Deneyin ve işlem yaparken zamanlamanızın nasıl önemli ölçüde iyileştiğini deneyimleyin. IX Power Temel Özellikler 100 hassas, yeniden boyanmayan hesaplama sonuçları - terminalini
Stratos Pali Indicator   is a revolutionary tool designed to enhance your trading strategy by accurately identifying market trends. This sophisticated indicator uses a unique algorithm to generate a complete histogram, which records when the trend is Long or Short. When a trend reversal occurs, an arrow appears, indicating the new direction of the trend. Important Information Revealed Leave a review and contact me via mql5 message to receive My Top 5 set files for Stratos Pali at no cost! D
Grafiğinizde otomatik olarak destek ve direnç seviyeleri PLUS itici mum boşlukları çizin, böylece fiyatın nereye gidebileceğini ve / veya potansiyel olarak tersine dönebileceğini görebilirsiniz. Bu gösterge, web sitemde (The Market Structure Trader) öğretilen pozisyon ticareti metodolojisinin bir parçası olarak kullanılmak üzere tasarlanmıştır ve hedefleme ve potansiyel girişler için temel bilgileri görüntüler. Göstergede 2 TEMEL özellik ve 4 ek özellik bulunmaktadır: TEMEL ÖZELLİK 1 - Günl
Bu gösterge panosu, piyasa yapısını tersine çevirme göstergesiyle kullanım için bir uyarı aracıdır. Birincil amacı, belirli zaman dilimlerinde geri dönüş fırsatları ve ayrıca göstergenin yaptığı gibi uyarıların yeniden test edilmesi (onay) konusunda sizi uyarmaktır. Pano, kendi başına bir grafik üzerinde oturacak ve seçtiğiniz çiftler ve zaman dilimlerinde size uyarılar göndermek için arka planda çalışacak şekilde tasarlanmıştır. Piyasa tersine çevrilme göstergesinin tek bir MT4'te birden fazla
Gold Channel is a volatility-based indicator, developed with a specific timing algorithm for the XAUUSD pair, which consists of finding possible corrections in the market. This indicator shows two outer lines, an inner line (retracement line) and an arrow sign, where the theory of the channel is to help identify overbought and oversold conditions in the market. The market price will generally fall between the boundaries of the channel. If prices touch or move outside the channel it is a tra
PRO Renko Sistemi, RENKO grafikleri ticareti için özel olarak tasarlanmış son derece hassas bir ticaret sistemidir. Bu, çeşitli ticaret araçlarına uygulanabilen evrensel bir sistemdir. Sistemi etkin piyasa sana doğru ters sinyallerine erişim hakkı denilen ses nötralize eder. Göstergenin kullanımı çok kolaydır ve sinyal üretiminden sorumlu tek bir parametreye sahiptir. Aracı, seçtiğiniz herhangi bir ticaret aracına ve renko çubuğunun boyutuna kolayca uyarlayabilirsiniz. Yazılımımla karlı b
Öncelikle, bu Ticaret Aracının Non-Repainting, Non-Redrawing ve Non-Lagging Gösterge olduğunu vurgulamakta fayda var, bu da onu profesyonel ticaret için ideal hale getiriyor. Çevrimiçi kurs, kullanıcı kılavuzu ve demo. Akıllı Fiyat Hareketi Kavramları Göstergesi, hem yeni hem de deneyimli tüccarlar için çok güçlü bir araçtır. İleri ticaret fikirlerini, Inner Circle Trader Analizi ve Smart Money Concepts Ticaret Stratejileri gibi 20'den fazla kullanışlı göstergeyi bir araya getirerek bir araya g
Yazarın diğer ürünleri
This indicator was modified according to the 'Way Of The Turtle'. The ATR indicator can be used as a reference to set stop-loss or take-profit, and also can be used to confirm the daily price range (also applicable to other cycles). Calculation The true range value is calculated as follows: TR = MAX(H-L, H-PDC, PDC-L) Among them: H = Highest price of the current bar L = Lowest price of the current bar PDC = Close price of the previous bar The average true range in 'Way Of The Turtle' is calcul
FREE
The trade cost caused by spreads is an important indicator when formulating trade profit-loss ratios. Spread costs info is particularly important for short-term traders, especially scalping traders. This tool can output the spread cost of all Forex currencies (including XAU and XAG) in the platform in different account types (USD account, EUR account, etc.). Calculation and code See articles: THE TRADE COST OF FOREX CURRENCY Part1 THE TRADE COST OF FOREX CURRENCY Part2 THE TRADE COST OF FOREX
FREE
Spread Costs refers to the amount of the loss caused by the spread, and Swap Benefits refers to the amount of the income gained by overnight positions. Spread Costs is an important indicator for short-term traders, especially for scalping traders, and Swap Benefits is an important indicator for long-term traders. Since the spreads and swaps on the MetaTrader 4 platform are all expressed in points, we need to convert it into the amount expressed in the account currency. This tool can display the
Risk Control Trade Panel  is designed to assist in one-click trading. This tool can automatically calculate the trading lots based on the set risk money, the recommended StopLoss and the recommended TakeProfit. In the information menu, you can view indicators such as the weekly price range and the monthly price range. Followings are highlight features Lotsize is automatically calculated based on the risk money set by the user. The recommended stoploss and recommended takeprofit are automatical
Spread Costs refers to the amount of the loss caused by the spread, and Swap Benefits refers to the amount of the income gained by overnight positions. Spread Costs is an important indicator for short-term traders, especially for scalping traders, and Swap Benefits is an important indicator for long-term traders. Since the spreads and swaps on the MetaTrader 5 platform are all expressed in points, we need to convert it into the amount expressed in the account currency. This tool can display the
Filtrele:
sunnychow
8902
sunnychow 2018.12.16 04:52 
 

Kullanıcı incelemeye herhangi bir yorum bırakmadı

Aleksandr Tamonin
4107
Aleksandr Tamonin 2018.05.28 20:19 
 

Kullanıcı incelemeye herhangi bir yorum bırakmadı

Konstantin Grebenshikov
1774
Konstantin Grebenshikov 2018.04.30 10:44 
 

Kullanıcı incelemeye herhangi bir yorum bırakmadı

İncelemeye yanıt