KT Alpha Hunter Arrows Scanner MT4

KT Alpha Hunter Arrows Scanner shows every fresh KT Alpha Hunter Arrows signal across all your symbols and timeframes in one table, so you reach the trade while you can still enter it.

A new arrow can appear on any chart while you are watching another one. This scanner indicator watches the whole list for you. It tells you which chart has a new signal, how far that trade has gone and what its profit is right now.

What you get

  • No signal goes unseen: every symbol of your Market Watch, from the 1 minute chart to the daily chart, is checked for you on one chart.
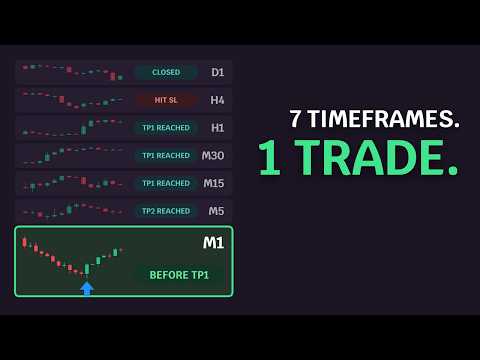
  • Enter on time: the status "Before TP1" marks a signal you can still take. The table also shows when a trade has passed its targets, hit its stop loss or was closed by the opposite signal.
  • The same ratings as on your chart: each row carries the buy and sell rating that KT Alpha Hunter Arrows gives that chart after Auto Optimize.
  • Live profit of every trade: in pips for forex and in points for gold, indices and shares.
  • One click to the ready chart: the Open button brings up the chart with KT Alpha Hunter Arrows already optimized, with the entry, the stop loss and TP1 to TP4 drawn.
  • Alerts once per signal: by popup with sound, push notification or email.


How to use it

Attach the scanner to one chart and leave it running. The table fills on the first run and is ready in about a minute after each restart. Start with the "Can enter now" card at the top, sort or search the table to find your symbol, then press Open on the row you want to trade.

The table works on its own. The Open button needs KT Alpha Hunter Arrows installed.

Recommendations

Use it on the markets you trade with KT Alpha Hunter Arrows: forex pairs, gold, indices and shares. Give the scanner a chart of its own so the table has room, and start it a few minutes before your session so the price history of every symbol is loaded. A signal is final when its candle closes.

Input parameters

  • Symbols: your own comma separated list; empty scans Market Watch.
  • Most symbols scanned: how many symbols the table holds.
  • Scan M1 to Scan MN1: the timeframes in the table.
  • Run Auto Optimize again after (days): how often each chart is optimized again.
  • Show No-Edge Signals as Exit Marks: keep it the same as in KT Alpha Hunter Arrows.
  • Show rows rated: all rows, or only the rows with a chosen rating or better.
  • Fresh signal: candles old or newer and Show only rows with a fresh signal: how new a signal must be to count as fresh, and a filter for fresh rows.
  • Rows per page and Panel corner: the size and place of the table.
  • Alerts: new signals, M1 and M5 alerts, exit alerts, popup with sound, push notification and email.


One table in place of a hundred charts

You see where the fresh signal is, you know if you can still enter, and you reach the chart in one click. Your time goes to the trades.
Önerilen ürünler
30 Indicator Comment Center — Your Full Trading Desk on One Chart (MT4 Edition) 30 Indicator Comment Center turns your MetaTrader 4 chart into a complete confluence-trading workstation. Instead of stacking a dozen separate indicators and guessing how they agree, this tool runs 30 professional-grade technical engines simultaneously , blends them into a single live verdict, and presents everything through a clean, modern six-page interface — built right on your chart. No more switching windows. No
Hit Rate Top Bottom Signal Hit Rate Top Bottom Signal Hit Rate Top Bottom Signal tamamen yenilikçi bir yaklaşım sunar. Belirli bir TP-SL ve hangi ÇİFTLER/TF'lerde en iyi performansı gösterdiğini önceden değerlendirmek isteyenler için idealdir. Hit Rate Top Bottom Signal stratejisi, her trader ve her tür ticaret için temel bir araçtır çünkü yalnızca yeniden çizim yapmayan kesin sinyaller sağlamakla kalmaz, aynı zamanda her Parite ve TF için başarı oranının ayrıntılı bir kaydını tutar ve önceden t
'Zoro LITE' is a reversal strategy based MT4 indicator with advance pre-alert system. Its an 100% non repaint indicator with an average accuracy of about 70-95% in a ranging market. --------------------------------------------------------- Features: Neural Network based Advance price action algorithms Pre-alert (get ready) signals Non-delay indications 24/7 signals OTC markets supported Auto-trading supported 100% Non repaint 100% No lag No recalculating Lifetime license -----------------------
Complete SMC/ICT Indicator MT5 — Smart Money Concepts Aracı    Complete SMC/ICT Indicator, doğrudan grafik penceresinde çalışan bağımsız bir Smart Money Concepts analiz aracıdır. Piyasa yapıları, dengesizlikler ve likidite bölgelerinin kurumsal seviyede tespitini sağlar; tam özelleştirme ve uyarı özellikleriyle birlikte gelir.   Özellikler   İndikatör on temel SMC öğesini algılar: swing zirve ve dipleri, fair value gaps (FVG), order blocks (OB), yapı kırılmaları (BOS), karakter değişimleri (CHo
[ MT5 Version ]  [ Kill Zones ]  [ SMT Divergences ] Order Blocks ICT Multi TF - FVG-Confirmed Order Blocks for MT5 Most ICT order block indicators for MT5 turn every opposite candle into an order block. The chart fills up and the label stops meaning anything. Order Blocks ICT Multi TF uses Fair Value Gap confirmation and monitors up to four timeframes from one chart. It is built for traders who want a defined reason for the block, not another coloured rectangle. GIVE THE BLOCK A REASON TO MATTE
Title: Smart Quant Enhanced Indicator (Adaptive Nonlinear Filtering & Ensemble Learning Framework) — Technical Features & Algorithmic Logic Description Overview This indicator integrates adaptive nonlinear time series analysis with Ensemble Learning algorithms to statistically model the deeper microstructure of price movements. It presents multidimensional data views via dynamic vector arrows and volatility channel bands on the chart, incorporating a built-in Kalman Filter for real-time noise re
Ortalama Yönsel Göstergesi(ADX) Çoklu Para Birimi Tarayıcı MT4 birden fazla döviz çiftini aynı anda analiz etmek için tasarlanmış gelişmiş bir ticaret göstergesidir. Bu gösterge, Ortalama Yönsel Göstergesi'ne dayalı gerçek zamanlı sinyaller sağlayarak, karar verme süreçlerini geliştirmek isteyen tüccarlara fayda sağlar ve etkili piyasa trend analizi yapmalarına olanak tanır. Bu araç, trend gücünü ve yön hareketini tanımlamayı basitleştirerek ticaret deneyimini kolaylaştırır ve ADX tabanlı strate
Chart Patterns Detect 15 patterns (Ascending Triangle, Descending Triangle, Rising Wedge, Falling Wedge, Bullish Flag, Bearish Flag, Bullish Rectangle, Bearish Rectangle Symmetrical triangle, Head and Shoulders, Inverted Head and Shoulders, Triple top, Triple Bottom, Double Top, Double Bottom) Use historical data to calculate the probability of each pattern to succeed (possibility to filter notification according to the chance of success) gives graphic indication about the invalidation level and
Hull Suite by InSilico MT4'ı tanıtıyoruz, teknik analizinizi geliştirmek için tasarlanmış sofistike bir ticaret göstergesi, pürüzsüz, düşük gecikmeli trend görselleştirmesi sunar. Bu araç, forex, endeksler, emtialar ve kripto paralar dahil olmak üzere çeşitli piyasalarda ticaret stratejilerinde hassasiyet arayan traderlar için idealdir. Hull Suite by InSilico MT4 ile traderlar, trend netliğinin artması ve daha hızlı karar verme gibi önemli avantajlar yaşayabilirler. İster acemi ister deneyimli b
NQX Session Range Breakout MT4, MetaTrader 4 için bir sinyal göstergesidir: Avrupa açılışında gece aralığının kırılımı. Sakin gece aralığını belirleyen ve Avrupa penceresinde bu aralığın dışındaki ilk kararlı kapanışta sinyal veren özel NQX mantığı. Önerilen girişi, kısa bir stopu ve uzak hedefleri (3:1, 5:1, 10:1) çizer; kararı siz verirsiniz. Grafikte neler çizer - Kapanmış sinyal mumunun üzerinde bir ok (kapanmış bir sinyali asla yeniden çizmez). - Önerilen giriş, kısa bir stop ve uzak bir ön
Single-Symbol Turtle Strategy (Medium-to-Long Term Version 1.00) Recommended Timeframe: H4 Recommended Instruments: GBPUSD | GBPJPY | USDJPY | XAUUSD | XTIUSD | CADJPY | GBPCAD | USTEC | BTCUSD | HK50 | DE40 | JP225 Strategy Overview Entry: Breakout of the long-period Donchian Channel (default: 55 periods). Position Sizing: Percentage-based stop loss to determine position size (default: 1% risk per trade). Exit: Reverse breakout of the short-period Donchian Channel (default: 10 periods). I
Divergence Matrix Pro for MetaTrader 4 Divergence Matrix Pro is a confirmed multi-oscillator divergence indicator for MetaTrader 4. It detects regular and hidden divergence between price and selected oscillators, then presents the confirmed structure through divergence lines, pivot labels, action markers, an optional current-timeframe Matrix Panel and optional alerts. The indicator is an analysis and confirmation tool. It does not open or close trades, and the signal score is not a win rate or a
Advanced Trend Regime
Shellard Securities (Pty) Ltd
The indicator has been designed to function on any time-frame and any pair.   This regime filter will help the trader better evaluate whether the current market is trending, and in which direction. It quickly reacts to changes in market dynamics using a series of advanced calculations. The user is able to select whether the calculation remains standard, or if a further filter constraint is added to the calculation.   A Yellow moving average of the signal has been included for the trader to smoot
SuperTrend Sentinel Levels, MetaTrader 4 için geliştirilmiş, klasik SuperTrend trend takip motorunu yüksek kaliteli sinyal seçimi için beş kapılı bir uyum (confluence) filtresiyle birleştiren yeniden boyamayan (non‑repainting) bir SuperTrend göstergesidir . Her trend dönüşünde, grafiğe bir alış veya satış oku ile birlikte tam bir risk mimarisi — Giriş seviyesi, Zarar Durdur (Sabit veya Takip Eden), TP1, TP2 ve TP3 — çizilir ve 18 satırlık kapsamlı bir gösterge paneli, mevcut kurulumu değerlendir
UTBot with HTS filter
Bartlomiej Tadeusz Tomaja
Advanced UT Bot & HTS Indicator This indicator is an advanced technical analysis tool that combines two methods: UT Bot and HTS (Higher Timeframe Smoothing) , to generate accurate buy and sell signals. 1. Indicator Structure Works within the main chart window and utilizes 11 buffers to store various data points, including arrows (buy/sell signals) and bands from both UT Bot and HTS systems. Uses colored arrows to represent different trading conditions: Blue arrows : Normal buy signals. Red arro
Visual Vortex Indicator MT4
AL MOOSAWI ABDULLAH JAFFER BAQER
Unleash the Power of Market Dynamics with the Vortex Indicator! The Visual Vortex Indicator is your advanced tool for decoding market trends, reversals, and momentum shifts. Priced at $65, this indicator provides a comprehensive view of market behavior, but it’s designed for you to fine-tune and optimize it according to your unique trading strategy. What Makes It Unique? The Vortex Indicator is based on a strategy that identifies directional movements and trend strength by analyzing key price d
Glod888EA
Dong Liang Zheng
Our team has been professionally developing gold trading EAs for three years. Every engineer is a real-account forex and gold trader with years of experience. This integrates multiple technologies, including trend following, Martingale, grid, and AI. Currently, we are using it for our own live trading and encourage everyone to download and test it. If wish to observe our trading, please feel free to contact us. Thank you all, and we wish you great success and massive profits
KT Renko Patterns Robot MT4
KEENBASE SOFTWARE SOLUTIONS
Seçilen formasyonları aktif Renko grafiğinde işleme alın KT Renko Patterns Robot MT4, dahili formasyon motoru oluşturulmuş bir Renko grafiğinde seçilen yapıyı tespit ettiğinde işlemleri açan ve yöneten bir Uzman Danışmandır. KT Renko Chart Generator gibi canlı EA işlemlerini destekleyen uyumlu bir oluşturucu kullanın ve robotu oluşturulan grafiğe ekleyin. EA'nın çalışması için bu grafiğin Properties bölümünde Offline Chart seçimini kaldırın. Tespit mantığı EA'nın içinde bulunduğundan ayrı KT Ren
Nomen Magic Candle
Noomen Ben Khadimallah Khadimallah
Nomen Magic Candle – Put an End to Chart Chaos! No Repaint MT4 Indicator The wait is finally over. It is time for a revolution on your screen. Welcome to the "Magic Chart." Use the cleanly plotted lines as a high-precision trading strategy, backed by advanced, algorithmic market analysis that precisely decodes hidden liquidity zones—giving you the decisive, invisible edge over the crowd. Do you also feel overwhelmed? By endless analysis, overloaded charts, and indicators that constantly contr
Smoothed Heiken Ashi with AC/AO Zones – Professional Trading Clarity Transform your Heiken Ashi analysis with intelligent smoothing that eliminates noise while preserving actionable signals. What Makes This Different? This isn't just another Heiken Ashi indicator. We've engineered a sophisticated smoothing engine that works with the Accelerator (AC) and Awesome Oscillator (AO) zone logic to give you cleaner entries and exits without sacrificing responsiveness. Four Smoothing Methods at Your Comm
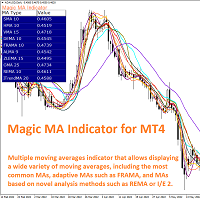
The Magic MA Moving Average Indicator is a market analysis tool that has more than 30 types of moving averages that the trader can use to gauge the market trend. Among the types of moving averages that the trader can visualize are the most common MAs (SMA, EMA and SMMA), adaptive moving averages such as FRAMA and KAMA and other MAs based on innovative calculation and analysis methods such as LSMA, ZLEMA and others. The indicator is designed to display all these moving averages on a single cha
Gold Buster M1 System , XAUUSD çifti üzerindeki M1 çizelgeleri için profesyonel bir ticaret sistemidir. Ancak, sistem başlangıçta yalnızca altın ticareti için geliştirilmiş olmasına rağmen, sistem diğer bazı döviz çiftleriyle de kullanılabilir. Satın alma işleminden sonra size XAUUSD'ye ek olarak sistemle kullanılabilecek işlem çiftlerinin bir listesini vereceğim, bu da bu sistemi kullanma olanaklarınızı genişletecektir. SİSTEMDEKİ TÜM GÖSTERGELER TEKRARLAMA YAPMAYIN! Bu sistem üç göstergeden ol
TouchGuard Alert – Advanced Price Alert & Notification Indicator for MetaTrader 4 (MT4) TouchGuard Alert   is a fast, lightweight, and highly accurate price-touch   Alert & Notification   system designed for   MetaTrader 4 (MT4)   and   MetaTrader 5 (MT5) . It automatically sends real-time   Alerts, Pop-Up Alerts, Email Notifications, Push Notifications   and early-warning notifications when price touches or approaches your chart objects. Key Features (High-Precision Alert & Notification System)
Dynamic Forex28 Navigator
Bernhard Schweigert
4.43 (7)
Dynamic Forex28 Navigator - Yeni Nesil Forex Ticaret Aracı. ŞU ANDA %49 İNDİRİM. Dynamic Forex28 Navigator, uzun zamandır popüler olan göstergelerimizin evrimidir ve üçünün gücünü tek bir göstergede birleştirir: Gelişmiş Döviz Gücü28 Göstergesi (695 inceleme) + Gelişmiş Döviz İMPULS ve UYARI (520 inceleme) + CS28 Kombo Sinyalleri (Bonus). Gösterge hakkında ayrıntılar https://www.mql5.com/en/blogs/post/758844 Yeni Nesil Güç Göstergesi Ne Sunuyor?  Orijinallerde sevdiğiniz her şey, şimdi yeni
The main idea of this indicator is rates analysis and prediction by Fourier transform. Indicator decomposes exchange rates into main harmonics and calculates their product in future. You may use the indicator as a standalone product, but for better prediction accuracy there is another related indicator - FreqoMaster - which uses FreqoMeterForecast as a backend engine and combines several instances of FreqoMeterForecast for different frequency bands. Parameters: iPeriod - number of bars in the ma
VALUE EDITION LIMITED , piyasa analizinde netlik, kesinlik ve hız arayan trader'lar için geliştirilmiş ileri düzey bir teknik göstergedir. MetaTrader 4 ve 5 ile uyumlu olup, akıllı aşırı alım/aşırı satım bölgeleri, dinamik fiyat kanalları, normalize edilmiş mum çubuk analizi ve gerçek zamanlı uyarıları entegre ederek, herhangi bir varlık veya zaman diliminde işlem yapmak için güvenilir destek sağlar. Ana Özellikler Akıllı İşlem Bölgeleri:   Yapılandırılabilir maksimum, ortalama ve minimum seviy
Galactic Volume spread analysis (VSA), is an indicator designed for the visualization of the Volume, and the proportion in which it affects the volatility of the spread of the different pairs. The strategy consists of the following: Bull Trend: Always going in favor of the trend, open buying operations at the lows of the trend, provided that it coincides with a high volume shown by the Galactic VSA indicator. Downtrend: Always going in favor of the trend, open sales operations at the highs of
Fourteen plus nine What is it for? Applying Tom DeMark’s TD Sequential serves the purpose of identifying a price point where an uptrend or a downtrend exhausts itself and reverses. . What are the main components of TD Sequential? TD Sequential has two parts – TD Setup and TD Countdown. The first phase of TD Sequential starts with a TD Setup and is completed with a 9 count. When the 9 count is completed, it is at that point, a price pause, price pullback, or reversal is likely. It is also at tha

Towers
Yvan Musatov
Towers - Trend indicator, shows signals, can be used with optimal risk ratio. It uses reliable algorithms in its calculations. Shows favorable moments for entering the market with arrows, that is, using the indicator is quite simple. It combines several filters to display market entry arrows on the chart. Given this circumstance, a speculator can study the history of the instrument's signals and evaluate its effectiveness. As you can see, trading with such an indicator is easy. I waited for an a


Alpha Trend sign has been a very popular trading tool in our company for a long time. It can verify our trading system and clearly indicate trading signals, and the signals will not drift. Main functions: Based on the market display of active areas, indicators can be used to intuitively determine whether the current market trend belongs to a trend market or a volatile market. And enter the market according to the indicator arrows, with green arrows indicating buy and red arrows indicating se
Bu ürünün alıcıları ayrıca şunları da satın alıyor
Quant Direction
Georgios Kalomoiropoulos
Quant Direction, 3 boyutlu bir piyasa analiz aracıdır. Çeşitli parametrelerdeki yüzdesel sapmaları hassas bir şekilde hesaplayan, tamamen objektif, algoritma tabanlı piyasa analizi sunar. Gelişmiş yapay zeka tabanlı modelleme araçları kullanılarak geliştirilen ve titizlikle test edilen bu algoritma, piyasayı benzersiz bir hassasiyetle analiz eder. Platformda herhangi bir döviz çiftini veya finansal enstrümanı analiz edebilirsiniz. İster kısa vadeli, ister günlük, isterse swing trading yapın, Qua
Hidden Cycles
Lev Vladimirovic Marushkin
5 (1)
The Only 100% Universal Tool! Stop trading against nature! This is your chance to secure the only indicator rooted in the absolute laws that govern the entire universe. Most tools guess—this one reveals the truth. Buy another toy or buy the truth. Your choice... Based on Universal Laws — NOT Some Guy’s Algorithm: Let the market adjust to the Hidden Cycles Geometry — not the other way around. Most indicators are based on a man-made formula. They often lag, fail over time, or need constant re-o
Super Signal – Skyblade Edition Profesyonel No-Repaint / Gecikmesiz Trend Sinyal Sistemi, Olağanüstü Kazanma Oranı ile | MT4 / MT5 için 1 dakika, 5 dakika ve 15 dakika gibi daha düşük zaman dilimlerinde en iyi şekilde çalışır. Temel Özellikler: Super Signal – Skyblade Edition, özellikle trend bazlı işlemler için geliştirilmiş akıllı bir sinyal sistemidir. Yalnızca güçlü, yönlü ve gerçek momentum destekli piyasa hareketlerini tespit etmek amacıyla çok katmanlı bir filtreleme yapısı kullanır. Bu s
Neuro Poseidon MT4
Daria Rezueva
4.74 (46)
Neuro Poseidon is a new indicator by Daria Rezueva. It combines precise trading signals with adaptive TP/SL levels - creating best possible trades as a result! Message me and get  Neuro Poseidon Assistant  as a gift to automize your trading process! What makes it stand out? 1. Proven profitability on all assets and timeframes 2. Only confirmed BUY and SELL signals present on the chart 3. Adaptive TP & SL levels generated by the software for each trade 4. Easy to understand - suitable for all
Gold Channel is a volatility-based indicator, developed with a specific timing algorithm for the XAUUSD pair, which consists of finding possible corrections in the market. This indicator shows two outer lines, an inner line (retracement line) and an arrow sign, where the theory of the channel is to help identify overbought and oversold conditions in the market. The market price will generally fall between the boundaries of the channel. If prices touch or move outside the channel it is a tradi
Şu anda %30 İNDİRİMLİ! Herhangi bir Acemi veya Uzman Tüccar için En İyi Çözüm! Bu gösterge paneli yazılımı 28 döviz çifti üzerinde çalışıyor. Ana göstergelerimizden 2'sine (Gelişmiş Para Birimi Gücü 28 ve Gelişmiş Para Birimi Dürtüsü) dayanmaktadır. Tüm Forex piyasasına harika bir genel bakış sağlar. Gelişmiş Para Birimi Gücü değerlerini, para birimi hareket hızını ve tüm (9) zaman dilimlerinde 28 Forex çifti için sinyalleri gösterir. Trendleri ve / veya scalping fırsatlarını belirlemek için
Supply and Demand Dashboard PRO
Bernhard Schweigert
4.81 (21)
Şu anda %30 İNDİRİMLİ! Bu gösterge paneli, birden fazla sembol ve 9 zaman dilimine kadar çalışan çok güçlü bir yazılım parçasıdır. Ana göstergemize dayanmaktadır (En iyi yorumlar: Advanced Supply Demand ).     Gösterge paneli harika bir genel bakış sağlar. Gösterir:    Bölge mukavemet derecesi dahil filtrelenmiş Arz ve Talep değerleri, Bölgelere/ve bölgeler içindeki pip mesafeleri, İç içe geçmiş bölgeleri vurgular, Tüm (9) zaman dilimlerinde seçilen semboller için 4 çeşit uyarı verir. Kişisel
Miraculous Indicator Binary & Forex v3 StrategySafe Miraculous Indicator Binary & Forex v3 StrategySafe , net sinyaller, güçlü onay araçları ve Binary ile Forex piyasalarında kullanılabilecek yapılandırılmış bir işlem yaklaşımı isteyen traderlar için geliştirilmiş profesyonel bir indikatördür. v3 sürümü; MIR Dashboard, Miraculous Confirmation Dashboard, GANN Law, Square of 9 seviyeleri, GANN açıları ve daha gelişmiş Forex modu ile daha güçlü bir piyasa analizi sunar. Öne çıkan özellikler Tek ind
All in One package includes the  Oscillator Predictor ,  MACD Predictor ,  Thrust Scanner  and  Advanced Fibonacci  indicators which are mandatory for applying  Dinapoli  trade plans.  Please visit below links for detailed explanations of indicators. Advanced Fibonacci Indicator =>  https://www.mql5.com/en/market/product/52834 Thrust Scanner Indicator => https://www.mql5.com/en/market/product/52830 Overbought /Oversold Predictor indicator => https://www.mql5.com/en/market/product/52621 Macd P
BTMM State Engine Pro by G-Labs — Beat The Market Maker indicator for MetaTrader 4. Asian session range, London and New York kill zones, level progression (L1/L2/L3), peak formation detection (PFH/PFL), entry signals, and a multi-pair scanner from one chart. Stop scanning charts one pair at a time. The State Engine tracks the BTMM daily cycle automatically — Asian box, room boundaries, level blocks, peak formations, and filtered entries — while the scanner dashboard shows level, peak status,
KURAMA GOLD SIGNAL PRO (MT4) — 7 Katmanlı Filtre, Otomatik TP/SL, Kalite Puanı ve Sinyal Geçmişi Kaydı | Eksiksiz XAUUSD Ticaret Sistemi Otomatik emir mi istiyorsunuz? MT5 EA sürümü de mevcut Gold Signal Pro EA with Auto TP SL ayrı satılan bir MT5 EA’dır: GOLD M5/M15 için dahili Gold Signal Pro motoru, sinyal seçimi, otomatik emirler, TP/SL ve risk ayarları sunar. Sinyal inceleme veya otomatik yürütme seçilebilir. Bağımsız çalışır, bu göstergeye dahil değildir ve MT4’te çalışmaz. EA özelliklerin
GoldRush Trend Ok Sinyali GoldRush Trend Ok Sinyali göstergesi, XAU/USD'de yüksek hızlı, kısa vadeli scalperlar için özel olarak tasarlanmış hassas, gerçek zamanlı trend analizi sağlar. 1 dakikalık zaman dilimi için özel olarak tasarlanan bu araç, net giriş noktaları için yön okları gösterir ve scalper'ların değişken piyasa koşullarında güvenle hareket etmelerini sağlar. Gösterge, PRIMARY ve SECONDARY uyarı oklarından oluşur. PRIMARY sinyalleri, trend yönündeki değişikliği gösteren Beyaz ve
JSL Orderflow Footprint turns every candle into a price ladder that shows how much volume traded on the bid and on the ask at each price level. It highlights diagonal imbalances, stacked imbalance zones, absorption at candle extremes, cumulative delta (CVD), delta divergence and the daily session volume profile, then combines five of these order-flow conditions into a 0–100 confluence score. A signal is only issued on bar close when the score is high, clearly one-sided and confirmed by the candl
Presenting one-of-a-kind Gann Indicator for XAUUSD IQ Gold Gann Levels is a non-repainting, precision tool designed exclusively for XAUUSD intraday trading. It uses W.D. Gann’s square root method to plot real-time support and resistance levels, helping traders spot high-probability entries with confidence and clarity. William Delbert Gann (W.D. Gann) was an exceptional market analyst whose trading technique was based on a complex blend of mathematics, geometry, astrology, and ancient calculation
OrderFlow Absorption – MT4 için Profesyonel Delta ve Absorpsiyon Sinyal Göstergesi OrderFlow Absorption ile gerçek emir akışı analizinin gücünü keşfedin – MetaTrader 4 için nihai delta histogramı ve absorpsiyon sinyal göstergesi. Fiyat hareketlerinin arkasında gerçekte neler olduğunu görmek isteyen traderlar için tasarlanan bu araç, piyasayı hareket ettiren gizli alım/satım baskısını ve absorpsiyon olaylarını ortaya çıkarır. Özellikler Delta Histogramı Görselleştirme:   Alım ve satım baskısını a
Precision Index Osilatörü (Pi-Osc) - Precision Trading Systems'dan Roger Medcalf Sürüm 2, grafiklerinizde hızlı bir şekilde yüklenmek üzere dikkatle yeniden kodlandı ve deneyimi artırmak için bazı teknik geliştirmeler de içerdi. Pi-Osc, herkesin stoplarını almak için zorlanan pazarların gitmek zorunda kaldığı aşırı yorgunluk noktalarını bulmak için tasarlanmış doğru ticaret zamanlama sinyalleri sunmak amacıyla oluşturuldu. Bu ürün, aşırı noktaların nerede olduğunu bilmek gibi yaşlı bir sorun
Beast Super Signal
Florian Zuercher
4.73 (90)
Kârlı ticaret fırsatlarını kolaylıkla belirlemenize yardımcı olabilecek güçlü bir forex ticaret göstergesi mi arıyorsunuz? Beast Super Signal'den başka bir yere bakmayın. Bu kullanımı kolay trend tabanlı gösterge, sürekli olarak piyasa koşullarını izleyerek yeni gelişen trendleri araştırır veya mevcut trendlere atlar. Canavar Süper Sinyali, tüm dahili stratejiler birbiriyle uyumlu ve %100 örtüştüğünde bir al ya da sat sinyali vererek ek onay ihtiyacını ortadan kaldırır. Sinyal oku uyarısını aldı
ORB Seeker
Marcela Goncalves De Oliveira
4 (1)
Ürünün sınırlı sayıda bulunmasını ve kıtlığını korumak için özel fiyat! Sadece 599 dolar! Satın alma işleminden sonra, bonus ORB Seeker EA ve kişisel olarak optimize edilmiş set dosyalarını almak için benimle iletişime geçin. Temiz antrenman seanslarında güvenle mola verin! ORB Seeker, doğruluk, sadelik, esneklik ve net grafik yapısı isteyen yatırımcılar için tasarlanmış profesyonel bir Açılış Aralığı Kırılımı (ORB) göstergesidir. Otomatik olarak herhangi bir enstrüman için piyasa öncesi veya
Introduction Excessive Momentum Indicator is the momentum indicator to measure the excessive momentum directly from raw price series. Hence, this is an extended price action and pattern trading. Excessive Momentum Indicator was originally developed by Young Ho Seo. This indicator demonstrates the concept of Equilibrium Fractal Wave and Practical Application at the same time. Excessive Momentum detects the market anomaly. Excessive momentum will give us a lot of clue about potential reversal and

Elliott Wave Trend was designed for the scientific wave counting. This tool focuses to get rid of the vagueness of the classic Elliott Wave Counting using the guideline from the template and pattern approach. In doing so, firstly Elliott Wave Trend offers the template for your wave counting. Secondly, it offers Wave Structural Score to assist to identify accurate wave formation. It offers both impulse wave Structural Score and corrective wave Structure Score. Structural Score is the rating to sh
Owl smart levels
Sergey Ermolov
4.26 (38)
Trend yönünde işlem yaparken asıl zorluk bir seviye bulmak değil, girişin gerçekten nerede geçerli olduğunu anlamaktır. Fiyat genellikle seviyelere tepki verir ancak hareket devam etmez — bu da yanlış girişlere veya kaçırılan fırsatlara yol açar. Owl Smart Levels sadece seviyeleri göstermez , aynı zamanda piyasa yapısı ve geri çekilmelere dayalı bölgeler oluşturur. Bu, giriş noktalarını farklı şekilde değerlendirmenizi sağlar ve bazı hatalı sinyallerden kaçınmanıza yardımcı olur. Owl Smart Leve
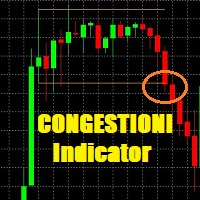
Congestioni
Stefano Frisetti
5 (1)
This indicator is very usefull to TRADE Trading Ranges and helps identify the following TREND. Every Trader knows that any market stay 80% of the time in trading ranges and only 20% of the time in TREND; this indicator has been built to help traders trade trading ranges. Now instead of waiting for the next TREND, You can SWING TRADE on trading ranges with this simple yet very effective indicator. TRADING with CONGESTIONI INDICATOR: The CONGESTIONI Indicator identify a new trading range and ale

I have been trading for some time now and always find it a difficulty remembering the timing of the various market opening hours at the other part of the world (especially, when it comes to daylight saving), but could not find any decent indicator online that could help. And it is for this reason that gives birth to this indicator, which I have spent much time, effort and thinking. As many already know that opening of a certain marketplace, depending on which currency pair, has an impact on the
Introduction to Fractal Pattern Scanner Fractal Indicator refers to the technical indicator that makes use of the fractal geometry found in the financial market. Fractal Pattern Scanner is the advanced Fractal Indicator that brings the latest trading technology after the extensive research and development work in the fractal geometry in the financial market. The most important feature in Fractal Pattern Scanner is the ability to measure the turning point probability as well as the trend probabi
IQ FX Gann Levels a precision trading indicator based on W.D. Gann’s square root methods . It plots real-time, non-repainting support and resistance levels to help traders confidently spot intraday and scalping opportunities with high accuracy. William Delbert Gann (W.D. Gann) was an exceptional market analyst, whose trading technique was based on a complex blend of mathematics, geometry, astrology, and ancient mathematics which proved to be extremely accurate. We don't offer free or bonus indic
Smart Market Structure Pro by G-Labs — ICT and Smart Money Concepts toolkit with built-in multi-symbol scanner for MetaTrader 5. Break of structure, change of character, order blocks, fair value gaps, liquidity sweeps, premium and discount zones, ICT sessions, confluence scoring, AI trade ideas, and a traffic-light scanner across up to 30 pairs and four timeframes from one chart. Map SMC and ICT on the active chart while the built-in scanner monitors your full watchlist. Each cell shows BUY, SE
TPA True Price Action indicator reveals the true price action of the market makers through 100% non-repainting signals (except early signals mode) strictly at the close of a candle! TPA shows entries and re-entries, every time the bulls are definitely stronger than the bears and vice versa. Not to confuse with red/green candles. The shift of power gets confirmed at the earliest stage and is ONE exit strategy of several. There are available now two free parts of the TPA User Guide for our custom
ECM Elite Channel is a volatility-based indicator, developed with a specific time algorithm, which consists of finding possible corrections in the market. This indicator shows two outer lines, an inner line (retracement line) and an arrow sign, where the channel theory is to help identify overbought and oversold conditions in the market. The market price will generally fall between the boundaries of the channel. If prices touch or move outside the channel, it's a trading opportunity. The ind
Titan Z-Score Pro v3.2 Sürüm Notları: Kurumsal UI/UX Yeniden Tasarımı: Performans kokpitleri ve MTF matrisleri ana harita köşelerine taşındı, böylece tertemiz, dağınıklıktan arındırılmış bir alt pencere görünümü sağlandı. Canlı Kazanma Oranı ve Geri Dönüş Kokpiti: Ortalama geri dönüş başarı oranının ve kazanılan ortalama piplerin gerçek zamanlı takibi eklendi. Çok Zaman Dilimi Z-Puan Matrisi: Ana tabloya doğrudan görsel olarak 5 zaman dilimli (M5'ten D1'e) bir durum ızgarası entegre edildi. Yeni
Bu gösterge, pratik ticaret için mükemmel olan otomatik dalga analizine yönelik bir göstergedir! Dava... Not:   Dalga sınıflandırması için Batılı isimleri kullanmaya alışkın değilim. Tang Lun'un (Tang Zhong Shuo Zen) adlandırma kuralının etkisiyle, temel dalgayı   kalem   , ikincil dalga bandını ise   segment   olarak adlandırdım. aynı zamanda segmentin trend yönü vardır. Adlandırma   esas olarak trend segmentidir   (bu adlandırma yöntemi gelecekteki notlarda kullanılacaktır, öncelikle söyleyey
Yazarın diğer ürünleri
KT Support and Resistance Levels MT5
KEENBASE SOFTWARE SOLUTIONS
5 (1)
KT Auto Support Resistance Levels: MetaTrader 4/5 için Çoklu Zaman Dilimi S&R, Smart Zones ve Seviye Paneli Swing tepeleri. Pivotlar. Order block’lar. Önceki tepe ve dipler. Her trader piyasayı biraz farklı şekilde işaretler ve bunun bedelini genellikle grafik öder. Tek ekrana yeterince fazla yöntem yığarsanız, grafik artık bir harita olmaktan çıkar. Gürültüye dönüşür. KT Auto Support Resistance Levels bunu çözer. Aylık, haftalık, günlük ve mevcut zaman diliminizi aynı anda tarar, ardından gerçe
KT Stoch Divergence MT4
KEENBASE SOFTWARE SOLUTIONS
Fiyat yeni bir zirve yaparken Stokastik bu hareketi onaylamıyorsa, traderların neden uyumsuzlukları takip ettiğini zaten biliyorsunuz. KT Stoch Divergence, fiyat ile gösterge arasındaki bu farkları doğrudan grafikte işaretler. Böylece her çizgiyi elle çizmeden olası dönüşleri ve trend devamı fırsatlarını daha kolay görebilirsiniz. Gösterge, fiyat ile Stokastik osilatör arasındaki normal ve gizli uyumsuzlukları bulur. Size otomatik bir işlem emri değil, karar verirken kullanabileceğiniz ek bilgi
ACB Breakout Arrows
KEENBASE SOFTWARE SOLUTIONS
4.15 (34)
İşlem bağlamıyla birlikte kırılma sinyalleri ACB Breakout Arrows, fiyatın sakinleştiği bir aşamadan sonra oluşan yönlü kırılmayı algılar ve kurulumu alış veya satış oku ile işaretler. Ok, algılanan bir kırılma formasyonunu gösterir. Her sinyalin büyük bir harekete dönüşeceğini garanti etmez. Alış oku yükseliş yönlü bir kırılma kurulumunu, satış oku ise düşüş yönlü bir kurulumu gösterir. Fiyat kırılma alanını yeniden test edebileceği veya önceki aralığa dönebileceği için girişten önce piyasa yapı
ACB Trade Filter MT4
KEENBASE SOFTWARE SOLUTIONS
5 (1)
Bir işlem açmadan önce ACB Trade Filter pratik bir soruyu yanıtlamanıza yardımcı olur: Piyasa bu işlemi destekliyor mu, yoksa karışık koşullarda bir sinyali zorla kabul etmeye mi çalışıyorsunuz? Gösterge piyasa duyarlılığını ve trendi analiz eder, ardından sonucu renkli histogram ve trend yönü ile sunar. Normal giriş sinyalinizden sonra doğrulama amacıyla kullanın, giriş sisteminizin yerine koymayın. Üç piyasa durumunu hızlıca görün Yeşil histogram ve yükseliş trendi: koşullar stratejinize uygun
KT Momentum Arrows
KEENBASE SOFTWARE SOLUTIONS
KT Momentum Arrows, bir mum uyarlanabilir fiyat bantlarının dışında kapandığında yükseliş ve düşüş yönlü momentum kırılımlarını oklarla işaretler. Bantlar fiyat sapmasına ve değişen volatiliteye tepki verir. Mavi yukarı ok üst bandın üzerinde kapanışı, kırmızı aşağı ok ise alt bandın altında kapanışı onaylar. Sinyal mum kapandıktan sonra sabitlenir, böylece grafiği daha sonra incelediğinizde ok başka bir bara taşınmaz. Okun gösterdiği hareket Ok, momentumun fiyatı bandın dışına taşıdığı mumu gös
KT COG Advanced MT4
KEENBASE SOFTWARE SOLUTIONS
1 (1)
KT COG is an advanced implementation of the center of gravity indicator presented by John F. Ehlers in the May 2002 edition of Technical Analysis of Stocks & Commodities magazine. It's a leading indicator which can be used to identify the potential reversal points with the minimum lag. The COG oscillator catches the price swings quite effectively. MT5 version of the same indicator is available here KT COG Advanced MT5 Calculation of COG The COG indicator is consist of the two lines. The main l
KT Pin Bar
KEENBASE SOFTWARE SOLUTIONS
KT Pin Bar identifies the pin bar formation which is a type of price action pattern which depicts a sign of reversal or rejection of the trend. When combined with support and resistance, BRN and other significant levels, Pin Bar pattern proved to be a very strong sign of reversal. Basically, a pin bar is characterized by a small body relative to the bar length which is closed either in upper or lower 50% part of its length. They have very large wicks and small candle body. A pin bar candlestic
KT Trend Magic
KEENBASE SOFTWARE SOLUTIONS
Trend yönünü doğrudan grafikte okuyun KT Trend Magic, momentum ile volatiliteyi fiyatı izleyen renkli bir çizgide birleştirir. Çizgi aktif trend durumunu sürekli gösterir ve hesaplanan yön değiştiğinde renk değiştirir. Yeşil çizgi: yükseliş trendi durumunu gösterir. Kırmızı çizgi: düşüş trendi durumunu gösterir. Renk değişimi: grafikte yeni bir yön geçişini işaretler. Süregelen bir hareket sırasında çizgi, geri çekilmeler ve devam hareketleri için dinamik bir grafik referansı olarak da kullanıla
KT Auto Fibo
KEENBASE SOFTWARE SOLUTIONS
Auto Fibonacci indicator that draws the Fibonacci retracement on the swing you are looking at, and redraws it the moment you zoom or scroll the chart. Zoom in on a pullback and the levels measure that pullback. Zoom out and they measure the whole trend. There are no anchor points to drag and no levels to redraw after every new high. Key features Measures the highest high and the lowest low on your screen, the current candle included. Follows zoom, scroll and window size at once, even when the ma
KT Psar Arrows
KEENBASE SOFTWARE SOLUTIONS
KT Psar Arrows, standart Parabolic SAR göstergesini kullanarak grafikte oklar çizer. Mumun en yüksek noktası SAR'a temas ettiğinde yükseliş oku çizilir. Mumun en düşük noktası SAR'a temas ettiğinde düşüş oku çizilir. Sinyaller, mum kapanışını beklemeden gerçek zamanlı olarak üretilir.  Özellikler Parabolic SAR göstergesini kullanan ticaret stratejilerini denemek isteyen yatırımcılar için faydalı bir araçtır.  Piyasadaki dönüş noktalarını bulmak için kullanılabilir. Özel PSAR girişlerini destekl
KT Ichimoku Trader
KEENBASE SOFTWARE SOLUTIONS
1 (1)
Otomatik işlem yapılan beş Ichimoku stratejisi KT Ichimoku Trader, beş klasik Ichimoku Kinko Hyo stratejisiyle işlemleri otomatik olarak açıp kapatan bir Expert Advisor'dır. İstediğiniz stratejileri açarsınız ve her biri kendi başına işlem yapar: kendi giriş kuralları, kendi çıkış kuralları ve aynı anda strateji başına en fazla bir açık işlem ile. Her giriş kapanmış bir mum üzerinde kontrol edilir. Yeni bir mum açıldığında EA az önce kapanan mumu okur ve yalnızca stratejinin tüm giriş kuralları
KT Volatility Oscillator
KEENBASE SOFTWARE SOLUTIONS
KT Volatilite Osilatörü, geçmiş ve mevcut piyasa verilerini matematiksel bir formül kullanarak analiz eder ve sonucu bir osilatör formunda gösterir. Yükselen ve azalan dalgalar, varlığın yüksek ve düşük volatilitesine karşılık gelir.  Kısaca, volatilite bir varlığın belirli bir zaman diliminde fiyat dalgalanmalarının ölçüsüdür. Volatilite olmasaydı, piyasada çok az hareket olurdu ve traderlar fiyat değişimlerinden kazanç sağlayamazdı. Forex Piyasasında Volatilite Kullanımı Forex piyasasında vol
KT COG Robot
KEENBASE SOFTWARE SOLUTIONS
KT COG Robot is a fully automated Expert Advisor based on the KT COG Indicator . The COG indicator was originally presented by John F. Ehlers in the May 2002 edition of Technical Analysis of Stocks & Commodities magazine. The EA fires a long trade when COG line cross above the signal line and a short trade is fired when the COG line cross below the signal line.  Adaptive Filtration Our adaptive filtration algorithm combines the original COG formula with the major trend direction and market acce
ACB Breakout Arrows EA
KEENBASE SOFTWARE SOLUTIONS
ACB kırılma işlem akışını otomatikleştirin ACB Breakout Arrows EA, aktif grafikteki kırılma sinyallerini değerlendirir ve yerleşik ACB Breakout Arrows ile ACB Trade Filter mantığını kullanarak işlemleri yönetir. EA'yı izlemek istediğiniz sembol ve zaman dilimi grafiğine ekleyin, otomatik işlemi etkinleştirin ve ardından test planınıza uygun pozisyon, seans, filtre ve çıkış kurallarını seçin. Gerekli göstergeler ve bileşenler EA içine gömülüdür, bu nedenle ayrı bir indirme gerekmez. Bu göstergele
KT Asian Breakout
KEENBASE SOFTWARE SOLUTIONS
4 (1)
KT Asian Breakout carefully analyzes the range-bound market during the Asian session and then fires a long or short trade after doing some preassessment based on its inbuilt technical analysis module. The executed orders are closed within a day before the completion of the next day session. The inbuilt technical analysis module checks for the session range and compares it with the last 20 days price movement. If it finds any erratic price movement within the session, the orders are not executed
KT London Breakout
KEENBASE SOFTWARE SOLUTIONS
First thirty minutes are essential for a trading session. The early reaction of traders and market players sets a path for the rest of the day. KT London Breakout EA takes advantage of this phenomenon, and after analyzing the first thirty minutes of London session, it places two bidirectional pending orders. One of pending order is eventually canceled after realizing the market direction with certainty. It has been strictly tested and developed for EUR/JPY using 30-Min Time Frame. You can expe
KT Auto Support Resistance Levels: MetaTrader 4/5 için Çoklu Zaman Dilimi S&R, Smart Zones ve Seviye Paneli Swing tepeleri. Pivotlar. Order block’lar. Önceki tepe ve dipler. Her trader piyasayı biraz farklı şekilde işaretler ve bunun bedelini genellikle grafik öder. Tek ekrana yeterince fazla yöntem yığarsanız, grafik artık bir harita olmaktan çıkar. Gürültüye dönüşür. KT Auto Support Resistance Levels bunu çözer. Aylık, haftalık, günlük ve mevcut zaman diliminizi aynı anda tarar, ardından gerçe
Currency strength and pair correlation in one indicator KT Currency Strength and Correlation ranks the eight major currencies from strongest to weakest and shows, in a colored matrix, how closely ten currency pairs of your choice move together. Before you open a trade from your own strategy, you can check whether the two currencies of the pair are really moving apart, and whether the new trade adds risk to a trade you already hold. What you see on the chart Strength lines: a separate window belo
MACD Divergence Seeker
KEENBASE SOFTWARE SOLUTIONS
KT MACD Divergence Seeker trades the regular and hidden divergence signals generated by our free indicator named KT MACD Divergence indicator. Trading the standalone divergences can be a risky affair that's why the KT MACD Divergence Seeker combines the standard divergence signals with an advanced analysis module to exploit the price inefficiencies on some FX pairs. What is the Divergence exactly? As a general conception if the price is making higher highs, then macd should also be making hig
KT Asian Breakout Indicator
KEENBASE SOFTWARE SOLUTIONS
Asya seansı aralığını işaretleyin KT Asian Breakout Indicator, Asya seansındaki dört saatlik bir pencerenin en yüksek ve en düşük seviyelerini işaretler ve aralık tamamlandıktan sonra fiyatı izler. GMT Offset ayarı seansı broker sunucu saatinizle hizalarken Draw Session Box görünür aralığı kontrol eder. Kırılımı ve işlem seviyelerini birlikte görün Fiyat seansın en yüksek seviyesinin üzerinde kapandığında yükseliş oku görünür. Fiyat seansın en düşük seviyesinin altında kapandığında düşüş oku gör
MACD Divergence MT4
KEENBASE SOFTWARE SOLUTIONS
KT MACD Divergence, fiyat ile osilatör arasında oluşan düzenli ve gizli uyumsuzlukları gösterir. Eğer ticaret stratejinizde trend dönüşü bekleniyorsa, potansiyel dönüş noktalarını belirlemek için MACD’nin düzenli uyumsuzluğunu kullanabilirsiniz. Trendin devamına dayalı stratejilerde ise MACD’nin gizli uyumsuzluğu daha uygun bir tercih olacaktır. KT MACD Divergence'nın Sınırlamaları MACD uyumsuzluğunu tek başına giriş sinyali olarak kullanmak riskli olabilir. Her uyumsuzluk mutlaka bir trend dö
KT Bollinger Bands Trader MT4
KEENBASE SOFTWARE SOLUTIONS
KT Bollinger Bands Trader, düşük volatilite dönemlerinde Bollinger Bantlarını kullanarak ortalamaya dönüş stratejisi uygulayan %100 otomatik bir uzman danışmandır (Expert Advisor). Fiyat genellikle Bollinger Bantlarının üst veya alt çizgisine tepki verir, ancak her zaman bir dönüş gerçekleşmez. Bununla birlikte, düşük volatilite dönemlerinde fiyat dönüşü olasılığı daha yüksektir. Girişler Fiyat Bollinger Bantlarının alt çizgisinin altına doğru şekilde hizalandığında alış işlemi başlatılır. Fiya
KT CCI Divergence MT4
KEENBASE SOFTWARE SOLUTIONS
KT CCI Divergence shows the regular and hidden divergence created between the price and CCI oscillator. Divergence is one of the vital signals that depicts the upcoming price reversal in the market. Manually spotting the divergence between price and CCI can be a hectic and ambiguous task. Limitations of KT CCI Divergence   Using the CCI divergence as a standalone entry signal can be risky. Every divergence can't be interpreted as a strong reversal signal. For better results, try to combine it w
KT Heiken Ashi Smoothed MT4
KEENBASE SOFTWARE SOLUTIONS
Yumuşatılmış Heiken Ashi durumunu takip edin KT Heiken Ashi Smoothed, fiyat hareketini yumuşatılmış mavi ve kırmızı mumlara dönüştürür. Durum düşüşten yükselişe geçtiğinde mavi yukarı ok, yükselişten düşüşe geçtiğinde kırmızı aşağı ok ekleyerek yön geçişlerinin grafikte kolayca görülmesini sağlar. Yumuşatma periyodu ve yumuşatma yöntemi, mumların ne ölçüde yumuşatılacağını belirler. Böylece standart Heiken Ashi'ye göre daha istikrarlı bir görünüm sunarken grafiğinize uygun tepkiyi seçmenize olan
KT MA Crossover MT4
KEENBASE SOFTWARE SOLUTIONS
KT MA Crossover, seçilen hareketli ortalamaların kesişimine göre alım ve satım oklarını çizer. Ayrıca her ardışık sinyal için uygun uyarıları üretir ve MFE (En Avantajlı Sapma) değerini görüntüler. Hareketli ortalama kesişimi, dünya çapında trader'lar tarafından yaygın olarak kullanılan temel stratejilerden biridir. Genellikle biri hızlı, diğeri yavaş olmak üzere iki hareketli ortalamadan oluşur ve kesişim yönüne göre alım ya da satım sinyali üretir. Alım sinyali – hızlı MA, yavaş MA'nın üzerin
KT Round Numbers MT4
KEENBASE SOFTWARE SOLUTIONS
KT Round Numbers plots the round number levels which are also commonly known as psychological levels in the Forex world. In the context of Forex trading, round number levels are those levels in which there are two or more zeroes at the end. They are named as 00 levels on the chart. Some traders also consider the halfway points as a valid round number level. They are named as 50 levels on the chart. Use of round number levels in trading Round number levels work as strong support and resistance
KT Inside Bar Advanced MT4
KEENBASE SOFTWARE SOLUTIONS
Despite the popularity of inside bar pattern among the traders, using it as a standalone signal doesn't provide any edge in the market. KT Inside Bar Advanced indicator solves this problem by combining the classic inside bar pattern with the "ECE" cycle and Fibonacci extensions. Using this indicator in place of our classic inside bar indicator will provide a tremendous advantage and edge in the market. What is the ECE cycle? In financial markets, the price never moves in a straight line but u
KT Inside Bar Hunter MT4
KEENBASE SOFTWARE SOLUTIONS
Despite the popularity of inside bar pattern among traders, using it as a standalone entry signal doesn't provide any evidentiary advantage. KT Inside Bar Hunter trades only selected inside bar patterns using some preassessment and ECE price action cycle. Trading Strategy On successful detection of the required pattern, EA places a pending order in the direction of the forecasted price expansion phase. Pending orders are canceled if they are not triggered within the next bar. Once triggered, ac
KT CCI Surfer MT4
KEENBASE SOFTWARE SOLUTIONS
KT CCI Surfer uses a mean reversion trading strategy with a combination of extreme overbought/oversold zone detection using the Commodity Channel Index (CCI). Developed by Donald Lambert in 1980, CCI is a leading indicator that helps to identify the overbought/oversold region in the market without any lag. Obviously, not every overbought/oversold signal turns out into a price reversal. However, when combined with a well-planned mean reversion strategy, it produces excellent results. Recommend
KT RSI Divergence Robot MT4
KEENBASE SOFTWARE SOLUTIONS
Onaylanmış RSI uyumsuzluklarını işlem yapın KT RSI Divergence Robot, grafikteki sembol ve zaman diliminde fiyat ile Göreceli Güç Endeksi arasındaki normal ve gizli uyumsuzlukları izler. Yeni sinyaller bir mum tamamlandıktan sonra değerlendirilir. Yükseliş uyumsuzluğu alış pozisyonu, düşüş uyumsuzluğu ise satış pozisyonu açabilir. Ters yönde bir sinyal oluştuğunda EA, yeni girişi değerlendirmeden önce diğer yöndeki pozisyonları kapatabilir. Giriş koşullarını seçin Temel uyumsuzluk mantığını değiş
Filtrele:
Değerlendirme yok
Değerlendirmeye yanıt