KT Alpha Hunter Arrows Scanner MT4

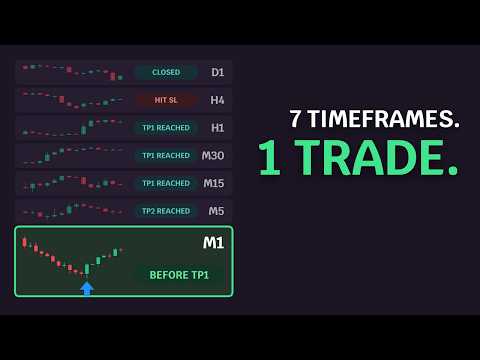
KT Alpha Hunter Arrows Scanner shows every fresh KT Alpha Hunter Arrows signal across all your symbols and timeframes in one table, so you reach the trade while you can still enter it.

A new arrow can appear on any chart while you are watching another one. This scanner indicator watches the whole list for you. It tells you which chart has a new signal, how far that trade has gone and what its profit is right now.

What you get

  • No signal goes unseen: every symbol of your Market Watch, from the 1 minute chart to the daily chart, is checked for you on one chart.
  • Enter on time: the status "Before TP1" marks a signal you can still take. The table also shows when a trade has passed its targets, hit its stop loss or was closed by the opposite signal.
  • The same ratings as on your chart: each row carries the buy and sell rating that KT Alpha Hunter Arrows gives that chart after Auto Optimize.
  • Live profit of every trade: in pips for forex and in points for gold, indices and shares.
  • One click to the ready chart: the Open button brings up the chart with KT Alpha Hunter Arrows already optimized, with the entry, the stop loss and TP1 to TP4 drawn.
  • Alerts once per signal: by popup with sound, push notification or email.


How to use it

Attach the scanner to one chart and leave it running. The table fills on the first run and is ready in about a minute after each restart. Start with the "Can enter now" card at the top, sort or search the table to find your symbol, then press Open on the row you want to trade.

The table works on its own. The Open button needs KT Alpha Hunter Arrows installed.

Recommendations

Use it on the markets you trade with KT Alpha Hunter Arrows: forex pairs, gold, indices and shares. Give the scanner a chart of its own so the table has room, and start it a few minutes before your session so the price history of every symbol is loaded. A signal is final when its candle closes.

Input parameters

  • Symbols: your own comma separated list; empty scans Market Watch.
  • Most symbols scanned: how many symbols the table holds.
  • Scan M1 to Scan MN1: the timeframes in the table.
  • Run Auto Optimize again after (days): how often each chart is optimized again.
  • Show No-Edge Signals as Exit Marks: keep it the same as in KT Alpha Hunter Arrows.
  • Show rows rated: all rows, or only the rows with a chosen rating or better.
  • Fresh signal: candles old or newer and Show only rows with a fresh signal: how new a signal must be to count as fresh, and a filter for fresh rows.
  • Rows per page and Panel corner: the size and place of the table.
  • Alerts: new signals, M1 and M5 alerts, exit alerts, popup with sound, push notification and email.


One table in place of a hundred charts

You see where the fresh signal is, you know if you can still enter, and you reach the chart in one click. Your time goes to the trades.
Produits recommandés
30 Indicator Comment Center — Your Full Trading Desk on One Chart (MT4 Edition) 30 Indicator Comment Center turns your MetaTrader 4 chart into a complete confluence-trading workstation. Instead of stacking a dozen separate indicators and guessing how they agree, this tool runs 30 professional-grade technical engines simultaneously , blends them into a single live verdict, and presents everything through a clean, modern six-page interface — built right on your chart. No more switching windows. No
Hit Rate Top Bottom Signal
Martin Alejandro Bamonte
Hit Rate Top Bottom Signal Hit Rate Top Bottom Signal Hit Rate Top Bottom Signal offre une approche totalement innovante. Il est idéal pour ceux qui souhaitent évaluer à l’avance comment le signal fonctionne avec un TP-SL spécifique et dans quels PAIRES/TF il est le plus performant. La stratégie Hit Rate Top Bottom Signal est un outil essentiel pour tout trader et type de trading car elle émet non seulement des signaux précis sans redessiner , indiquant clairement quand trader et dans quelle dir
'Zoro LITE' is a reversal strategy based MT4 indicator with advance pre-alert system. Its an 100% non repaint indicator with an average accuracy of about 70-95% in a ranging market. --------------------------------------------------------- Features: Neural Network based Advance price action algorithms Pre-alert (get ready) signals Non-delay indications 24/7 signals OTC markets supported Auto-trading supported 100% Non repaint 100% No lag No recalculating Lifetime license -----------------------
Complete SMC/ICT Indicator MT5 — Outil Smart Money Concepts   Le Complete SMC/ICT Indicator est un outil d’analyse Smart Money Concepts autonome qui fonctionne directement dans la fenêtre du graphique. Il offre une détection de niveau institutionnel des structures de marché, des déséquilibres et des zones de liquidité, avec une personnalisation complète et des alertes.   Fonctionnalités   L’indicateur détecte dix éléments clés du SMC : sommets et creux de swing, fair value gaps, order blocks, c

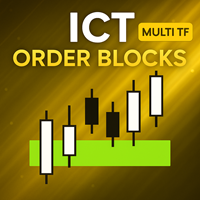
[ MT5 Version ]  [ Kill Zones ]  [ SMT Divergences ] Order Blocks ICT Multi TF - FVG-Confirmed Order Blocks for MT5 Most ICT order block indicators for MT5 turn every opposite candle into an order block. The chart fills up and the label stops meaning anything. Order Blocks ICT Multi TF uses Fair Value Gap confirmation and monitors up to four timeframes from one chart. It is built for traders who want a defined reason for the block, not another coloured rectangle. GIVE THE BLOCK A REASON TO MATTE
Title: Smart Quant Enhanced Indicator (Adaptive Nonlinear Filtering & Ensemble Learning Framework) — Technical Features & Algorithmic Logic Description Overview This indicator integrates adaptive nonlinear time series analysis with Ensemble Learning algorithms to statistically model the deeper microstructure of price movements. It presents multidimensional data views via dynamic vector arrows and volatility channel bands on the chart, incorporating a built-in Kalman Filter for real-time noise re

L'Indice Directionnel Moyen (ADX) Scanner Multidevises MT4 est un indicateur de trading avancé conçu pour analyser plusieurs paires de devises simultanément. Il bénéficie aux traders cherchant à améliorer leur processus de prise de décision en fournissant des signaux en temps réel basés sur l'Indice Directionnel Moyen, permettant une analyse efficace des tendances du marché. Cet outil simplifie l'expérience de trading en facilitant l'identification de la force des tendances et du mouvement direc

Chart Patterns Detect 15 patterns (Ascending Triangle, Descending Triangle, Rising Wedge, Falling Wedge, Bullish Flag, Bearish Flag, Bullish Rectangle, Bearish Rectangle Symmetrical triangle, Head and Shoulders, Inverted Head and Shoulders, Triple top, Triple Bottom, Double Top, Double Bottom) Use historical data to calculate the probability of each pattern to succeed (possibility to filter notification according to the chance of success) gives graphic indication about the invalidation level and
Présentation du Hull Suite by InSilico MT4, un indicateur de trading sophistiqué conçu pour améliorer votre analyse technique en fournissant une visualisation des tendances fluide et à faible latence. Cet outil est idéal pour les traders recherchant la précision dans leurs stratégies de trading sur divers marchés, y compris forex, les indices, les matières premières et les cryptomonnaies. Avec le Hull Suite by InSilico MT4, les traders peuvent bénéficier d'avantages significatifs tels qu'une mei

NQX Session Range Breakout MT4 est un indicateur de signaux pour MetaTrader 4 : cassure du range nocturne à l'ouverture européenne. Logique NQX propriétaire qui délimite le range nocturne calme et signale la première clôture décisive au-delà de celui-ci dans la fenêtre européenne. Il trace l'entrée suggérée, un stop court et des objectifs éloignés (3:1, 5:1, 10:1) ; vous décidez. Ce qu'il affiche sur le graphique - Une flèche sur la bougie de signal clôturée (il ne redessine jamais un signal clô
Single-Symbol Turtle Strategy (Medium-to-Long Term Version 1.00) Recommended Timeframe: H4 Recommended Instruments: GBPUSD | GBPJPY | USDJPY | XAUUSD | XTIUSD | CADJPY | GBPCAD | USTEC | BTCUSD | HK50 | DE40 | JP225 Strategy Overview Entry: Breakout of the long-period Donchian Channel (default: 55 periods). Position Sizing: Percentage-based stop loss to determine position size (default: 1% risk per trade). Exit: Reverse breakout of the short-period Donchian Channel (default: 10 periods). I
Divergence Matrix Pro for MetaTrader 4 Divergence Matrix Pro is a confirmed multi-oscillator divergence indicator for MetaTrader 4. It detects regular and hidden divergence between price and selected oscillators, then presents the confirmed structure through divergence lines, pivot labels, action markers, an optional current-timeframe Matrix Panel and optional alerts. The indicator is an analysis and confirmation tool. It does not open or close trades, and the signal score is not a win rate or a

Advanced Trend Regime
Shellard Securities (Pty) Ltd
The indicator has been designed to function on any time-frame and any pair.   This regime filter will help the trader better evaluate whether the current market is trending, and in which direction. It quickly reacts to changes in market dynamics using a series of advanced calculations. The user is able to select whether the calculation remains standard, or if a further filter constraint is added to the calculation.   A Yellow moving average of the signal has been included for the trader to smoot
SuperTrend Sentinel Levels est un indicateur SuperTrend sans repaint pour MetaTrader 4, qui combine le moteur de suivi de tendance SuperTrend classique avec un filtre de confluence à cinq « portes » pour une sélection de signaux de haute qualité. À chaque retournement de tendance, une flèche d’achat ou de vente est dessinée ainsi qu’une architecture de risque complète sur le graphique — Entrée, Stop Loss (fixe ou suiveur), TP1, TP2 et TP3 — et un tableau de bord complet de 18 lignes suit en temp
UTBot with HTS filter
Bartlomiej Tadeusz Tomaja
Advanced UT Bot & HTS Indicator This indicator is an advanced technical analysis tool that combines two methods: UT Bot and HTS (Higher Timeframe Smoothing) , to generate accurate buy and sell signals. 1. Indicator Structure Works within the main chart window and utilizes 11 buffers to store various data points, including arrows (buy/sell signals) and bands from both UT Bot and HTS systems. Uses colored arrows to represent different trading conditions: Blue arrows : Normal buy signals. Red arro
Visual Vortex Indicator MT4
AL MOOSAWI ABDULLAH JAFFER BAQER
Unleash the Power of Market Dynamics with the Vortex Indicator! The Visual Vortex Indicator is your advanced tool for decoding market trends, reversals, and momentum shifts. Priced at $65, this indicator provides a comprehensive view of market behavior, but it’s designed for you to fine-tune and optimize it according to your unique trading strategy. What Makes It Unique? The Vortex Indicator is based on a strategy that identifies directional movements and trend strength by analyzing key price d
Glod888EA
Dong Liang Zheng
Our team has been professionally developing gold trading EAs for three years. Every engineer is a real-account forex and gold trader with years of experience. This integrates multiple technologies, including trend following, Martingale, grid, and AI. Currently, we are using it for our own live trading and encourage everyone to download and test it. If wish to observe our trading, please feel free to contact us. Thank you all, and we wish you great success and massive profits
KT Renko Patterns Robot MT4
KEENBASE SOFTWARE SOLUTIONS
Négociez les figures choisies sur un graphique Renko actif KT Renko Patterns Robot MT4 est un Expert Advisor qui ouvre et gère des positions lorsque son moteur intégré identifie une formation sélectionnée sur un graphique Renko généré. Utilisez un générateur compatible avec le trading d'un EA en direct, comme KT Renko Chart Generator, puis placez le robot sur le graphique créé. Dans les Properties de ce graphique, décochez Offline Chart pour permettre le fonctionnement de l'EA. L'indicateur KT R
Nomen Magic Candle
Noomen Ben Khadimallah Khadimallah
Nomen Magic Candle – Fini le chaos sur vos graphiques ! Indicateur MT4 Sans Repaint L'attente est enfin terminée. Il est temps de révolutionner votre écran. Bienvenue sur le « Magic Chart » . Profitez de lignes tracées avec une clarté absolue pour une stratégie de trading de haute précision. Propulsé par une analyse de marché algorithmique moderne, cet outil décrypte précisément les zones de liquidité cachées, vous offrant ainsi l'avantage invisible et décisif sur la masse. Vous sentez-vous é
Smoothed Heiken Ashi with AC/AO Zones – Professional Trading Clarity Transform your Heiken Ashi analysis with intelligent smoothing that eliminates noise while preserving actionable signals. What Makes This Different? This isn't just another Heiken Ashi indicator. We've engineered a sophisticated smoothing engine that works with the Accelerator (AC) and Awesome Oscillator (AO) zone logic to give you cleaner entries and exits without sacrificing responsiveness. Four Smoothing Methods at Your Comm
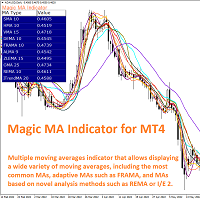
The Magic MA Moving Average Indicator is a market analysis tool that has more than 30 types of moving averages that the trader can use to gauge the market trend. Among the types of moving averages that the trader can visualize are the most common MAs (SMA, EMA and SMMA), adaptive moving averages such as FRAMA and KAMA and other MAs based on innovative calculation and analysis methods such as LSMA, ZLEMA and others. The indicator is designed to display all these moving averages on a single cha
Gold Buster M1 System est un système de trading professionnel pour les graphiques M1 sur la paire XAUUSD. Mais, malgré le fait que le système a été développé à l'origine exclusivement pour le commerce de l'or, le système peut également être utilisé avec d'autres paires de devises. Après l'achat, je vous donnerai une liste de paires de trading pouvant être utilisées avec le système en plus de XAUUSD, ce qui élargira vos possibilités d'utilisation de ce système. TOUS LES INDICATEURS DU SYSTÈME NE
TouchGuard Alert – Advanced Price Alert & Notification Indicator for MetaTrader 4 (MT4) TouchGuard Alert   is a fast, lightweight, and highly accurate price-touch   Alert & Notification   system designed for   MetaTrader 4 (MT4)   and   MetaTrader 5 (MT5) . It automatically sends real-time   Alerts, Pop-Up Alerts, Email Notifications, Push Notifications   and early-warning notifications when price touches or approaches your chart objects. Key Features (High-Precision Alert & Notification System)
Dynamic Forex28 Navigator
Bernhard Schweigert
4.43 (7)
Dynamic Forex28 Navigator - L'outil de trading Forex de nouvelle génération. ACTUELLEMENT 49 % DE RÉDUCTION. Dynamic Forex28 Navigator est l'évolution de nos indicateurs populaires de longue date, combinant la puissance de trois en un : Advanced Currency Strength28 Indicator (695 avis) + Advanced Currency IMPULSE avec ALERT (520 avis) + CS28 Combo Signals (Bonus). Détails sur l'indicateur https://www.mql5.com/en/blogs/post/758844 Qu'offre l'indicateur de force de nouvelle génération ? Tout
The main idea of this indicator is rates analysis and prediction by Fourier transform. Indicator decomposes exchange rates into main harmonics and calculates their product in future. You may use the indicator as a standalone product, but for better prediction accuracy there is another related indicator - FreqoMaster - which uses FreqoMeterForecast as a backend engine and combines several instances of FreqoMeterForecast for different frequency bands. Parameters: iPeriod - number of bars in the ma
VALUE EDITION LIMITED   est un indicateur technique avancé, conçu pour les traders qui recherchent de la clarté, de la précision et de la rapidité dans l'analyse des marchés. Compatible avec MetaTrader 4 et 5, il intègre des zones de surachat/survente intelligentes, des canaux de prix dynamiques, une analyse de chandeliers normalisée et des alertes en temps réel, offrant ainsi un support fiable pour trader n'importe quel actif ou période graphique. Caractéristiques principales Zones de trading
Galactic Volume spread analysis (VSA), is an indicator designed for the visualization of the Volume, and the proportion in which it affects the volatility of the spread of the different pairs. The strategy consists of the following: Bull Trend: Always going in favor of the trend, open buying operations at the lows of the trend, provided that it coincides with a high volume shown by the Galactic VSA indicator. Downtrend: Always going in favor of the trend, open sales operations at the highs of
Fourteen plus nine TD Sequential
MOHAMMED IMAD HUSSEIN BASSEE
Fourteen plus nine What is it for? Applying Tom DeMark’s TD Sequential serves the purpose of identifying a price point where an uptrend or a downtrend exhausts itself and reverses. . What are the main components of TD Sequential? TD Sequential has two parts – TD Setup and TD Countdown. The first phase of TD Sequential starts with a TD Setup and is completed with a 9 count. When the 9 count is completed, it is at that point, a price pause, price pullback, or reversal is likely. It is also at tha
Towers
Yvan Musatov
Towers - Trend indicator, shows signals, can be used with optimal risk ratio. It uses reliable algorithms in its calculations. Shows favorable moments for entering the market with arrows, that is, using the indicator is quite simple. It combines several filters to display market entry arrows on the chart. Given this circumstance, a speculator can study the history of the instrument's signals and evaluate its effectiveness. As you can see, trading with such an indicator is easy. I waited for an a
Alpha Trend sign est notre outil de Trading très populaire depuis longtemps, il valide notre système de Trading et invite clairement les signaux de Trading sans dérive. Fonctions principales: • En fonction de la zone active du marché, selon les indicateurs, il est intuitif de déterminer si le cours actuel appartient à la tendance ou à la tendance. Et coupez le marché selon les flèches d'indication de l'indicateur, les flèches vertes suggèrent d'acheter et les flèches rouges suggèrent de vend
Les acheteurs de ce produit ont également acheté
Quant Direction
Georgios Kalomoiropoulos
Quant Direction est un outil d'analyse de marché 3D. Il fournit une analyse de marché parfaitement objective, basée sur un algorithme, en calculant des écarts précis en pourcentage sur différents paramètres. Développé à l'aide d'outils de modélisation avancés basés sur l'IA et soumis à des tests rigoureux, cet algorithme analyse le marché avec une précision inégalée. Vous pouvez analyser n'importe quelle paire de devises ou instrument financier sur la plateforme. Que vous pratiquiez le trading à
Hidden Cycles
Lev Vladimirovic Marushkin
5 (1)
The Only 100% Universal Tool! Stop trading against nature! This is your chance to secure the only indicator rooted in the absolute laws that govern the entire universe. Most tools guess—this one reveals the truth. Buy another toy or buy the truth. Your choice... Based on Universal Laws — NOT Some Guy’s Algorithm: Let the market adjust to the Hidden Cycles Geometry — not the other way around. Most indicators are based on a man-made formula. They often lag, fail over time, or need constant re-o
Super Signal – Skyblade Edition Système de signaux de tendance professionnel sans repaint / sans latence, avec un taux de réussite exceptionnel | Pour MT4 / MT5 Il fonctionne mieux sur des unités de temps inférieures, comme 1 minute, 5 minutes et 15 minutes. Caractéristiques principales : Super Signal – Skyblade Edition est un système de signaux intelligent conçu spécifiquement pour le trading de tendance. Il utilise une logique de filtrage multicouche pour détecter uniquement les mouvements d
Neuro Poseidon MT4
Daria Rezueva
4.74 (46)
Neuro Poseidon is a new indicator by Daria Rezueva. It combines precise trading signals with adaptive TP/SL levels - creating best possible trades as a result! Message me and get  Neuro Poseidon Assistant  as a gift to automize your trading process! What makes it stand out? 1. Proven profitability on all assets and timeframes 2. Only confirmed BUY and SELL signals present on the chart 3. Adaptive TP & SL levels generated by the software for each trade 4. Easy to understand - suitable for all
Gold Channel is a volatility-based indicator, developed with a specific timing algorithm for the XAUUSD pair, which consists of finding possible corrections in the market. This indicator shows two outer lines, an inner line (retracement line) and an arrow sign, where the theory of the channel is to help identify overbought and oversold conditions in the market. The market price will generally fall between the boundaries of the channel. If prices touch or move outside the channel it is a tradi
Actuellement 30% de réduction ! La meilleure solution pour tout débutant ou trader expert ! Ce logiciel de tableau de bord fonctionne sur 28 paires de devises. Il est basé sur 2 de nos principaux indicateurs (Advanced Currency Strength 28 et Advanced Currency Impulse). Il donne un excellent aperçu de l'ensemble du marché Forex. Il montre les valeurs de l'Advanced Currency Strength, la vitesse de mouvement des devises et les signaux pour 28 paires de devises dans tous les (9) délais. Imaginez
Supply and Demand Dashboard PRO
Bernhard Schweigert
4.81 (21)
Actuellement 30% de réduction ! Ce tableau de bord est un logiciel très puissant qui fonctionne sur plusieurs symboles et jusqu'à 9 horizons temporels. Il est basé sur notre indicateur principal (Best reviews : Advanced Supply Demand ).   Le tableau de bord donne une excellente vue d'ensemble. Il montre :  Les valeurs d'offre et de demande filtrées, y compris l'évaluation de la force de la zone, Les distances en pips vers/et dans les zones, Il met en évidence les zones imbriquées, Il donne 4
Miraculous Indicator Binary & Forex v3 StrategySafe Miraculous Indicator Binary & Forex v3 StrategySafe est un indicateur professionnel conçu pour les traders qui recherchent des signaux clairs, des outils de confirmation puissants et une méthode structurée pour trader les marchés Binary et Forex. La version v3 intègre le MIR Dashboard, le Miraculous Confirmation Dashboard, la GANN Law, les niveaux Square of 9, les angles GANN et un mode Forex plus avancé pour une analyse plus complète. Fonction
All in One package includes the  Oscillator Predictor ,  MACD Predictor ,  Thrust Scanner  and  Advanced Fibonacci  indicators which are mandatory for applying  Dinapoli  trade plans.  Please visit below links for detailed explanations of indicators. Advanced Fibonacci Indicator =>  https://www.mql5.com/en/market/product/52834 Thrust Scanner Indicator => https://www.mql5.com/en/market/product/52830 Overbought /Oversold Predictor indicator => https://www.mql5.com/en/market/product/52621 Macd P
BTMM State Engine Pro by G-Labs — Beat The Market Maker indicator for MetaTrader 4. Asian session range, London and New York kill zones, level progression (L1/L2/L3), peak formation detection (PFH/PFL), entry signals, and a multi-pair scanner from one chart. Stop scanning charts one pair at a time. The State Engine tracks the BTMM daily cycle automatically — Asian box, room boundaries, level blocks, peak formations, and filtered entries — while the scanner dashboard shows level, peak status,
KURAMA GOLD SIGNAL PRO (MT4) — Filtre à 7 couches · TP/SL automatique · Score de qualité · Sauvegarde de l'historique des signaux | Système de trading complet pour le XAUUSD Vous souhaitez des ordres automatiques ? Une édition EA MT5 existe aussi Gold Signal Pro EA with Auto TP SL est un EA MT5 vendu séparément : moteur Gold Signal Pro intégré, sélection, ordres automatiques, TP/SL et réglages de risque pour GOLD M5/M15. Choisissez examen des signaux ou exécution automatique. Autonome, non inclu
Signal GoldRush Trend Arrow L'indicateur GoldRush Trend Arrow Signal fournit une analyse précise et en temps réel des tendances, spécialement conçue pour les scalpers à haute vitesse et à court terme sur la paire XAU/USD. Conçu spécialement pour les intervalles de temps d'une minute, cet outil affiche des flèches directionnelles indiquant clairement les points d'entrée, ce qui permet aux scalpers de naviguer en toute confiance dans des conditions de marché volatiles. L'indicateur se compose
JSL Orderflow Footprint turns every candle into a price ladder that shows how much volume traded on the bid and on the ask at each price level. It highlights diagonal imbalances, stacked imbalance zones, absorption at candle extremes, cumulative delta (CVD), delta divergence and the daily session volume profile, then combines five of these order-flow conditions into a 0–100 confluence score. A signal is only issued on bar close when the score is high, clearly one-sided and confirmed by the candl
Presenting one-of-a-kind Gann Indicator for XAUUSD IQ Gold Gann Levels is a non-repainting, precision tool designed exclusively for XAUUSD intraday trading. It uses W.D. Gann’s square root method to plot real-time support and resistance levels, helping traders spot high-probability entries with confidence and clarity. William Delbert Gann (W.D. Gann) was an exceptional market analyst whose trading technique was based on a complex blend of mathematics, geometry, astrology, and ancient calculation
OrderFlow Absorption – Indicateur professionnel de delta et de signaux d’absorption pour MT4 Libérez la puissance de l’analyse réelle du flux d’ordres avec OrderFlow Absorption – l’indicateur ultime d’histogramme delta et de signaux d’absorption pour MetaTrader 4. Conçu pour les traders qui veulent comprendre ce qui se passe réellement derrière chaque mouvement de prix, cet outil révèle la pression d’achat/vente cachée et les événements d’absorption qui font bouger le marché. Fonctionnalités Vis
PTS Precision Index Oscillator V2
PrecisionTradingSystems
5 (1)
L'oscillateur de l'indice de précision (Pi-Osc) de Roger Medcalf de Precision Trading Systems La version 2 a été soigneusement recodée pour être ultra-rapide à charger sur votre graphique, et quelques autres améliorations techniques ont été incorporées pour améliorer l'expérience. Le Pi-Osc a été créé pour fournir des signaux de synchronisation de trading précis conçus pour trouver des points d'épuisement extrêmes, les points auxquels les marchés sont contraints d'aller simplement pour élimin
Beast Super Signal
Florian Zuercher
4.73 (90)
Vous recherchez un puissant indicateur de trading forex qui peut vous aider à identifier facilement des opportunités de trading rentables ? Ne cherchez pas plus loin que le Beast Super Signal. Cet indicateur basé sur les tendances facile à utiliser surveille en permanence les conditions du marché, en recherchant de nouvelles tendances en développement ou en sautant sur celles existantes. Le Beast Super Signal donne un signal d'achat ou de vente lorsque toutes les stratégies internes s'alignent e
ORB Seeker
Marcela Goncalves De Oliveira
4 (1)
Prix spécial pour limiter la disponibilité et maintenir la rareté du produit ! Seulement 599 $ ! Après votre achat, contactez-moi pour obtenir le bonus ORB Seeker EA et les fichiers de configuration optimisés personnalisés. Réussissez vos sessions de mixage en toute confiance ! ORB Seeker est un indicateur professionnel de cassure de la plage d'ouverture (ORB) conçu pour les traders qui recherchent précision, simplicité, flexibilité et une structure graphique claire. Il trace automatiquement l
Introduction Excessive Momentum Indicator is the momentum indicator to measure the excessive momentum directly from raw price series. Hence, this is an extended price action and pattern trading. Excessive Momentum Indicator was originally developed by Young Ho Seo. This indicator demonstrates the concept of Equilibrium Fractal Wave and Practical Application at the same time. Excessive Momentum detects the market anomaly. Excessive momentum will give us a lot of clue about potential reversal and
Elliott Wave Trend was designed for the scientific wave counting. This tool focuses to get rid of the vagueness of the classic Elliott Wave Counting using the guideline from the template and pattern approach. In doing so, firstly Elliott Wave Trend offers the template for your wave counting. Secondly, it offers Wave Structural Score to assist to identify accurate wave formation. It offers both impulse wave Structural Score and corrective wave Structure Score. Structural Score is the rating to sh
Owl smart levels
Sergey Ermolov
4.26 (38)
Lors du trading dans le sens de la tendance, la principale difficulté n’est pas de trouver un niveau, mais de comprendre où une entrée est réellement valide. Le prix réagit souvent aux niveaux, mais ne parvient pas à poursuivre le mouvement — ce qui entraîne des entrées erronées ou des opportunités manquées. Owl Smart Levels ne se contente pas d’afficher des niveaux , mais des zones formées à partir de la structure du marché et des retracements. Cela permet d’évaluer les points d’entrée différem
Congestioni
Stefano Frisetti
5 (1)
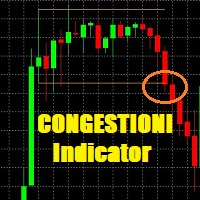
This indicator is very usefull to TRADE Trading Ranges and helps identify the following TREND. Every Trader knows that any market stay 80% of the time in trading ranges and only 20% of the time in TREND; this indicator has been built to help traders trade trading ranges. Now instead of waiting for the next TREND, You can SWING TRADE on trading ranges with this simple yet very effective indicator. TRADING with CONGESTIONI INDICATOR: The CONGESTIONI Indicator identify a new trading range and ale
I have been trading for some time now and always find it a difficulty remembering the timing of the various market opening hours at the other part of the world (especially, when it comes to daylight saving), but could not find any decent indicator online that could help. And it is for this reason that gives birth to this indicator, which I have spent much time, effort and thinking. As many already know that opening of a certain marketplace, depending on which currency pair, has an impact on the
Introduction to Fractal Pattern Scanner Fractal Indicator refers to the technical indicator that makes use of the fractal geometry found in the financial market. Fractal Pattern Scanner is the advanced Fractal Indicator that brings the latest trading technology after the extensive research and development work in the fractal geometry in the financial market. The most important feature in Fractal Pattern Scanner is the ability to measure the turning point probability as well as the trend probabi
IQ FX Gann Levels a precision trading indicator based on W.D. Gann’s square root methods . It plots real-time, non-repainting support and resistance levels to help traders confidently spot intraday and scalping opportunities with high accuracy. William Delbert Gann (W.D. Gann) was an exceptional market analyst, whose trading technique was based on a complex blend of mathematics, geometry, astrology, and ancient mathematics which proved to be extremely accurate. We don't offer free or bonus indic
Smart Market Structure Pro by G-Labs — ICT and Smart Money Concepts toolkit with built-in multi-symbol scanner for MetaTrader 5. Break of structure, change of character, order blocks, fair value gaps, liquidity sweeps, premium and discount zones, ICT sessions, confluence scoring, AI trade ideas, and a traffic-light scanner across up to 30 pairs and four timeframes from one chart. Map SMC and ICT on the active chart while the built-in scanner monitors your full watchlist. Each cell shows BUY, SE
TPA True Price Action indicator reveals the true price action of the market makers through 100% non-repainting signals (except early signals mode) strictly at the close of a candle! TPA shows entries and re-entries, every time the bulls are definitely stronger than the bears and vice versa. Not to confuse with red/green candles. The shift of power gets confirmed at the earliest stage and is ONE exit strategy of several. There are available now two free parts of the TPA User Guide for our custom
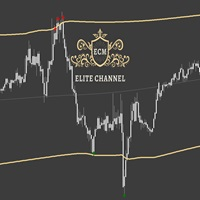
ECM Elite Channel is a volatility-based indicator, developed with a specific time algorithm, which consists of finding possible corrections in the market. This indicator shows two outer lines, an inner line (retracement line) and an arrow sign, where the channel theory is to help identify overbought and oversold conditions in the market. The market price will generally fall between the boundaries of the channel. If prices touch or move outside the channel, it's a trading opportunity. The ind
Titan Z-Score Pro v3.2 Sürüm Notları: Kurumsal UI/UX Yeniden Tasarımı: Performans kokpitleri ve MTF matrisleri ana harita köşelerine taşındı, böylece tertemiz, dağınıklıktan arındırılmış bir alt pencere görünümü sağlandı. Canlı Kazanma Oranı ve Geri Dönüş Kokpiti: Ortalama geri dönüş başarı oranının ve kazanılan ortalama piplerin gerçek zamanlı takibi eklendi. Çok Zaman Dilimi Z-Puan Matrisi: Ana tabloya doğrudan görsel olarak 5 zaman dilimli (M5'ten D1'e) bir durum ızgarası entegre edildi. Yeni
Cet indicateur est un indicateur d'analyse automatique des vagues, parfait pour le trading pratique ! Cas... Remarque :   je n'ai pas l'habitude d'utiliser des noms occidentaux pour l'évaluation des vagues. En raison de l'influence de la convention de dénomination de Tang Lun (Tang Zhong Shuo Zen), j'ai nommé la vague de base comme   un stylo   et la bande d'onde secondaire comme   un segment   . en même temps, le segment a la direction de la tendance.Le   segment de tendance principal   est no
Plus de l'auteur
KT Support and Resistance Levels MT5
KEENBASE SOFTWARE SOLUTIONS
5 (1)
KT Auto Support Resistance Levels : S&R multi-timeframe, Smart Zones et tableau de bord des niveaux pour MetaTrader 4/5 Sommets de swing. Pivots. Order blocks. Plus hauts et plus bas précédents. Chaque trader marque le marché à sa façon, et c’est souvent le graphique qui en paie le prix. Empilez trop de méthodes sur un seul écran et il cesse d’être une carte. Il devient du bruit. KT Auto Support Resistance Levels règle ce problème. L’indicateur analyse en même temps le mensuel, l’hebdomadaire, l
KT Stoch Divergence MT4
KEENBASE SOFTWARE SOLUTIONS
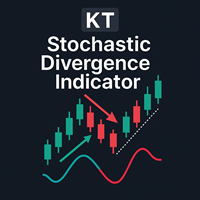
Si vous avez déjà vu le prix inscrire un nouveau sommet alors que le Stochastique ne confirmait pas le mouvement, vous savez pourquoi les traders surveillent les divergences. KT Stoch Divergence marque ces désaccords directement sur le graphique afin de repérer plus facilement les retournements possibles et les continuations de tendance, sans tracer chaque ligne à la main. L'indicateur détecte les divergences régulières et cachées entre le prix et l'oscillateur Stochastique. Il vous apporte du c
ACB Breakout Arrows
KEENBASE SOFTWARE SOLUTIONS
4.15 (34)
Signaux de cassure avec contexte de marché ACB Breakout Arrows détecte une phase de stabilisation du prix suivie d'une cassure directionnelle et marque la configuration avec une flèche d'achat ou de vente. La flèche identifie une structure de cassure. Elle ne garantit pas que chaque signal deviendra un mouvement important. Une flèche d'achat met en évidence une configuration de cassure haussière, tandis qu'une flèche de vente indique une configuration baissière. Comme le prix peut retester la zo
ACB Trade Filter MT4
KEENBASE SOFTWARE SOLUTIONS
5 (1)
Avant d'ouvrir une position, ACB Trade Filter vous aide à répondre à une question pratique : le marché soutient-il cette opération ou essayez-vous de forcer un signal dans des conditions contradictoires ? L'indicateur analyse le sentiment du marché et la tendance, puis présente le résultat avec un histogramme coloré et la direction de la tendance. Utilisez-le après votre signal d'entrée habituel, pas à sa place. Trois états du marché en un coup d'œil Histogramme vert avec tendance haussière : le
KT Momentum Arrows
KEENBASE SOFTWARE SOLUTIONS
KT Momentum Arrows marque les cassures de momentum haussières et baissières avec des flèches lorsqu'une bougie clôture au-delà de ses bandes de prix adaptatives. Les bandes réagissent à l'écart du prix et aux changements de volatilité. Une flèche bleue vers le haut confirme une clôture au-dessus de la bande supérieure, tandis qu'une flèche rouge vers le bas confirme une clôture sous la bande inférieure. Le signal est fixé après la clôture de la bougie, la flèche ne se déplace donc pas sur une au
KT COG Advanced MT4
KEENBASE SOFTWARE SOLUTIONS
1 (1)
KT COG is an advanced implementation of the center of gravity indicator presented by John F. Ehlers in the May 2002 edition of Technical Analysis of Stocks & Commodities magazine. It's a leading indicator which can be used to identify the potential reversal points with the minimum lag. The COG oscillator catches the price swings quite effectively. MT5 version of the same indicator is available here KT COG Advanced MT5 Calculation of COG The COG indicator is consist of the two lines. The main l
KT Pin Bar
KEENBASE SOFTWARE SOLUTIONS
KT Pin Bar identifies the pin bar formation which is a type of price action pattern which depicts a sign of reversal or rejection of the trend. When combined with support and resistance, BRN and other significant levels, Pin Bar pattern proved to be a very strong sign of reversal. Basically, a pin bar is characterized by a small body relative to the bar length which is closed either in upper or lower 50% part of its length. They have very large wicks and small candle body. A pin bar candlestic
KT Trend Magic
KEENBASE SOFTWARE SOLUTIONS
Lisez la direction de la tendance directement sur le graphique KT Trend Magic associe momentum et volatilité dans une ligne colorée qui suit le prix. La ligne donne une vue continue de l'état actif de la tendance et change de couleur lorsque la direction calculée se modifie. Ligne verte : indique un état de tendance haussier. Ligne rouge : indique un état de tendance baissier. Changement de couleur : marque une nouvelle transition directionnelle sur le graphique. Pendant un mouvement soutenu, la
KT Auto Fibo
KEENBASE SOFTWARE SOLUTIONS
Auto Fibonacci indicator that draws the Fibonacci retracement on the swing you are looking at, and redraws it the moment you zoom or scroll the chart. Zoom in on a pullback and the levels measure that pullback. Zoom out and they measure the whole trend. There are no anchor points to drag and no levels to redraw after every new high. Key features Measures the highest high and the lowest low on your screen, the current candle included. Follows zoom, scroll and window size at once, even when the ma
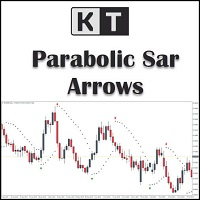
KT Psar Arrows
KEENBASE SOFTWARE SOLUTIONS
KT Psar Arrows trace des flèches sur le graphique en utilisant l'indicateur standard Parabolic SAR. Une flèche haussière est tracée lorsque le plus haut de la bougie touche le SAR. Une flèche baissière est tracée lorsque le plus bas de la bougie touche le SAR. Les signaux sont générés en temps réel sans attendre la clôture de la bougie.  Fonctionnalités Un outil utile pour les traders souhaitant expérimenter des stratégies de trading intégrant l'indicateur Parabolic SAR.  Peut être utilisé pour
KT Ichimoku Trader
KEENBASE SOFTWARE SOLUTIONS
1 (1)
Cinq stratégies Ichimoku tradées automatiquement KT Ichimoku Trader est un Expert Advisor qui ouvre et ferme des positions automatiquement avec cinq stratégies classiques d'Ichimoku Kinko Hyo. Vous activez les stratégies de votre choix, et chacune trade de façon indépendante : avec ses propres règles d'entrée, ses propres règles de sortie et au maximum une position ouverte par stratégie à la fois. Chaque entrée est vérifiée sur une bougie clôturée. À l'ouverture d'une nouvelle bougie, l'EA lit l
KT Volatility Oscillator
KEENBASE SOFTWARE SOLUTIONS
L'oscillateur de volatilité KT analyse les données de marché passées et actuelles à l'aide d'une formule mathématique pour afficher le résultat sous forme d'oscillateur. Les vagues croissantes et décroissantes correspondent respectivement à une volatilité élevée et faible de l'actif.  En résumé, la volatilité est simplement une mesure des fluctuations du prix d'un actif sur une certaine période de temps. Sans volatilité, il y aurait peu de mouvement sur le marché et les traders ne pourraient pas
KT COG Robot
KEENBASE SOFTWARE SOLUTIONS
KT COG Robot is a fully automated Expert Advisor based on the KT COG Indicator . The COG indicator was originally presented by John F. Ehlers in the May 2002 edition of Technical Analysis of Stocks & Commodities magazine. The EA fires a long trade when COG line cross above the signal line and a short trade is fired when the COG line cross below the signal line.  Adaptive Filtration Our adaptive filtration algorithm combines the original COG formula with the major trend direction and market acce
ACB Breakout Arrows EA
KEENBASE SOFTWARE SOLUTIONS
Automatisez le processus de cassure ACB ACB Breakout Arrows EA évalue les signaux de cassure sur le graphique actif et gère les opérations avec la logique intégrée d'ACB Breakout Arrows et d'ACB Trade Filter. Placez l'EA sur le symbole et l'unité de temps à surveiller, autorisez le trading automatique, puis choisissez les règles de position, de session, de filtre et de sortie adaptées à votre plan de test. Les indicateurs et composants nécessaires sont intégrés à l'EA, aucun téléchargement sépar
KT Asian Breakout
KEENBASE SOFTWARE SOLUTIONS
4 (1)
KT Asian Breakout carefully analyzes the range-bound market during the Asian session and then fires a long or short trade after doing some preassessment based on its inbuilt technical analysis module. The executed orders are closed within a day before the completion of the next day session. The inbuilt technical analysis module checks for the session range and compares it with the last 20 days price movement. If it finds any erratic price movement within the session, the orders are not executed
KT London Breakout
KEENBASE SOFTWARE SOLUTIONS
First thirty minutes are essential for a trading session. The early reaction of traders and market players sets a path for the rest of the day. KT London Breakout EA takes advantage of this phenomenon, and after analyzing the first thirty minutes of London session, it places two bidirectional pending orders. One of pending order is eventually canceled after realizing the market direction with certainty. It has been strictly tested and developed for EUR/JPY using 30-Min Time Frame. You can expe
KT Auto Support Resistance Levels : S&R multi-timeframe, Smart Zones et tableau de bord des niveaux pour MetaTrader 4/5 Sommets de swing. Pivots. Order blocks. Plus hauts et plus bas précédents. Chaque trader marque le marché à sa façon, et c’est souvent le graphique qui en paie le prix. Empilez trop de méthodes sur un seul écran et il cesse d’être une carte. Il devient du bruit. KT Auto Support Resistance Levels règle ce problème. L’indicateur analyse en même temps le mensuel, l’hebdomadaire, l
Currency strength and pair correlation in one indicator KT Currency Strength and Correlation ranks the eight major currencies from strongest to weakest and shows, in a colored matrix, how closely ten currency pairs of your choice move together. Before you open a trade from your own strategy, you can check whether the two currencies of the pair are really moving apart, and whether the new trade adds risk to a trade you already hold. What you see on the chart Strength lines: a separate window belo
MACD Divergence Seeker
KEENBASE SOFTWARE SOLUTIONS
KT MACD Divergence Seeker trades the regular and hidden divergence signals generated by our free indicator named KT MACD Divergence indicator. Trading the standalone divergences can be a risky affair that's why the KT MACD Divergence Seeker combines the standard divergence signals with an advanced analysis module to exploit the price inefficiencies on some FX pairs. What is the Divergence exactly? As a general conception if the price is making higher highs, then macd should also be making hig
KT Asian Breakout Indicator
KEENBASE SOFTWARE SOLUTIONS
Tracez la plage de la session asiatique KT Asian Breakout Indicator marque le plus haut et le plus bas d'une fenêtre de quatre heures de la session asiatique, puis surveille le prix une fois la plage terminée. Le paramètre GMT Offset aligne la session sur l'heure du serveur de votre courtier, tandis que Draw Session Box contrôle l'affichage de la plage. Visualisez ensemble la cassure et les niveaux de transaction Une flèche haussière apparaît lorsque le prix clôture au-dessus du plus haut de la
MACD Divergence MT4
KEENBASE SOFTWARE SOLUTIONS
KT MACD Divergence affiche les divergences régulières et cachées qui se forment entre le prix et l’oscillateur. Si votre stratégie de trading anticipe un retournement de tendance, vous pouvez utiliser la divergence MACD régulière pour repérer les points de retournement potentiels. Et si votre stratégie repose sur la continuité de la tendance, la divergence cachée du MACD sera plus appropriée. Limites de KT MACD Divergence Utiliser la divergence MACD comme unique signal d’entrée peut être risqu
KT Bollinger Bands Trader MT4
KEENBASE SOFTWARE SOLUTIONS
KT Bollinger Bands Trader est un Expert Advisor 100 % automatisé qui applique une stratégie de retour à la moyenne basée sur les bandes de Bollinger pendant les périodes de faible volatilité. Le prix réagit souvent sur la ligne supérieure ou inférieure des bandes, mais un retournement ne se produit pas systématiquement. Cependant, la probabilité d’un retournement est plus élevée lorsque la volatilité est faible. Entrées Un achat est déclenché lorsque le prix se positionne correctement sous la b
KT CCI Divergence MT4
KEENBASE SOFTWARE SOLUTIONS
KT CCI Divergence shows the regular and hidden divergence created between the price and CCI oscillator. Divergence is one of the vital signals that depicts the upcoming price reversal in the market. Manually spotting the divergence between price and CCI can be a hectic and ambiguous task. Limitations of KT CCI Divergence   Using the CCI divergence as a standalone entry signal can be risky. Every divergence can't be interpreted as a strong reversal signal. For better results, try to combine it w
KT Heiken Ashi Smoothed MT4
KEENBASE SOFTWARE SOLUTIONS
Suivez l'état Heiken Ashi lissé KT Heiken Ashi Smoothed transforme le mouvement du prix en bougies bleues et rouges lissées. Une flèche bleue vers le haut apparaît lorsque l'état passe de baissier à haussier, et une flèche rouge vers le bas lorsqu'il passe de haussier à baissier, ce qui rend les changements de direction faciles à repérer sur le graphique. La période et la méthode de lissage déterminent le niveau de lissage des bougies. Vous obtenez ainsi une vue plus stable que le Heiken Ashi st
KT MA Crossover MT4
KEENBASE SOFTWARE SOLUTIONS
KT MA Crossover affiche des flèches d'achat et de vente en fonction du croisement des moyennes mobiles sélectionnées. Il génère également les alertes appropriées et affiche la valeur MFE (Excursion la plus favorable) pour chaque signal successif. La stratégie de croisement des moyennes mobiles est l'une des techniques les plus utilisées par les traders dans le monde entier. Elle repose généralement sur une moyenne mobile rapide et une moyenne mobile lente pour détecter les signaux d'achat et de
KT Round Numbers MT4
KEENBASE SOFTWARE SOLUTIONS
KT Round Numbers plots the round number levels which are also commonly known as psychological levels in the Forex world. In the context of Forex trading, round number levels are those levels in which there are two or more zeroes at the end. They are named as 00 levels on the chart. Some traders also consider the halfway points as a valid round number level. They are named as 50 levels on the chart. Use of round number levels in trading Round number levels work as strong support and resistance
KT Inside Bar Advanced MT4
KEENBASE SOFTWARE SOLUTIONS
Despite the popularity of inside bar pattern among the traders, using it as a standalone signal doesn't provide any edge in the market. KT Inside Bar Advanced indicator solves this problem by combining the classic inside bar pattern with the "ECE" cycle and Fibonacci extensions. Using this indicator in place of our classic inside bar indicator will provide a tremendous advantage and edge in the market. What is the ECE cycle? In financial markets, the price never moves in a straight line but u
KT Inside Bar Hunter MT4
KEENBASE SOFTWARE SOLUTIONS
Despite the popularity of inside bar pattern among traders, using it as a standalone entry signal doesn't provide any evidentiary advantage. KT Inside Bar Hunter trades only selected inside bar patterns using some preassessment and ECE price action cycle. Trading Strategy On successful detection of the required pattern, EA places a pending order in the direction of the forecasted price expansion phase. Pending orders are canceled if they are not triggered within the next bar. Once triggered, ac
KT CCI Surfer MT4
KEENBASE SOFTWARE SOLUTIONS
KT CCI Surfer uses a mean reversion trading strategy with a combination of extreme overbought/oversold zone detection using the Commodity Channel Index (CCI). Developed by Donald Lambert in 1980, CCI is a leading indicator that helps to identify the overbought/oversold region in the market without any lag. Obviously, not every overbought/oversold signal turns out into a price reversal. However, when combined with a well-planned mean reversion strategy, it produces excellent results. Recommend
KT RSI Divergence Robot MT4
KEENBASE SOFTWARE SOLUTIONS
Trader les divergences RSI confirmées KT RSI Divergence Robot surveille les divergences régulières et cachées entre le prix et le Relative Strength Index sur le symbole et l'unité de temps du graphique. Les nouveaux signaux sont évalués après la clôture d'une bougie. Une divergence haussière peut ouvrir une position acheteuse, tandis qu'une divergence baissière peut ouvrir une position vendeuse. Lorsqu'un signal opposé apparaît, l'EA peut fermer les positions dans l'autre direction avant d'évalu
Filtrer:
Aucun avis
Répondre à l'avis