Fibonacci Trends Multi Timeframe
- Göstergeler
-
Elmira Memish
 Eliminate guesswork and build a sustainable, rule-based edge in global financial markets through mathematical, systemic, and algorithmic approaches.
What We Cover:
📊 Daily Market Prep: Pre-market analysis before London/NY sessions (S&P 500, Nasdaq, Gold, Forex). - Sürüm: 1.0
- Etkinleştirmeler: 10
Fibonacci Trend Multi Timeframe
A NEW INDICATOR EITHER FOR THE BEGINNERS OR PROFESSIONALS.
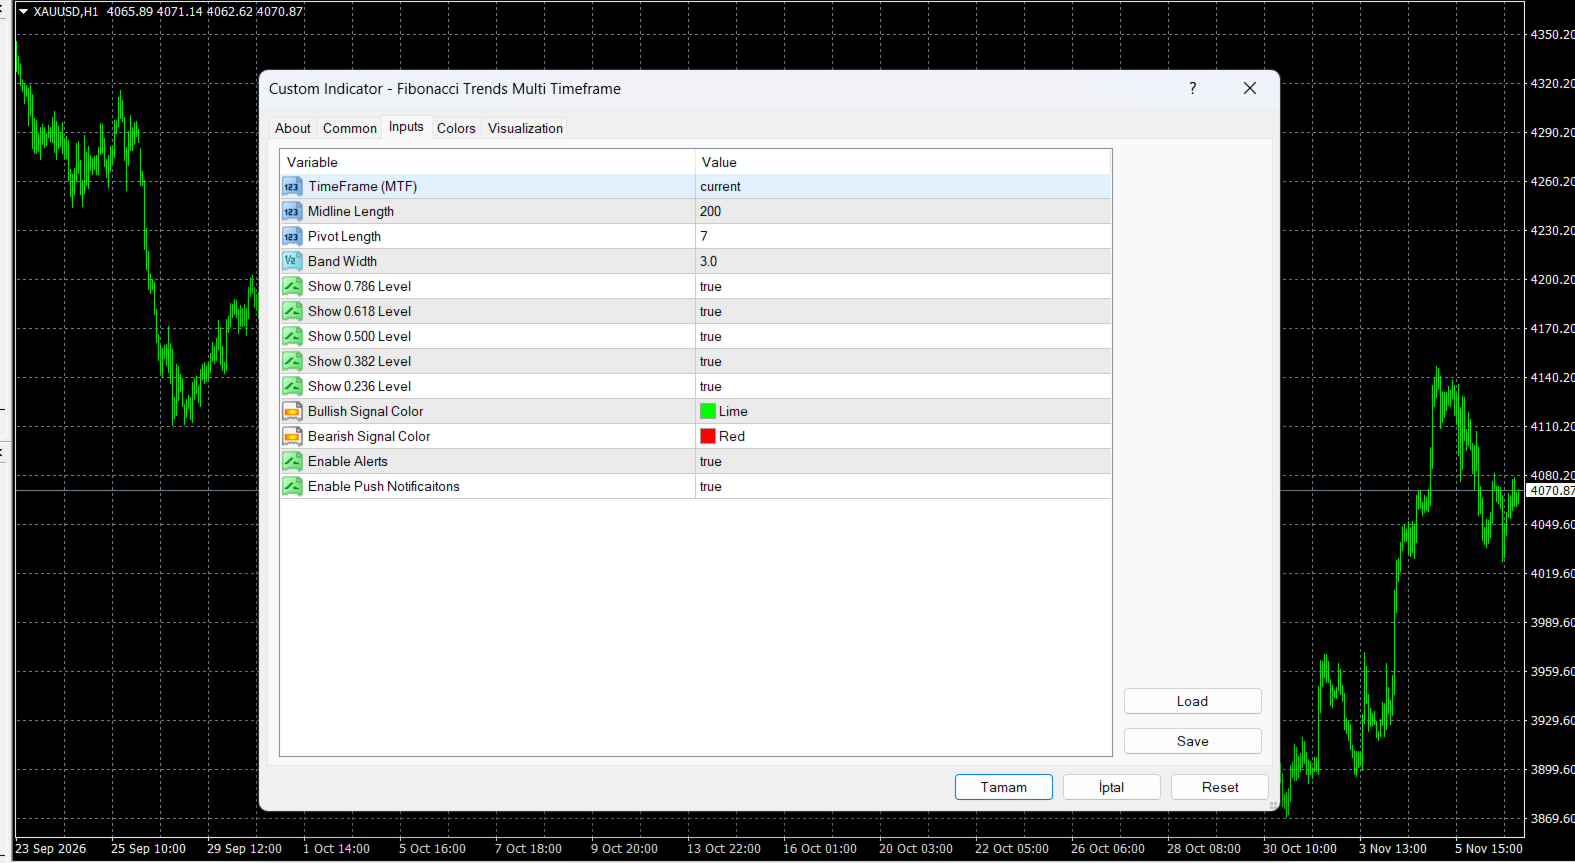
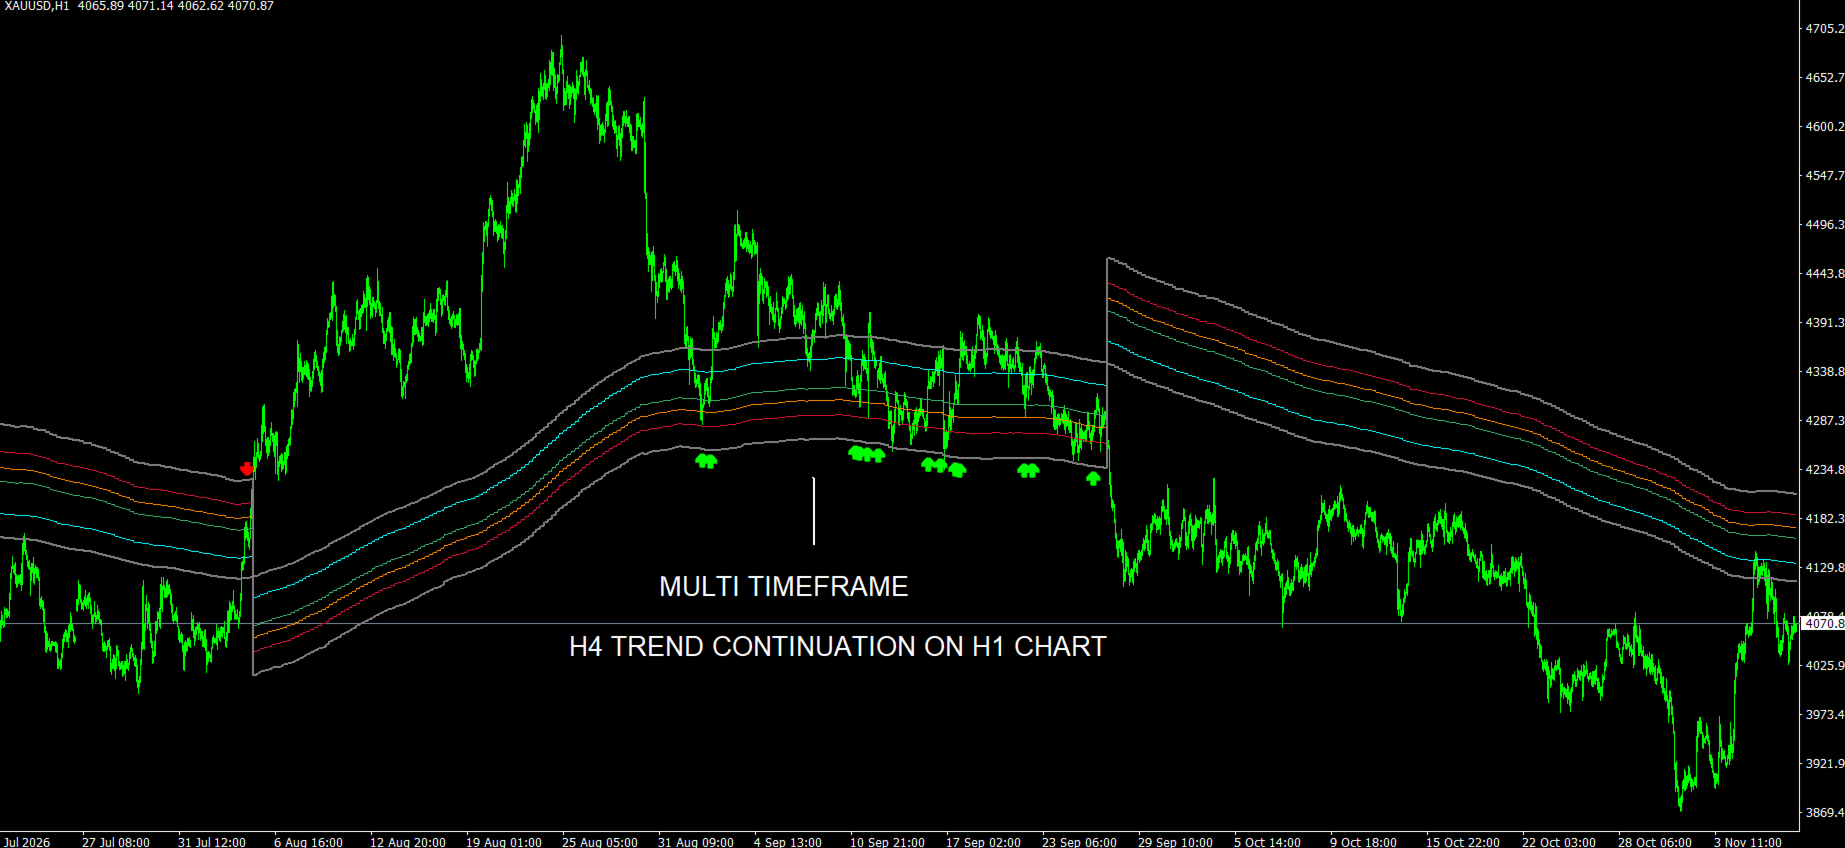
This indicator supports Multi-Timeframe analysis. This way, for example, while viewing a 1-hour (H1) chart, you can calculate the Fibonacci trend and levels from a 4-hour (H4) or Daily timeframe in the background and receive signals accordingly.
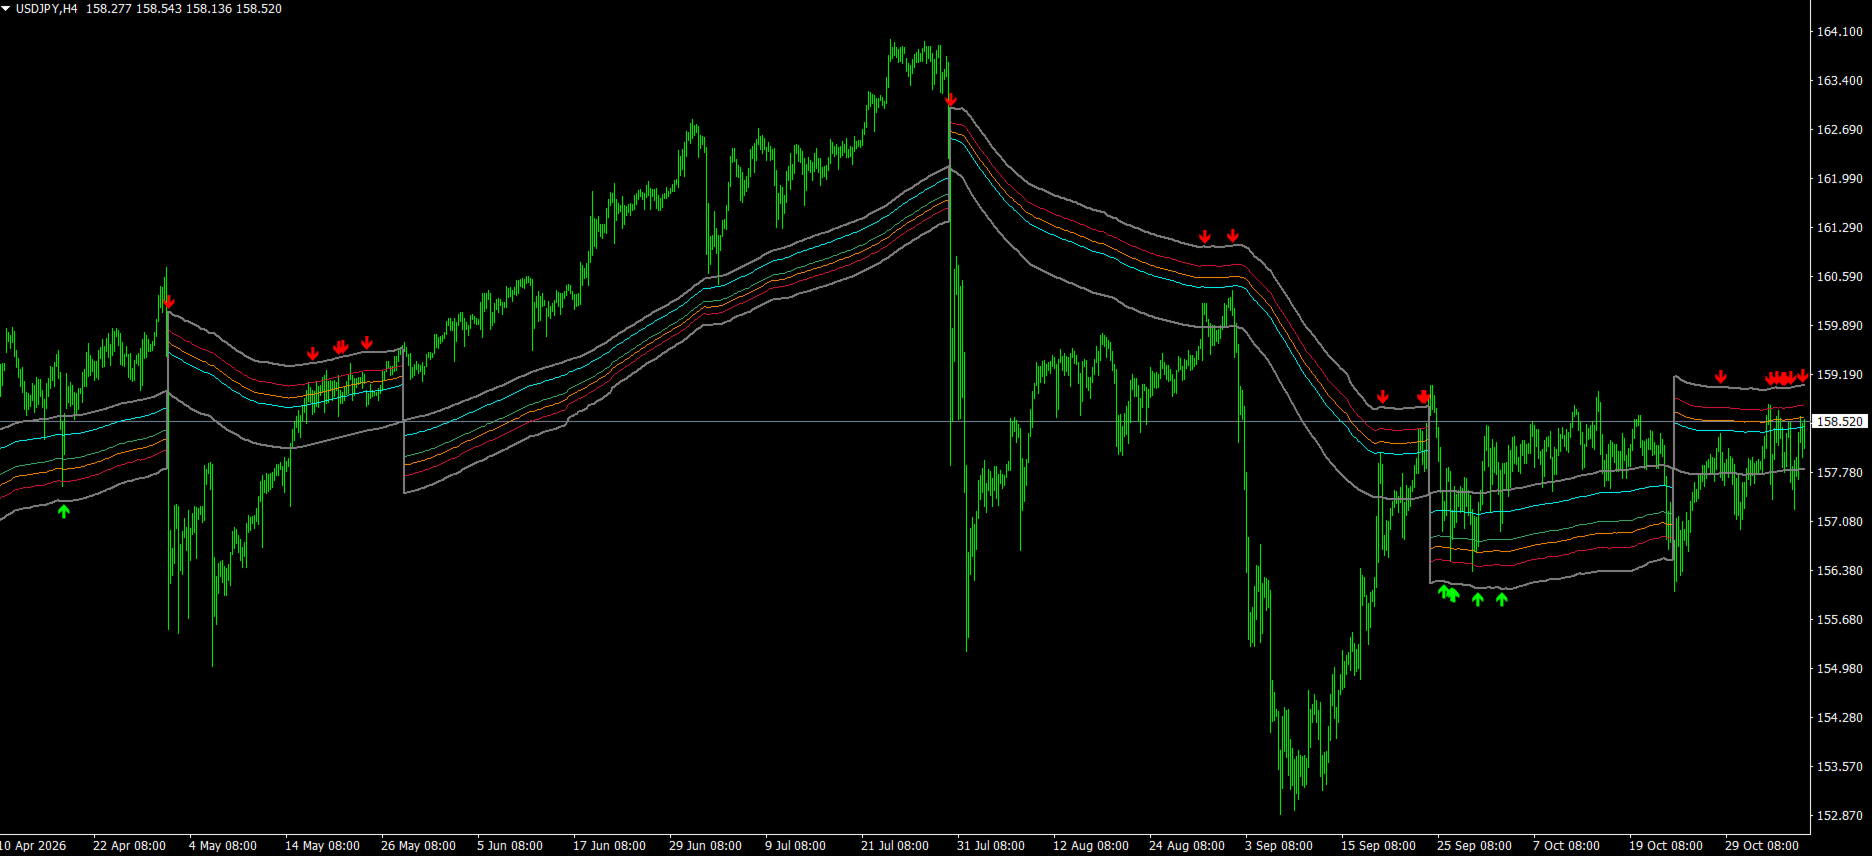
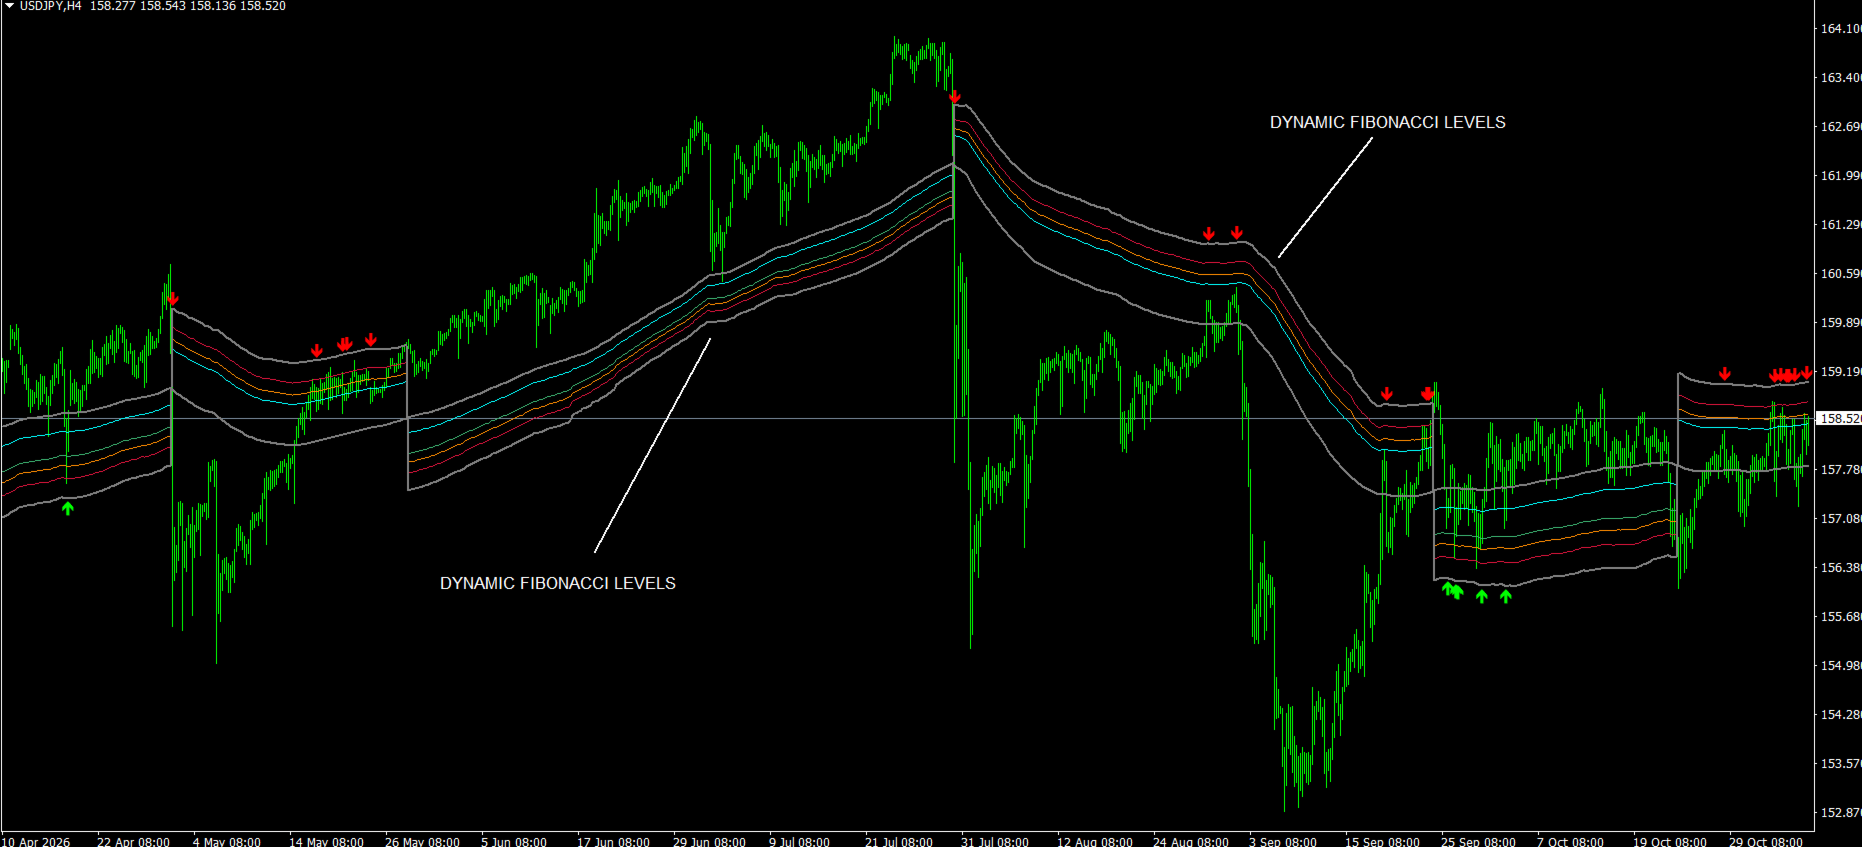
Indicator shows Fibonacci retracement levels inside an adaptive trend structure. It combines a smoothed price midline, volatility-based outer bands, and Fibonacci ratios to show where price is trading within the current bullish or bearish trend range.
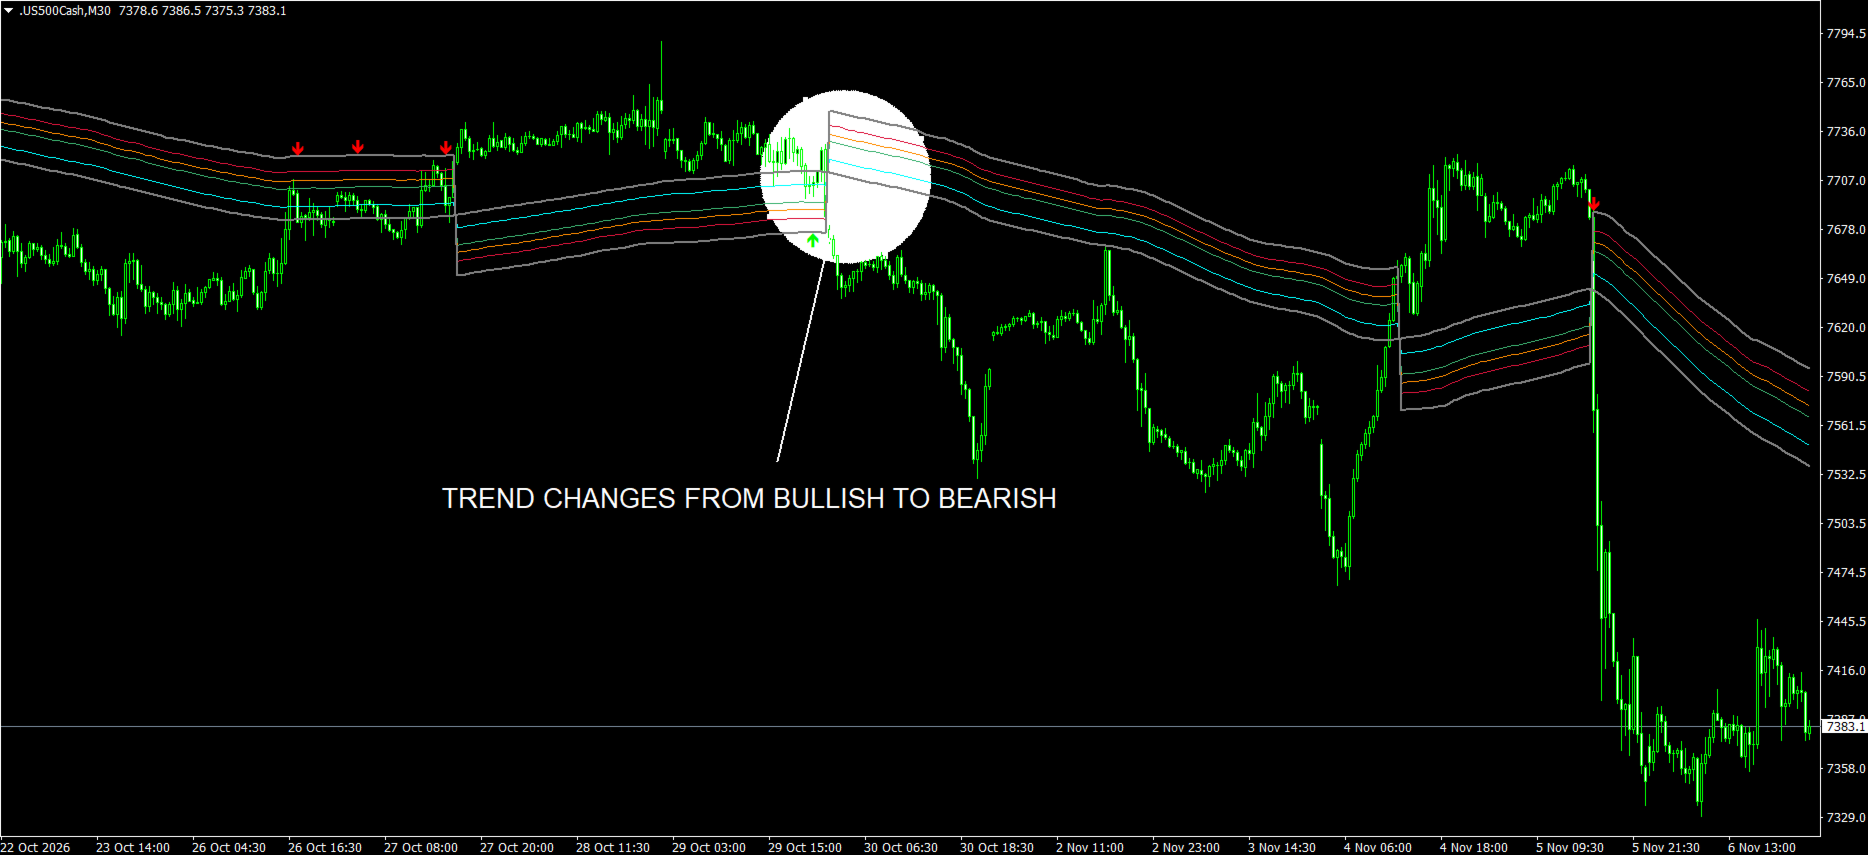
The trend changes only when price moves beyond a volatility-adjusted outer band . Once a direction is active, the script projects 0.236, 0.382, 0.500, 0.618, and 0.786 levels between the active outer band and the midline . This creates a moving Fibonacci framework that adjusts as price and volatility change .
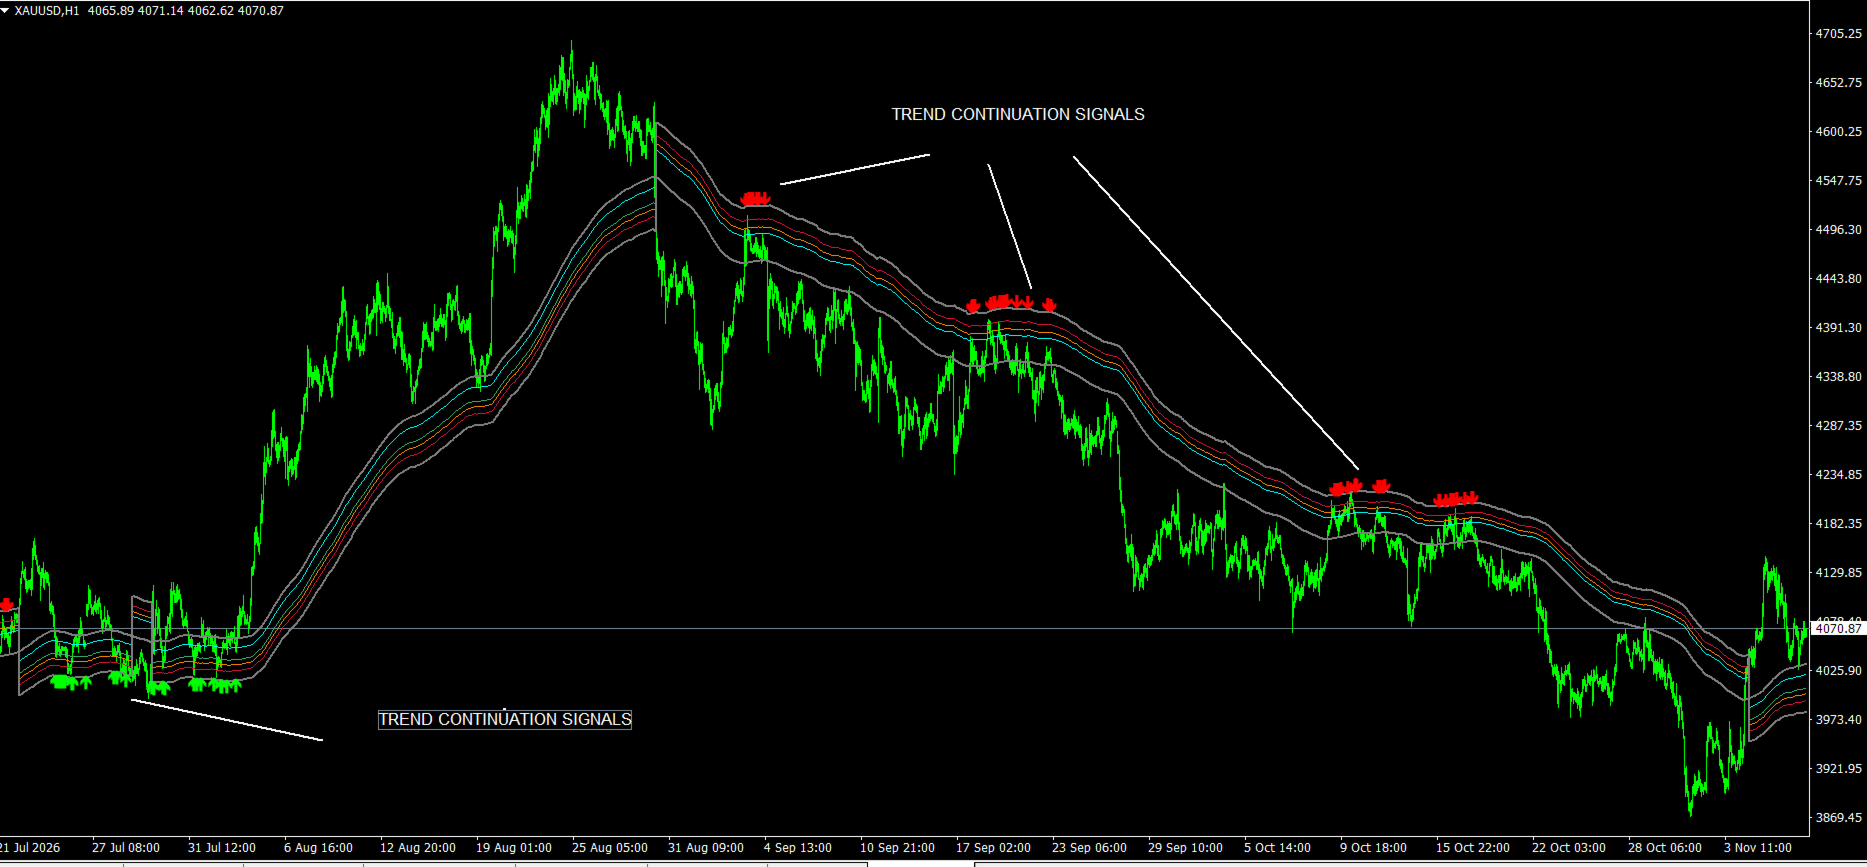
Continuation signals appear when price closes back through an enabled Fibonacci level in the direction of the active trend. This lets traders use retracements within an established trend instead of treating each Fibonacci level as a fixed reversal point.
It displays 5 configurable Fibonacci Levels between the volatility band and trend midline.
It marks the Fibo structure when a new trend begins.
HOW TO USE:
Identify the active trend structure — A bullish structure projects Fibonacci levels from the lower band toward the midline, while a bearish structure projects them from the upper band toward the midline.
Watch price during a retracement — Use the displayed Fibonacci zones to see how far price has moved through the active trend range.
Look for continuation signals — An upward triangle shows that price crossed above an enabled Fibonacci level during a bullish trend. A downward triangle shows the equivalent bearish close below a level.
Compare signals with price structure — Use nearby swing points, support, resistance, or your existing confirmation method before acting on a continuation signal. Adjust Midline Length, Pivot Length, and Band Width to control how quickly the trend framework responds to price and how wide its outer boundaries are.
Enable or disable individual Fibonacci levels to keep only the retracement levels relevant to your method
You can use this indicator either on its own or as a supporting tool within the strategy I developed for my best-selling Cycle Sniper indicator