SignalX Daily Range Envelope

What this is

Every symbol has a typical day. When a symbol has already travelled most of that distance, the rest of the day usually holds less, and a breakout strategy that works on a fresh day can stall on a spent one. This indicator measures the average daily range from history and projects half, three quarters and all of it above and below today open, so the scale of the current move is obvious at a glance.

What it does

Measures the average daily range over N days and projects 50%, 75% and 100% of it up and down from today's open as nested bands.

  • Puts today's travel on the same scale as a typical day for that symbol, so 'the move is already spent' becomes measurable instead of a feeling.
  • Runs on a single chart; it does not need to be the chart you trade from.
  • No DLL calls. No external services. No network requests.
  • No account, terminal, symbol or time limitation is embedded.

Inputs

Input Type Default
InpDays int 14
InpUseMedian bool false
InpUseToday bool false
InpDraw15 bool true
InpDraw20 bool true
InpDraw30 bool true
Inp50Color color C'70,80,96'
Inp75Color color C'232,181,75'
Inp100Color color clrTomato
InpShowLabel bool true

How to use it

  1. Attach the EA to a chart of the symbol you trade.
  2. Set the inputs to match your own risk approach. Defaults are deliberately conservative.
  3. Allow live trading in the Expert Advisors settings for this EA.
  4. Test on a demo account first. That is not a formality; the defaults are not tuned to your broker.

Notes

  • Written for MetaTrader 4, any broker, any account currency. Sizing maths uses the symbol's own tick value.
  • Works alongside other EAs, including with a magic number you choose, so it will not fight them for orders it does not own.
  • It performs management and measurement only; it does not generate trading signals.

Honest limits

  • This is a tool, not a strategy. It does not predict anything and it cannot make a losing method profitable.
  • No performance figures are published for it because tools of this kind do not have a meaningful backtest curve of their own.
  • If your broker quotes oddly (very wide spreads, non-standard tick values) verify the sizing on a demo account before using real funds.

Trading involves risk of loss. Nothing here is financial advice.

Önerilen ürünler
VR Cub
Vladimir Pastushak
VR Cub , yüksek kaliteli giriş noktaları elde etmenin bir göstergesidir. Gösterge, matematiksel hesaplamaları kolaylaştırmak ve bir pozisyona giriş noktalarının aranmasını basitleştirmek için geliştirildi. Göstergenin yazıldığı ticaret stratejisi uzun yıllardan beri etkinliğini kanıtlamaktadır. Ticaret stratejisinin basitliği, acemi yatırımcıların bile başarılı bir şekilde ticaret yapmasına olanak tanıyan büyük avantajıdır. VR Cub, pozisyon açılış noktalarını ve Kâr Al ve Zararı Durdur hedef sev
"Auto FIBO Pro" Crypto_Forex göstergesi - ticarette harika bir yardımcı araçtır! - Gösterge, Fibo seviyelerini ve yerel trend çizgilerini (kırmızı renk) otomatik olarak hesaplar ve grafikte yerleştirir. - Fibonacci seviyeleri, fiyatın tersine dönebileceği önemli alanları gösterir. - En önemli seviyeler %23,6, %38,2, %50 ve %61,8'dir. - Ters scalping veya bölge ızgara ticareti için kullanabilirsiniz. - Auto FIBO Pro göstergesini kullanarak mevcut sisteminizi geliştirmek için birçok fırsat vardır
Price Magnet — Price Density and Attraction Levels Indicator Price Magnet is a professional analytical tool designed to identify key support and resistance levels based on statistical Price Density. The indicator analyzes a specified historical period and detects price levels where the market spent the most time. These zones act as “magnets,” attracting price action or forming a structural base for potential reversals. Unlike traditional Volume Profile tools, Price Magnet focuses on price-time d
Quantum Falcon Signal Free is a smart visual trading indicator for MetaTrader 4 designed for Forex and Gold traders. The indicator combines: • Trend analysis • RSI momentum confirmation • MACD momentum filtering • ATR volatility filtering • Higher timeframe confirmation • Smart exit signal detection Main Features: • Smart Buy and Sell signals • Exit Buy / Exit Sell alerts • Real-time dashboard on chart • Professional candle arrows • Multi-timeframe trend confirmation • ATR market volatility filt
FREE
Indicator for binary options arrow is easy to use and does not require configuration works on all currency pairs, cryptocurrencies buy signal blue up arrow sell signal red down arrow tips do not trade during news and 15-30 minutes before their release, as the market is too volatile and there is a lot of noise it is worth entering trades one or two candles from the current period (recommended for 1 candle) timeframe up to m 15 recommended money management fixed lot or fixed percentage of the depo
Binary Options Assistant (BOA) ICE Signals Indicator provides signals based on gkNextLevel Binary Options Strategy.  Indicators: 2 Bollinger Bands & Stochastic Stop missing trades, stop jumping from chart to chart looking for trade set-ups and get all the signals on 1 chart! U se any of the BOA Signals Indicator with the  Binary Options Assistant (BOA) Multi Currency Dashboard .   All BOA Signal Indicator settings are adjustable to give you more strategy combinations. The signals can be seen
FREE
Smoothed Heiken Ashi with AC/AO Zones – Professional Trading Clarity Transform your Heiken Ashi analysis with intelligent smoothing that eliminates noise while preserving actionable signals. What Makes This Different? This isn't just another Heiken Ashi indicator. We've engineered a sophisticated smoothing engine that works with the Accelerator (AC) and Awesome Oscillator (AO) zone logic to give you cleaner entries and exits without sacrificing responsiveness. Four Smoothing Methods at Your Comm
"Dinamik Scalping Osilatörü" - gelişmiş, özel bir Kripto-Forex göstergesi - MT4 için verimli bir işlem aracı! - Yeni nesil Osilatörler - nasıl kullanılacağını görmek için resimlere bakın. - Dinamik Scalping Osilatörü, uyarlanabilir Aşırı Satış/Aşırı Alım bölgelerine sahiptir. - Osilatör, dinamik Aşırı Satış/Aşırı Alım bölgelerinden kesin giriş noktalarını bulmak için yardımcı bir araçtır. - Aşırı Satış değerleri: Yeşil çizginin altında, Aşırı Alım değerleri: Turuncu çizginin üzerinde. - Bu göst
Royal Dutch Skunk
Sayan Vandenhout
ROYAL DUTCH SKUNK USES THE TREND WAVE INDICATOR AND IT CAN IDENTIFY THE BEGINNING AND THE END OF A NEW WAVE TREND MOVEMENT. AS AN OSCILLATOR, THE INDICATOR IDENTIFIES THE OVERBOUGHT AND OVERSOLD ZONES. IT WORKS GREAT TO CATCH THE SHORT TERM PRICE REVERSALS AND USES A MARTINGALE STRATEGY TO CLOSE ALL TRADES IN PROFIT. USE DEFAULT SETTINGS ON H1 OR HIGHER TIME FRAME ON ANY PAIR FOR MORE ACCURATE TRADES WHY THIS EA : Smart entries calculated by 6 great strategies The EA can be run on even a $20000
Berg Supertrend
Mark Thimoty Evangelista
BERG Supertrend Indicator  Developed by Berg Traders   New Telegram Channel for updates:  https://t.me/berg_traders Overview The Berg Supertrend indicator is a custom technical analysis tool that helps traders identify potential trend reversals and market trends based on the Average True Range (ATR) and price movements. Designed for versatility and user-friendliness, the indicator offers a range of customization options, including notification settings for desktop, email, and mobile alerts. Key
FREE
Trend PA
Mikhail Nazarenko
5 (3)
The Trend PA indicator uses   Price Action   and its own filtering algorithm to determine the trend. This approach helps to accurately determine entry points and the current trend on any timeframe. The indicator uses its own algorithm for analyzing price changes and Price Action. Which gives you the advantage of recognizing, without delay, a new nascent trend with fewer false positives. Trend filtering conditions can be selected in the settings individually for your trading style. The indicator
Forex Gump
Andrey Kozak
2.4 (5)
Forex Gump is a fully finished semi-automatic trading system. In the form of arrows, signals are displayed on the screen for opening and closing deals. All you need is to follow the instructions of the indicator. When the indicator shows a blue arrow, you need to open a buy order. When the indicator shows a red arrow, you need to open a sell order. Close orders when the indicator draws a yellow cross. In order to get the most effective result, we recommend using the timeframes H1, H4, D1. There
"Dinamik İşlem Osilatörü" - gelişmiş, özel bir Kripto-Forex göstergesi - MT4 için verimli bir işlem aracı! - Yeni nesil Osilatörler - nasıl kullanılacağını görmek için resimlere bakın. - Dinamik İşlem Osilatörü, uyarlanabilir Aşırı Satış/Aşırı Alım bölgelerine sahiptir. - Osilatör, dinamik Aşırı Satış/Aşırı Alım bölgelerinden kesin giriş noktalarını bulmak için yardımcı bir araçtır. - Aşırı Satış değerleri: Mavi çizginin altında, Aşırı Alım değerleri: Kırmızı çizginin üzerinde. - Bu gösterge, F
Gvs Undefeated Trend   indicator is designed for trend and signal trading. This indicator generates trend signals.  It uses many algorithms and indicators to generate this signal. It tries to generate a signal from the points with the highest trend potential. This indicator is a complete trading product. This indicator does not need any additional indicators.  You can only trade with this indicator. The generated signals are displayed on the graphical screen.  Thanks to the alert features you ca
The indicator displays the data of the Stochastic oscillator from a higher timeframe on the chart. The main and signal lines are displayed in a separate window. The stepped response is not smoothed. The indicator is useful for practicing "manual" forex trading strategies, which use the data from several screens with different timeframes of a single symbol. The indicator uses the settings that are identical to the standard ones, and a drop-down list for selecting the timeframe. Indicator Paramet
This tool was developed and designed for binary options trading It has been noticed that it can also be used in stock markets and forex. There are 2 options for trading binary options using this indicator Option 1 We open a deal on the next candle after a signal for one cut of the current period Buy or Sell depending on the signal The blue up arrow is Buy The red down arrow is Sell / We enter only on the first signal on the next candle and ignore the rest / Option 2 We enter on a signal for the
"Ayarlanabilir Fraktallar" - fraktal göstergesinin gelişmiş bir versiyonudur, çok kullanışlı bir ticaret aracıdır! - Bildiğimiz gibi Standart fraktallar MT4   göstergesinin hiç ayarı yoktur - bu, yatırımcılar için çok elverişsizdir. - Ayarlanabilir Fraktallar bu sorunu çözmüştür - gerekli tüm ayarlara sahiptir: - Göstergenin ayarlanabilir periyodu (önerilen değerler - 7'nin üzerinde). - Fiyatın Yüksek/Düşük noktalarına ayarlanabilir mesafe. - Fraktal oklarının ayarlanabilir tasarımı. - Gösterge
MT4 için Crypto_Forex Göstergesi "Ağırlıklı Rsi Cci Stoch Osilatörü", Yeniden Boyama Yok. - Bu benzersiz gösterge 3'ü 1 arada birleştiriyor: Hesaplama için RSI, CCI ve Stokastik! - Bu yazılımla hassas momentum ticareti fırsatları - resimlerdeki örneklere bakın. - Gösterge 3 çizgiden oluşur: - Ağırlıklı Rsi Cci Stoch Osilatörünün kendisi (Mavi renk); - Osilatörün hızlı MA'sı (Sarı renk); - Osilatörün yavaş MA'sı (Kırmızı renk); - 50'nin üzerindeki bölge - aşırı alım bölgesi (Orada SATIN ALMAYIN)
NQX Session Range Breakout MT4, MetaTrader 4 için bir sinyal göstergesidir: Avrupa açılışında gece aralığının kırılımı. Sakin gece aralığını belirleyen ve Avrupa penceresinde bu aralığın dışındaki ilk kararlı kapanışta sinyal veren özel NQX mantığı. Önerilen girişi, kısa bir stopu ve uzak hedefleri (3:1, 5:1, 10:1) çizer; kararı siz verirsiniz. Grafikte neler çizer - Kapanmış sinyal mumunun üzerinde bir ok (kapanmış bir sinyali asla yeniden çizmez). - Önerilen giriş, kısa bir stop ve uzak bir ön
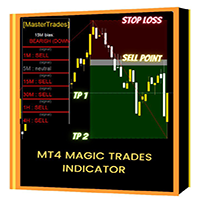
Introducing the "Magic Trades" for MetaTrader 4 – your ultimate tool for precision trading in dynamic markets. This innovative indicator revolutionizes the way you perceive market trends by harnessing the power of advanced analysis to detect subtle changes in character, paving the way for optimal trading opportunities. The Magic Trades Indicator is designed to empower traders with insightful entry points and well-defined risk management levels. Through its sophisticated algorithm, this indicato
Trend Osilatörü - gelişmiş bir özel Crypto_Forex göstergesi, etkili bir ticaret aracıdır! - Gelişmiş yeni hesaplama yöntemi kullanılır - "Hesaplama için fiyat" parametresi için 20 seçenek. - Şimdiye kadar geliştirilen en akıcı osilatör. - Yükselen trendler için yeşil renk, düşen trendler için kırmızı renk. - Aşırı satım değerleri: 5'in altında, Aşırı alım değerleri: 95'in üzerinde. - Bu göstergeyle standart stratejileri bile yükseltmek için birçok fırsat vardır. - PC ve Mobil uyarılarla. Yüksek
Binary Options Support Resistance Indicator This indicator is designed for binary options trading and effectively shows retracements from support and resistance levels. Signals appear on the current candle. A red arrow pointing downwards indicates a potential selling opportunity, while a blue arrow pointing upwards suggests buying opportunities. All that needs adjustment is the color of the signal arrows. It is recommended to use it on the M1-M5 timeframes as signals are frequent on these timef
Magical Arrow
Ranguni Abdulsamir Abdulmajid
Magical Arrow Indicator – Clear & Reliable Signals The Magical Arrow Indicator is a non-repainting, trend-following tool that gives you crystal-clear Buy and Sell signals . It  high-probability reversals and entries . No more guesswork – just follow the arrows on your chart! The Magical Arrow Indicator is a powerful, easy-to-use trading tool that helps you catch the most profitable Buy and Sell opportunities in the Forex market. It is designed for beginners and professional traders , giving you
[ZhiBiCCI] indicators are suitable for all cycle use, and are also suitable for all market varieties. [ZhiBiCCI] Green solid line is a reversal of bullish divergence. The green dotted line is a classic bullish divergence. [ZhiBiCCI] The solid line to the red is a reverse bearish divergence. The red dotted line is a classical bearish divergence. [ZhiBiCCI] can be set in the parameters (Alert, Send mail, Send notification), set to (true) to send instant signals to the alarm window, email, insta
Super Reversal Pattern
Parfait Mujinga Ndalika
Super Reversal Pattern Indicator Unlock the power of advanced pattern recognition with our Super Reversal Pattern Indicator. Designed for traders seeking precision and reliability, this indicator identifies one of the most effective reversal patterns in technical analysis, offering a significant edge in your trading strategy. Key Features: Non-Repainting Accuracy: Enjoy the confidence of non-repainting technology. Once a Super Reversal Pattern is detected, it remains static, providing consiste
Alpha Trend
Evgeny Belyaev
3 (4)
Alpha Trend is a trend indicator for the MetaTrader 4 platform; it has been developed by a group of professional traders. The Alpha Trend indicator finds the most probable tendency reversal points, which allows making trades at the very beginning of a trend. This indicator features notifications, which are generated whenever a new signal appears (alert, email, push-notification). This allows you to open a position in a timely manner. Alpha Trend does not redraw, which makes it possible to evalua
Rainbow Price Visualizer v1.21 See where the market really breathes. Turns your MT4 chart into an ultra-precise heatmap that highlights price zones favored by big players. Why it matters 300 price levels at 0.2‑pip resolution — microscopic detail. 8 visual themes (Rainbow, Fire, Ocean…) for instant readibility. Smart opacity: low noise fades, real zones pop. Lightweight rendering with automatic cleanup. Fully customizable: saturation, opacity, resolution, history depth. Bands project into the f
PipFinite Breakout EDGE
Karlo Wilson Vendiola
4.93 (488)
The Missing Edge You Need To Catch Breakouts Like A Pro. Follow a step-by-step system that detects the most powerful breakouts! Discover market patterns that generate massive rewards based on a proven and tested strategy. Unlock Your Serious Edge Important information here www.mql5.com/en/blogs/post/723208 The Reliable Expert Advisor Version Automate Breakout EDGE signals using "EA Breakout EDGE" Click Here Have access to the game changing strategy that will take your trading to the next l
Smart FVG Indicator MT4 – MetaTrader 4 için Gelişmiş Fair Value Gap Tespiti Smart FVG Indicator MT4, MetaTrader 4 grafikleri üzerinde Fair Value Gap (FVG) alanlarını profesyonel düzeyde tespit eder, izler ve uyarılar üretir. ATR tabanlı filtreleme ile piyasa yapısını dikkate alan akıllı bir algoritmayı birleştirerek gürültüyü azaltır, likiditeye uyum sağlar ve sadece en önemli dengesizlikleri bırakarak daha net işlem kararları almanıza yardımcı olur. Başlıca avantajlar Doğru FVG tespiti: Sadec
FREE
Trend Meter
Mahmud Hisso
5 (1)
MetaTrader 4 için çoklu döviz trend analiz göstergesi; birden fazla zaman diliminde trend yönünü ve trend gücünü görselleştirir. Yalnızca analiz amaçlıdır.  TREND METER – ÇOKLU DÖVİZ TREND ANALİZ GÖSTERGESİ (MT4) Trend Meter, birden fazla zaman dilimi ve sembolde trend yönünü, trend gücünü ve trend uyumunu görselleştirmek için tasarlanmış teknik bir trend analiz göstergesidir. Gösterge görsel analiz amaçlıdır ve otomatik olarak işlem açmaz.  Konsept Piyasa trendleri zaman dilimlerine ve enstrüma
Bu ürünün alıcıları ayrıca şunları da satın alıyor
Trend SniperX MT4
Sarvarbek Abduvoxobov
5 (5)
Trend Sniper X , işlemcilerin trend yönünü ve olası dönüş noktalarını netlik ve hassasiyetle belirlemelerine yardımcı olan MetaTrader 5 için çoklu zaman dilimli bir trend takip göstergesidir. MT5 İçin: https://www.mql5.com/en/market/product/181101 Fiyat Bilgisi: Mevcut fiyat tanıtım amaçlıdır ve gelecek güncellemeler ile yeni özellikler eklendikçe değişebilir. Code2Profit Kanalı Çoklu Zaman Dilimi Analizi ile Piyasaya Hakim Olun! Trend Sniper X ile Kazanma Oranınızı Nasıl En Üst Düzeye Çıkarırsı
Scalper Vault
Oleg Rodin
5 (40)
Scalper Vault, gün içi işlemlerde istikrar yakalamak isteyen yatırımcılar için tasarlanmış, güçlü ve tam donanımlı bir alım satım sistemidir. Bu yüksek hassasiyetli gösterge; hem Forex hem de İkili Opsiyon yatırımcıları için kurumsal düzeyde analizler sunan, bağımsız ve eksiksiz bir alım satım sistemi işlevi görür. SATIN ALIM İŞLEMİNDEN SONRA BENİMLE İLETİŞİME GEÇİN; ALIM SATIM İPUÇLARIMI VE HARİKA BİR BONUSU ALIN! Tahmin yürütme zorunluluğunu ve karmaşık manuel analiz süreçlerini ortadan kaldır
PRO Renko Sistemi, RENKO grafikleri ticareti için özel olarak tasarlanmış son derece hassas bir ticaret sistemidir. Bu, çeşitli ticaret araçlarına uygulanabilen evrensel bir sistemdir. Sistemi etkin piyasa sana doğru ters sinyallerine erişim hakkı denilen ses nötralize eder. Göstergenin kullanımı çok kolaydır ve sinyal üretiminden sorumlu tek bir parametreye sahiptir. Aracı, seçtiğiniz herhangi bir ticaret aracına ve renko çubuğunun boyutuna kolayca uyarlayabilirsiniz. Yazılımımla karlı bir
SR Liquidity
Oleg Rodin
5 (2)
SR Liquidity , piyasa likiditesinin yoğunlaştığı ve fiyatın en güçlü tepkiyi verdiği gizli bölgeleri ortaya çıkarmak için tasarlanmış bir alım-satım göstergesidir. Bu özel likidite alanları güçlü destek ve direnç seviyeleri işlevi görerek, piyasanın yön değiştirme ihtimalinin en yüksek olduğu yerlere dair size net bir harita sunar. SR Liquidity, sıradan Destek/Direnç çizgileri çizmek yerine, alım ve satım baskısının yoğunlaştığı bölgeleri tespit etmek için gerçek fiyat hareketlerini analiz eder.
Atomic Analyst
Issam Kassas
5 (14)
Atomic Analyst — MetaTrader 4 Ürün soruları, kurulum rehberliği veya teknik destek için bana doğrudan MQL5 üzerinden mesaj gönderin. İndikatör, karmaşık piyasa hesaplamalarını basit görsel sinyallere, renk kodlu mumlara, trend okumalarına, stop-loss seviyelerine ve traderların hızlıca anlayıp gerçek piyasa koşullarında kullanabileceği çoklu take-profit bölgelerine dönüştürür. Ana trading kullanım alanları: Scalping ve gün içi işlem: Hızlı karar alma, net oklar, uyarılar, mum renkleri ve yapılan
M1 Sniper
Oleg Rodin
4.97 (30)
M1 SNIPER kullanımı kolay bir işlem göstergesi sistemidir. M1 zaman dilimi için tasarlanmış bir ok göstergesidir. Gösterge, M1 zaman diliminde scalping için bağımsız bir sistem olarak kullanılabilir ve mevcut işlem sisteminizin bir parçası olarak kullanılabilir. Bu işlem sistemi özellikle M1'de işlem yapmak için tasarlanmış olsa da, diğer zaman dilimleriyle de kullanılabilir. Başlangıçta bu yöntemi XAUUSD ve BTCUSD ticareti için tasarladım. Ancak bu yöntemi diğer piyasalarda işlem yaparken de ya
SIO Oscillator: Kendi Kendini Optimize Eden Yarı Varyans Dengesizlik Osilatörü İndikatörü satın alın, ona dayalı Uzman Danışmanı (EA) ÜCRETSİZ edinin. Çoğu osilatör, tüm fiyat hareketlerini aynı şekilde değerlendirir. SIO ise yükseliş ve düşüş baskısını birbirinden ayırır ve aralarındaki dengesizliği ölçerek piyasayı gerçekte kimin kontrol ettiğini gösterir: alıcılar mı, satıcılar mı. Dengesizlik bir uç noktaya ulaştığında SIO, giriş, Stop Loss ve Take Profit seviyeleriyle birlikte net bir sinya
Quant Direction
Georgios Kalomoiropoulos
Quant Direction, 3 boyutlu bir piyasa analiz aracıdır. Çeşitli parametrelerdeki yüzdesel sapmaları hassas bir şekilde hesaplayan, tamamen objektif, algoritma tabanlı piyasa analizi sunar. Gelişmiş yapay zeka tabanlı modelleme araçları kullanılarak geliştirilen ve titizlikle test edilen bu algoritma, piyasayı benzersiz bir hassasiyetle analiz eder. Platformda herhangi bir döviz çiftini veya finansal enstrümanı analiz edebilirsiniz. İster kısa vadeli, ister günlük, isterse swing trading yapın, Qua
AW Prime Oscillator
AW Trading Software Limited
5 (1)
İki osilatörün birleşimi. Birincisi giriş noktalarını, ikincisi ise mevcut trendi gösterir. Gösterge, osilatör sinyallerini iki modda oklarla görüntüleyebilir; tüm hızlı osilatör sinyalleri veya yalnızca mevcut trend yönündeki sinyaller. Çok zaman dilimli bir panele ve üç tür sinyal bildirimine sahiptir. Faydalar: Günlük ve scalping ticaretine uygundur Trend filtreleme Basit ve hassas kurulum Çoklu zaman dilimi paneli Bir danışmana entegrasyona uygundur. Herhangi bir sembol ve herhangi bir zaman
Tokyo mt4 Indicator
Vasiliy Strukov
5 (9)
Tokyo Indicator; trend yönü, potansiyel işlem sinyalleri ve piyasa koşulları hakkında net ve görsel bir genel bakış sunar. Renk kodlu ve kademeli trend çizgisi, yükseliş evrelerini (mavi) düşüş evrelerinden (macenta) ayırt eder. Trend değiştiğinde, buna karşılık gelen yön okları potansiyel alım ve satım fırsatlarını vurgular. Entegre bir panel; mevcut sinyali, piyasa eğilimini, momentumu, volatiliteyi ve sinyal kalitesini tek bir kullanışlı görünümde bir araya getirir. Bu sayede yatırımcılar, f
Hidden Cycles
Lev Vladimirovic Marushkin
5 (1)
The Only 100% Universal Tool! Stop trading against nature! This is your chance to secure the only indicator rooted in the absolute laws that govern the entire universe. Most tools guess—this one reveals the truth. Buy another toy or buy the truth. Your choice... Based on Universal Laws — NOT Some Guy’s Algorithm: Let the market adjust to the Hidden Cycles Geometry — not the other way around. Most indicators are based on a man-made formula. They often lag, fail over time, or need constant re-o
Smart Trend Trading System, trend bilgilerini, giriş ve çıkış sinyallerini ve fiyat seviyelerini tek bir grafikte birleştiren bir MetaTrader 4 göstergesidir. Trend tespiti, dönüş bölgeleri, Smart Cloud, trailing stop mantığı, destek ve direnç, mum renklendirme, uyarılar ve çoklu zaman dilimi analizi dahil olmak üzere 10’dan fazla trading aracını tek bir sistemde birleştirir. Sistem, farklı piyasa koşullarında işlem yapmanıza yardımcı olmak için tasarlanmıştır: Trend piyasaları: Ana trendi belir
Identify key turning points with reliable fractal analysis This indicator examines the price structure of fractals of different periods to determine possible reversal points in the market, providing timing to positional traders that already have a fundamental or technical valuation model. Unlike its younger brother, Reversal Fractals , this indicator won't miss reversals because of the period selected, and will find reversal fractals on a zig-zag fashion, ignoring those reversals which do not
Currency Strength Wizard , başarılı ticaret için size hepsi bir arada çözüm sağlayan çok güçlü bir göstergedir. Gösterge, birden çok zaman dilimindeki tüm para birimlerinin verilerini kullanarak şu veya bu forex çiftinin gücünü hesaplar. Bu veriler, şu veya bu para biriminin gücünü görmek için kullanabileceğiniz, kullanımı kolay para birimi endeksi ve para birimi güç hatları biçiminde temsil edilir. İhtiyacınız olan tek şey, işlem yapmak istediğiniz tabloya göstergeyi eklemektir ve gösterge size
CRT Multi-Timeframe Market Structure & Liquidity Sweep Indicator Non-Repainting | Multi-Asset | MT5 Version Available MT5 Version:   https://www.mql5.com/en/market/product/162075 Full User Guide — explains what each feature does and why:   https://www.mql5.com/en/blogs/post/767525 Quick Start User Guide  — explains how to configure and in what order:  https://www.mql5.com/en/blogs/post/767540 Indicator Overview CRT Ghost Candle HTF Fractal is a complete institutional-grade market structure too
Neuro Poseidon MT4
Daria Rezueva
4.74 (46)
Neuro Poseidon is a new indicator by Daria Rezueva. It combines precise trading signals with adaptive TP/SL levels - creating best possible trades as a result! Message me and get  Neuro Poseidon Assistant  as a gift to automize your trading process! What makes it stand out? 1. Proven profitability on all assets and timeframes 2. Only confirmed BUY and SELL signals present on the chart 3. Adaptive TP & SL levels generated by the software for each trade 4. Easy to understand - suitable for all
This is a professional chart indicator designed for traders focused on stability and clear price action. It helps filter market noise and provides clear visual entry and exit zones for your trading decisions. Core Features: Strictly Non-Repainting: The system is built with strict non-repaint logic. What you see on the chart is the true historical performance. Confirmed Signals: Signals are triggered and confirmed only after the candle closes . Once a trading arrow appears on a closed candle, it
Forex Breath System , her piyasada kullanılabilen, trend bazlı bir ticaret sistemidir. Bu sistemi para birimleri, metaller, emtialar, endeksler, kripto ve hatta hisse senetleri ile kullanabilirsiniz. Ayrıca herhangi bir zaman diliminde de kullanılabilir. Sistem evrenseldir. Trendi gösterir ve trendle birlikte ok sinyalleri sağlar. Gösterge ayrıca, trend yönünde sinyaller göründüğünde size özel türde uyarılar da sağlayabilir, bu da trend ticaretini kolay bir iş haline getirir. Anlaşılması zor aya
Advanced Supply Demand
Bernhard Schweigert
4.91 (302)
Özel Ticaret –%30 İndirim Yeni Başlayanlar veya Uzman Yatırımcılar İçin En İyi Çözüm! Bu gösterge, bir dizi özel özellik ve yeni bir formül içerdiği için benzersiz, yüksek kaliteli ve uygun fiyatlı bir işlem aracıdır. Bu güncelleme ile çift zaman dilimi bölgeleri gösterebileceksiniz. Sadece daha yüksek bir zaman dilimini değil, hem grafik zaman dilimini hem de daha yüksek zaman dilimini gösterebileceksiniz: İÇ İÇE GEÇMİŞ BÖLGELER GÖSTERİYOR. Tüm Arz Talep yatırımcıları buna bayılacak. :) Önem
Super Signal – Skyblade Edition Profesyonel No-Repaint / Gecikmesiz Trend Sinyal Sistemi, Olağanüstü Kazanma Oranı ile | MT4 / MT5 için 1 dakika, 5 dakika ve 15 dakika gibi daha düşük zaman dilimlerinde en iyi şekilde çalışır. Temel Özellikler: Super Signal – Skyblade Edition, özellikle trend bazlı işlemler için geliştirilmiş akıllı bir sinyal sistemidir. Yalnızca güçlü, yönlü ve gerçek momentum destekli piyasa hareketlerini tespit etmek amacıyla çok katmanlı bir filtreleme yapısı kullanır. Bu s
Liquidity Scalper System: gösterge formatında likiditeye dayalı bir işlem sistemi. Çoğu gösterge yalnızca bir ok gösterir; sonrasında stopun nereye konacağına, hedefin nerede olduğuna ve sinyale güvenilip güvenilmeyeceğine trader kendisi karar verir. Liquidity Scalper System işlemin tüm döngüsünü kapsar: likidite havuzlarını bulur, kırılımlarında sinyal verir, Entry, Stop Loss ve üç hedefi anında hesaplar, panelde ise istatistikleri ve yeni veriler üzerindeki doğrulama sonuçlarını gösterir. Sis
Gann Made Easy
Oleg Rodin
4.84 (174)
Gann Made Easy , bay teorisini kullanarak ticaretin en iyi ilkelerine dayanan, profesyonel ve kullanımı kolay bir Forex ticaret sistemidir. WD Gann. Gösterge, Zararı Durdur ve Kâr Al Seviyeleri dahil olmak üzere doğru SATIN AL ve SAT sinyalleri sağlar. PUSH bildirimlerini kullanarak hareket halindeyken bile işlem yapabilirsiniz. Satın alma işleminden sonra, alım satım talimatlarını ve harika ek göstergeleri ücretsiz olarak almak için lütfen benimle iletişime geçin! Muhtemelen Gann ticaret yöntem
True Direction Oscillator
Muhammad Elbermawi
4.85 (364)
Veya "Saf Momentum " ilkesini kullanarak fiyat değişim oranını ölçen bir endeks olan (TDO). Bir menkul kıymet fiyatı 10'dan 15'e yükseldiğinde, fiyat değişim oranı %150'dir, ancak 15'ten 10'a düştüğünde, fiyat değişim oranı sadece %33.3'tür. Bu nedenle, "Fiyat Değişim Oranı" (ROC) veya "Momentum" gibi teknik analiz göstergeleri, artan fiyat hareketleri için azalan hareketlere göre daha yüksek değerler verir. TDO, yatırımcıların momentumu doğru okumalarına yardımcı olmak için bu sorunu düzeltir.
GoldRush Trend Ok Sinyali GoldRush Trend Ok Sinyali göstergesi, XAU/USD'de yüksek hızlı, kısa vadeli scalperlar için özel olarak tasarlanmış hassas, gerçek zamanlı trend analizi sağlar. 1 dakikalık zaman dilimi için özel olarak tasarlanan bu araç, net giriş noktaları için yön okları gösterir ve scalper'ların değişken piyasa koşullarında güvenle hareket etmelerini sağlar. Gösterge, PRIMARY ve SECONDARY uyarı oklarından oluşur. PRIMARY sinyalleri, trend yönündeki değişikliği gösteren Beyaz ve
ŞU ANDA %40INDIRIMLI Yeni Başlayanlar veya Uzman Tüccarlar için En İyi Çözüm! Bu Gösterge benzersiz, yüksek kaliteli ve uygun fiyatlı bir ticaret aracıdır çünkü bir dizi tescilli özellik ve yeni bir formül ekledik. Sadece BİR grafik ile 28 Forex çifti için Döviz Gücünü okuyabilirsiniz! Yeni bir trendin veya scalping fırsatının tam tetik noktasını belirleyebildiğiniz için ticaretinizin nasıl gelişeceğini hayal edin? Kullanım kılavuzu: buraya tıklayın Bu ilk olan, orijinal! Değersiz bir özent
Trend Lines PRO
Roman Podpora
5 (2)
TREND ÇİZGİLERİ PRO     Piyasanın gerçek yön değişimini anlamaya yardımcı olur. Gösterge, gerçek trend dönüşlerini ve büyük oyuncuların piyasaya yeniden girdiği noktaları gösterir. Anlıyorsun     BOS hatları  Daha yüksek zaman dilimlerindeki trend değişiklikleri ve önemli seviyeler, karmaşık ayarlar veya gereksiz gürültü olmadan gösterilir. Sinyaller yeniden çizilmez ve çubuk kapandıktan sonra grafikte kalır. VERSION MT 5     -    RFI LEVELS PRO  göstergesiyle birlikte kullanıldığında maksimum p
Şu anda %30 İNDİRİMLİ! Herhangi bir Acemi veya Uzman Tüccar için En İyi Çözüm! Bu gösterge paneli yazılımı 28 döviz çifti üzerinde çalışıyor. Ana göstergelerimizden 2'sine (Gelişmiş Para Birimi Gücü 28 ve Gelişmiş Para Birimi Dürtüsü) dayanmaktadır. Tüm Forex piyasasına harika bir genel bakış sağlar. Gelişmiş Para Birimi Gücü değerlerini, para birimi hareket hızını ve tüm (9) zaman dilimlerinde 28 Forex çifti için sinyalleri gösterir. Trendleri ve / veya scalping fırsatlarını belirlemek için
TDI Multi Timeframe Scanner: This Dashboard indicator uses the TDI (Trader's Dynamic Index) Indicator to find best trades. Read detailed How to Use Guide: https://www.mql5.com/en/blogs/post/758252 Extra indicators also available in above post. Checks for: - SharkFin Pattern Free indicator for SharkFin: https://www.mql5.com/en/market/product/42405/ - TDI Trend: Strong/Weak Trend Up/Down - TDI Signal: Strong/Medium/Weak Signal for Buy/Sell - Consolidation - Overbought/Oversold - Volatility Ban
Italo Trend Indicator
Italo Santana Gomes
4.74 (34)
BUY INDICATOR AND GET EA FOR FREE AS A BONUS + SOME OTHER GIFTS! ITALO TREND INDICATOR  is the best trend indicator on the market, the Indicator works on all time-frames and assets, indicator built after 7 years of experience on forex and many other markets. You know many trend indicators around the internet are not complete, does not help, and it's difficult to trade, but the Italo Trend Indicator is different , the Italo Trend Indicator shows the signal to buy or sell, to confirm the signal t
CRT Candle Range Theory HTF MT4 - Ultimate CRT Indicator: Gelişmiş ICT Konseptleri ve Malaysian SnR Ticaret Sistemi En gelişmiş Candle Range Theory göstergesi ile Piyasa Yapıcıların ayak izlerinde ustalaşın. Smart Money Concepts (SMC) gücünü açığa çıkarın ve Ultimate CRT Indicator ile tıpkı kurumlar gibi hassas bir şekilde ticaret yapın. Sadece ciddi yatırımcılar için özel olarak oluşturulan bu gösterge, ICT Konseptlerinin (Inner Circle Trader) temel direği olan oldukça etkili CRT (Candle Range
Yazarın diğer ürünleri
SignalX Account Pulse MT5
Ahmed Ismail Muhammad Ismail Al Talhat
What this is A free single-strip readout of the numbers that decide whether an account survives a bad hour: equity, free margin, margin level with a colour state that warns before the margin call, floating profit and loss, and the current spread measured against its sixty-bar average. It takes no decisions for you and it is free on purpose. What it does Free strip showing equity, free margin, margin level with margin-call colouring, floating P/L, open position count and current spread against it
FREE
SignalX Account Pulse
Ahmed Ismail Muhammad Ismail Al Talhat
What this is A free single-strip readout of the numbers that decide whether an account survives a bad hour: equity, free margin, margin level with a colour state that warns before the margin call, floating profit and loss, and the current spread measured against its sixty-bar average. It takes no decisions for you and it is free on purpose. What it does Free strip showing equity, free margin, margin level with margin-call colouring, floating P/L and current spread against its 60-bar average. Fre
FREE
Gold Apex EA MT4
Ahmed Ismail Muhammad Ismail Al Talhat
Gold Apex EA Gold Apex EA , yalnızca MetaTrader 4 platformu için geliştirilmiş; 1 dakikalık (M1) zaman dilimini kullanarak Altın (XAUUSD) üzerinde yüksek frekanslı scalping ve momentum işlemleri gerçekleştirmek üzere özel olarak tasarlanmış gelişmiş bir otomatik Uzman Danışmandır (Expert Advisor). Sistem, sistematik kurallar ve sıkı risk kontrolleri aracılığıyla kıymetli maden ticaretinin doğasında bulunan hızlı fiyat hareketlerini ve likidite değişimlerini yönetmek için tasarlanmıştır. Temel
SignalX Session Breakout
Ahmed Ismail Muhammad Ismail Al Talhat
SIGNALX SESSION BREAKOUT MetaTrader 4 için Nihai Kurumsal Fiyat Hareketi ve Aralık Haritalama Göstergesi ÜRÜNE GENEL BAKIŞ VE PAZAR AVANTAJI SignalX Session Breakout'a hoş geldiniz — MetaTrader 4 üzerinde mutlak matematiksel kesinlik talep eden profesyonel tüccarlar, algoritmik geliştiriciler ve fiyat hareketi uzmanları için özel olarak tasarlanmış elit düzeyde bir teknik analiz çözümüdür. Modern finansal piyasalarda, erken seans konsolidasyonu (Asya likidite aralığı veya Londra öncesi
SignalX Trade Panel
Ahmed Ismail Muhammad Ismail Al Talhat
What this is An on-chart control panel for manual MT4 trading. Instead of typing a lot size and hoping it is right, you set a risk percent once and every button on the panel sizes the position from your stop distance and the symbol tick value. What it does On-chart BUY/SELL buttons that size the position from a risk percent, plus CLOSE ALL and BE ALL. Interactive chart panel with risk-based sizing; no dependency on any indicator. Runs as an Expert Advisor attached to a single chart. No DLL calls
SignalX ATR Stop Planner
Ahmed Ismail Muhammad Ismail Al Talhat
What this is A planning tool that projects a volatility-based stop and target onto the chart and tells you the lot size that a fixed risk percent implies at that distance. Useful before you commit to a trade, and useful for building the habit of sizing from risk rather than from feeling. What it does Draws ATR-based stop and target levels and shows the lot size for a fixed risk percent. Volatility-adaptive stop projection drawn live on the chart. Runs as an Expert Advisor attached to a single ch
SignalX Break Even Guardian
Ahmed Ismail Muhammad Ismail Al Talhat
What this is A trade manager that works in R multiples. Once a position reaches a chosen R multiple it protects the trade, optionally takes partial profit, and only then starts trailing. It never opens trades. What it does Moves stops to break-even at a chosen R multiple, optionally takes a partial close, then trails. R-multiple driven management rather than fixed pip triggers; partial-close state persisted globally. Runs as an Expert Advisor attached to a single chart. No DLL calls. No external
SignalX Daily Risk Guard
Ahmed Ismail Muhammad Ismail Al Talhat
What this is An account-level circuit breaker. It watches the day's closed results plus floating profit and loss, and when a daily loss limit or a maximum trade count is reached it can stop new orders on the panel and flatten what is open. What it does Stops the day when a loss limit or a max-trade count is reached, and can flatten open positions. Account-level daily circuit breaker computed from closed history plus floating P/L. Runs as an Expert Advisor attached to a single chart. No DLL calls
SignalX Spread Monitor
Ahmed Ismail Muhammad Ismail Al Talhat
What this is A small on-chart readout of current spread, with a warning threshold, a colour state and an optional countdown to the next candle. Spread is a cost that most EAs and most manual traders simply do not measure. What it does Live spread versus 60-bar average, current session bucket, and seconds to the next bar close. Combines spread context, session awareness and bar timing in one compact panel. Runs as an Expert Advisor attached to a single chart. No DLL calls. No external services. N

SignalX Trade Journal Export
Ahmed Ismail Muhammad Ismail Al Talhat
What this is Writes your closed trade history to a CSV file on a timer or every tick, including commission and swap, with a totals row at the end. The point is a clean spreadsheet you can actually analyse offline instead of screenshots. What it does Writes the full closed-trade history to a CSV with a totals row, on a timer or every tick. Clean spreadsheet output including commission, swap and a computed total. Runs as an Expert Advisor attached to a single chart. No DLL calls. No external servi
SignalX Session Range Levels
Ahmed Ismail Muhammad Ismail Al Talhat
What this is Draws the high and low of a configurable session window together with the recent range history, so the levels that price has repeatedly reacted to are visible without hand-drawing them every day. What it does Marks the high and low of a configurable session for the last N sessions as extending levels. Historical session ranges kept as live trend lines, configurable wrap-around sessions. Runs as an Expert Advisor attached to a single chart. No DLL calls. No external services. No netw
SignalX Exposure Lens
Ahmed Ismail Muhammad Ismail Al Talhat
What this is Most multi-pair traders think in positions, not in currencies. Three long EURUSD trades and one short EURJPY feel diversified, but the book is really one large long EUR position. Exposure Lens opens every trade, splits it into its base and quote leg, nets every leg of the same currency together, converts the result into your account currency and shows what share of your equity each currency actually represents. What it does Nets every open position into per-currency long/short expos
SignalX Order Session Guard
Ahmed Ismail Muhammad Ismail Al Talhat
What this is Pending orders left overnight and positions carried through the weekend are two of the most common ways a planned trade turns into an unplanned risk. This utility handles the clock for you: it cancels pending orders that have been sitting for longer than you allow, closes everything at a session end time you choose, and forces a cut-off before the Friday close. What it does Expires stale pending orders, flattens all positions at a chosen session end time, and forces a Friday cut-off
SignalX Range Compression Scanner
Ahmed Ismail Muhammad Ismail Al Talhat
What this is Ranges compress before they expand. This indicator finds the bars where the Bollinger band width is in the lowest percentage of a lookback window and where the compression has lasted for a minimum number of bars, then draws each zone as a box with the upper and lower breakout levels extended to the right and the box height in points. What it does Marks historical squeeze zones where Bollinger width sits in the lowest x% of the lookback, boxes each run, extends the two breakout level
SignalX Volatility Regime Gauge
Ahmed Ismail Muhammad Ismail Al Talhat
What this is An ATR value of 12 points means very different things on EURUSD H1 and on gold M5. This indicator turns ATR into a percentile: the current ATR is ranked against the previous bars, and the result is plotted on a 0 to 100 scale with four bands. 20 means the market is quieter than 80 percent of the recent past; 90 means it is near the most volatile reading of the window. What it does Plots the percentile rank of ATR over a lookback window as a 0-100 oscillator with LOW / NORMAL / ACTIV
SignalX Currency Strength Meter
Ahmed Ismail Muhammad Ismail Al Talhat
What this is A currency is not strong or weak on its own; it is strong or weak against the others. This dashboard builds one score per major currency by measuring the change of every pair that currency appears in and crediting the base side with that change while debiting the quote side by the same amount. Averaging those credits gives eight numbers that can be compared directly. What it does Builds one strength score per currency from the change of every pair it appears in, and ranks all eight
SignalX Hourly Range Stats
Ahmed Ismail Muhammad Ismail Al Talhat
What this is Not every hour of the trading day moves the same amount, and the difference matters: a breakout at a dead hour is far more likely to fail than the same setup during the session when the symbol actually travels. This indicator averages the high-low range of each hour of the server day over a number of days and shows all twenty-four hours as a ranked table. What it does Averages the high-low range of every hour of the server day over N days and ranks all 24 hours with a bar and a perc
SignalX Level Alert Grid
Ahmed Ismail Muhammad Ismail Al Talhat
What this is Watching several charts for a handful of price levels is a poor use of attention. This tool watches the levels for you. You type a list such as 1.0850;1.0900;EURUSD 1.2700 into one input, and it alerts when price approaches, touches or crosses each level. Every level fires once, so an alert means something happened rather than repeating all day. What it does Watches a list of price levels, on one symbol or several, and alerts on approach, touch and cross, each firing once per level.
SignalX Margin Buffer Guard
Ahmed Ismail Muhammad Ismail Al Talhat
What this is When margin runs low, the broker closes whatever it decides to close, usually the largest position and usually at the worst moment. This utility acts before that point with two stages: an alert at a warning level you set, and then an orderly close of the least profitable position once a lower level is reached, pausing between closes and stopping as soon as margin recovers. What it does Warns at one margin level and starts closing the least profitable position, one at a time with a c
SignalX Pending Order Grid
Ahmed Ismail Muhammad Ismail Al Talhat
What this is Placing a ladder of pending orders by hand is slow and error-prone, and one mistyped lot size turns a plan into an accident. This tool builds the whole ladder in one action: a fixed number of levels per side, a fixed distance between them, one lot size, and optional stop loss and take profit in points. Before anything is sent it draws exactly where the orders would sit, and it only places them when you set the arming input to true. What it does Places a symmetric ladder of buy-limit
SignalX Pivot Levels
Ahmed Ismail Muhammad Ismail Al Talhat
What this is Pivot levels give a reference frame for the day without any indicator clutter: where the previous period balance sits, and where the likely support and resistance are. This indicator draws daily, weekly and monthly pivots at once, in classic, Fibonacci, Camarilla or Woodie form, labelled with their prices. What it does Draws daily, weekly and monthly pivots at once in one of four methods: classic, Fibonacci, Camarilla or Woodie. Three timeframes of pivot structure in one tool with t
SignalX Prop Challenge Tracker
Ahmed Ismail Muhammad Ismail Al Talhat
What this is Evaluation accounts are scored on rules, not on feelings, and the rules are unforgiving in one direction: a profit target is a goal, but a daily loss limit or a maximum drawdown is a hard stop. This tracker keeps all three numbers on the chart at once, measured from the starting balance you enter, so the distance between where the account is and where it is allowed to go is always visible. What it does Tracks profit-target progress, worst daily loss and worst total loss against the
SignalX Spread History Export
Ahmed Ismail Muhammad Ismail Al Talhat
What this is The spread you are quoted is a cost you pay on every trade, and most traders never measure it. This recorder samples the spread on a schedule, for one symbol or for everything in Market Watch, and appends it to a CSV file inside the terminal data folder. The result is a record you can open in a spreadsheet and use to compare hours, days and brokers. What it does Samples live spread on a fixed interval, one symbol or the whole Market Watch, and appends time / symbol / spread / ask /
SignalX Weekend Gap Detector
Ahmed Ismail Muhammad Ismail Al Talhat
What this is Weekend gaps are one of the few market events that can be measured exactly on your own chart. This indicator marks every gap between the Friday close and the Monday open, draws it as a zone, and reports what share of the recent gaps were filled and how long the fill took on average for this symbol. What it does Finds every weekend gap, draws it as a zone and reports what share of the last N gaps were filled and how many bars the fill took on average. Converts a folk belief into a pe
Visual Lot Size Calculator
Ahmed Ismail Muhammad Ismail Al Talhat
Visual trade planning and lot calculation utility for MetaTrader 5. Description: This utility allows traders to plan their entries visually directly on the chart. By using interactive graphical boxes, you can define your entry, stop loss, and take profit levels before opening a position. The software automatically calculates the required volume (lots) based on your account settings. It provides real-time data updates as you move the graphical elements on the screen. Key Features: Interactive In
SignalX Spread Monitor MT5
Ahmed Ismail Muhammad Ismail Al Talhat
What this is A small on-chart readout of current spread, with a warning threshold, a colour state and an optional countdown to the next candle. Spread is a cost that most EAs and most manual traders simply do not measure. What it does On-chart readout of current spread in points, its 60-bar average, spread against a warning level, the active session and a countdown to the next bar close. Puts the cost of the trade on the chart next to the price, with a warning state, instead of hiding it in the
SignalX Level Alert Grid MT5
Ahmed Ismail Muhammad Ismail Al Talhat
What this is Watching several charts for a handful of price levels is a poor use of attention. This tool watches the levels for you. You type a list such as 1.0850;1.0900;EURUSD 1.2700 into one input, and it alerts when price approaches, touches or crosses each level. Every level fires once, so an alert means something happened rather than repeating all day. What it does Watches a list of price levels, on one symbol or several, and alerts on approach, touch and cross, each firing once per level.
SignalX Session Range Levels MT5
Ahmed Ismail Muhammad Ismail Al Talhat
What this is Draws the high and low of a configurable session window together with the recent range history, so the levels that price has repeatedly reacted to are visible without hand-drawing them every day. What it does Marks the high and low of a configurable session window and keeps the last N sessions on the chart as boxes, with breakout levels extended to the right and each box labelled with its range in points. Session structure on demand at any hour window, drawn as the actual tradable b
SignalX Volatility Regime Gauge MT5
Ahmed Ismail Muhammad Ismail Al Talhat
What this is An ATR value of 12 points means very different things on EURUSD H1 and on gold M5. This indicator turns ATR into a percentile: the current ATR is ranked against the previous bars, and the result is plotted on a 0 to 100 scale with four bands. 20 means the market is quieter than 80 percent of the recent past; 90 means it is near the most volatile reading of the window. What it does Plots the percentile rank of ATR over a lookback window as a 0-100 oscillator with LOW / NORMAL / ACTIV
Filtrele:
Değerlendirme yok
Değerlendirmeye yanıt