SignalX Session Range Levels

What this is

Draws the high and low of a configurable session window together with the recent range history, so the levels that price has repeatedly reacted to are visible without hand-drawing them every day.

What it does

Marks the high and low of a configurable session for the last N sessions as extending levels.

  • Historical session ranges kept as live trend lines, configurable wrap-around sessions.
  • Runs as an Expert Advisor attached to a single chart.
  • No DLL calls. No external services. No network requests.
  • No account, terminal, symbol or time limitation is embedded.

Inputs

Input Type Default
InpStartHour int 0
InpEndHour int 8
InpHistory int 20
InpHighColor color clrTomato
InpLowColor color clrDodgerBlue
InpBoxWidth int 1

How to use it

  1. Attach the EA to a chart of the symbol you trade.
  2. Set the inputs to match your own risk approach. Defaults are deliberately conservative.
  3. Allow live trading in the Expert Advisors settings for this EA.
  4. Test on a demo account first. That is not a formality; the defaults are not tuned to your broker.

Notes

  • Written for MetaTrader 4, any broker, any account currency. Sizing maths uses the symbol's own tick value.
  • Works alongside other EAs, including with a magic number you choose, so it will not fight them for orders it does not own.
  • It performs management and measurement only; it does not generate trading signals.

Honest limits

  • This is a tool, not a strategy. It does not predict anything and it cannot make a losing method profitable.
  • No performance figures are published for it because tools of this kind do not have a meaningful backtest curve of their own.
  • If your broker quotes oddly (very wide spreads, non-standard tick values) verify the sizing on a demo account before using real funds.

Trading involves risk of loss. Nothing here is financial advice.

Önerilen ürünler
VR Cub
Vladimir Pastushak
VR Cub , yüksek kaliteli giriş noktaları elde etmenin bir göstergesidir. Gösterge, matematiksel hesaplamaları kolaylaştırmak ve bir pozisyona giriş noktalarının aranmasını basitleştirmek için geliştirildi. Göstergenin yazıldığı ticaret stratejisi uzun yıllardan beri etkinliğini kanıtlamaktadır. Ticaret stratejisinin basitliği, acemi yatırımcıların bile başarılı bir şekilde ticaret yapmasına olanak tanıyan büyük avantajıdır. VR Cub, pozisyon açılış noktalarını ve Kâr Al ve Zararı Durdur hedef sev
"Auto FIBO Pro" Crypto_Forex göstergesi - ticarette harika bir yardımcı araçtır! - Gösterge, Fibo seviyelerini ve yerel trend çizgilerini (kırmızı renk) otomatik olarak hesaplar ve grafikte yerleştirir. - Fibonacci seviyeleri, fiyatın tersine dönebileceği önemli alanları gösterir. - En önemli seviyeler %23,6, %38,2, %50 ve %61,8'dir. - Ters scalping veya bölge ızgara ticareti için kullanabilirsiniz. - Auto FIBO Pro göstergesini kullanarak mevcut sisteminizi geliştirmek için birçok fırsat vardır
Price Magnet — Price Density and Attraction Levels Indicator Price Magnet is a professional analytical tool designed to identify key support and resistance levels based on statistical Price Density. The indicator analyzes a specified historical period and detects price levels where the market spent the most time. These zones act as “magnets,” attracting price action or forming a structural base for potential reversals. Unlike traditional Volume Profile tools, Price Magnet focuses on price-time d
NQX Session Range Breakout MT4, MetaTrader 4 için bir sinyal göstergesidir: Avrupa açılışında gece aralığının kırılımı. Sakin gece aralığını belirleyen ve Avrupa penceresinde bu aralığın dışındaki ilk kararlı kapanışta sinyal veren özel NQX mantığı. Önerilen girişi, kısa bir stopu ve uzak hedefleri (3:1, 5:1, 10:1) çizer; kararı siz verirsiniz. Grafikte neler çizer - Kapanmış sinyal mumunun üzerinde bir ok (kapanmış bir sinyali asla yeniden çizmez). - Önerilen giriş, kısa bir stop ve uzak bir ön
Indicador Taurus All4
Fabio Oliveira Magalhaes
Taurus All4 Taurus All4 is a high-performance indicator, it will tell you the strength of the trend, and you will be able to observe the strength of the candle. Our indicator has more than 4 trend confirmations. It is very simple and easy to use. Confirmation Modes Candle Trend Confirmations: When the candle switches to light green the trend is high. When the candle switches to light red the trend is reverting down. When the candle changes to dark red the trend is low. Trendline Trend Confirm
Alpha Trend sign has been a very popular trading tool in our company for a long time. It can verify our trading system and clearly indicate trading signals, and the signals will not drift. Main functions: Based on the market display of active areas, indicators can be used to intuitively determine whether the current market trend belongs to a trend market or a volatile market. And enter the market according to the indicator arrows, with green arrows indicating buy and red arrows indicating se
NQX Flag Continuation Daily Bias MT4, MetaTrader 4 için bir sinyal göstergesidir: bayrak devamı sinyalleri (yalnızca günlük eğilim yönünde sinyal verir). İtkiyi sürdüren kısa bir bayrağı tespit eden özel NQX mantığı. Yalnızca günlük eğilim yönünde sinyal verir. Önerilen girişi, kısa bir stopu ve uzak hedefleri (3:1, 5:1, 10:1, swing'de 20:1'e kadar) çizer; kararı siz verirsiniz. Grafikte neler çizer - Kapanmış sinyal mumunun üzerinde bir ok (kapanmış bir sinyali asla yeniden çizmez). - Önerilen
The Best One Scalping Trade Panel functional manual trade panel with risk reward, auto SL by candle ( original solution), lot size calculation, one-click trading, scale in and out of trades (partial close),  Works with all symbols not just currency pairs, perfect works on DAX, NASDAQ, GOLD, ...... I earn every day during live stream on ZakopiecFX - join Me Risk by lot Risk by percent SL by points SL by Candle, Renko, RangeBar ( original solution) TP by point TP by Risk/Reward Auto Trailing by P
Diamond Trend
Segundo Calvo Munoz
Indicator which identifies Trend and also buy/sell opportunities. Use for entries aligned to the Trend.  Although Diamond Trend is very accurate identifying entry points, it is always recommended to use a support indicator in order to reconfirm the operation. Remind to look for those Assets and Timeframes which best fit to your trader behavior/need... Valid for Scalping and Long Term operations. Please, set up a Bars Chart to be able to visualize the indicator properly...  ...And remind to give
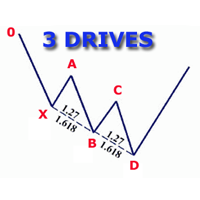
The indicator detects and displays 3 Drives harmonic pattern (see the screenshot). The pattern is plotted by the extreme values of the ZigZag indicator (included in the resources, no need to install). After detecting the pattern, the indicator notifies of that by a pop-up window, a mobile notification and an email. The indicator highlights the process of the pattern formation and not just the complete pattern. In the former case, it is displayed in the contour triangles. After the pattern is com
Rainbow Price Visualizer v1.21 See where the market really breathes. Turns your MT4 chart into an ultra-precise heatmap that highlights price zones favored by big players. Why it matters 300 price levels at 0.2‑pip resolution — microscopic detail. 8 visual themes (Rainbow, Fire, Ocean…) for instant readibility. Smart opacity: low noise fades, real zones pop. Lightweight rendering with automatic cleanup. Fully customizable: saturation, opacity, resolution, history depth. Bands project into the f
MT4 için Crypto_Forex Göstergesi "Çekiç ve Kayan Yıldız paterni", Yeniden boyama yok, gecikme yok. - "Çekiç ve Kayan Yıldız paterni" göstergesi, Fiyat Hareketi işlemleri için çok güçlü bir göstergedir. - Gösterge, grafikte boğa Çekiç ve ayı Kayan Yıldız formasyonlarını tespit eder: - Boğa Çekiç - Grafikte mavi ok sinyali (resimlere bakın). - Ayı Kayan Yıldız - Grafikte kırmızı ok sinyali (resimlere bakın). - Bilgisayar, Mobil ve E-posta uyarılarıyla. - "Çekiç ve Kayan Yıldız paterni" göstergesi
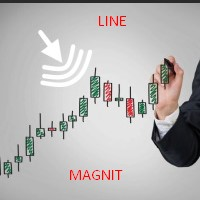
The LineMagnit Indicator for MT4 is a highly precise tool that builds support and resistance levels which magnetically attract prices. This feature allows traders to easily determine the most probable entry and exit points in the market, as well as identify the market's directional forces, as levels are based on capital inflows into the instrument. Equipped with an intuitively understandable graphical interface, the LineMagnit Indicator enables users to quickly locate and analyze support and res
Trendiness Index
Libertas LLC
5 (3)
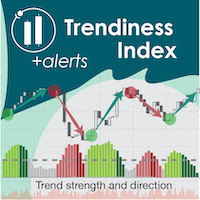
"The trend is your friend" is one of the best known sayings in investing, because capturing large trendy price movements can be extremely profitable. However, trading with the trend is often easier said than done, because many indicators are based on price reversals not trends. These aren't very effective at identifying trendy periods, or predicting whether trends will continue. We developed the Trendiness Index to help address this problem by indicating the strength and direction of price trend
PZ Harmonacci Patterns
PZ TRADING SLU
3.17 (6)
Trade smarter, not harder: Empower your trading with Harmonacci Patterns This is arguably the most complete harmonic price formation auto-recognition indicator you can find for the MetaTrader Platform. It detects 19 different patterns, takes fibonacci projections as seriously as you do, displays the Potential Reversal Zone (PRZ) and finds suitable stop-loss and take-profit levels. [ Installation Guide | Update Guide | Troubleshooting | FAQ | All Products  ] It detects 19 different harmonic pric
Trend Ray
Andriy Sydoruk
The indicator shows the potential trend direction by cyclical-wave dependence. Thus, all the rays of the intersection will be optimal rays, in the direction of which the price is expected to move, taking into account the indicator period. Rays can be used as a direction for potential market movement. But we must not forget that the approach must be comprehensive, the indicator signals require additional information to enter the market.
The indicator analyzes the change in the minimum and maximum prices of the previous bars fixing the entrance of the big players. If the change (delta) increases, a signal is displayed on the graph in the form of an arrow. At the same time, virtual trade on history is carried out. In case of a repeat of the signal, the positions are increased (refilling). Thus the lot of positions can differ. The results of virtual trading in the form of losses / losses, profitability, drawdown and transaction li
Gold Phoenix
Yaroslav Varankin
The perfect tool for Scalng in the Forex markets You can trade both from signal to signal and using take profit  The algorithm does not use Zigzag!  No redrawing!  This is a channel instrument that uses a moving average as a filter. Moving Average  There are 2 parameters for the settings Ma Period = 5 period Moving Average  Channel 1.0 distance of channel lines from the chart Price Signal Filter - calculation of signal opening and filter There is a complete set of Alert There is a multi-timefram
The indicator displays the data of the Stochastic oscillator from a higher timeframe on the chart. The main and signal lines are displayed in a separate window. The stepped response is not smoothed. The indicator is useful for practicing "manual" forex trading strategies, which use the data from several screens with different timeframes of a single symbol. The indicator uses the settings that are identical to the standard ones, and a drop-down list for selecting the timeframe. Indicator Paramet
v. 1.0 This indicator can show with maximum accuracy up to 1 bar the presence of a Maximum/minimum on the chart, regardless of the timeframe. It has a flexible configuration. You can use either one value on all TF, or you can use your own value on each TF individually. This indicator is already being improved and those who purchase it receive all updates for free. Next, it is planned to display an indication of the strength of the pivot point at each extremum (in % or in color drawing). It wi
Easy Trade indicator
Felipe Carvalho De Queiroz
Easy Trade Indicator – Your Path to Profitable Trades! Work any Time Frame! Maximize your profits with precise and assertive trades! ️ Trade with comfort – the indicator does the analysis and you only open the order in the direction in which the indicator shows you!  Exclusive panel with past trade counter and accuracy tracking! Simplify your analysis, boost your performance, and trade with confidence! Get it now and take your trading to the next level
Trend PA
Mikhail Nazarenko
5 (3)
The Trend PA indicator uses   Price Action   and its own filtering algorithm to determine the trend. This approach helps to accurately determine entry points and the current trend on any timeframe. The indicator uses its own algorithm for analyzing price changes and Price Action. Which gives you the advantage of recognizing, without delay, a new nascent trend with fewer false positives. Trend filtering conditions can be selected in the settings individually for your trading style. The indicator
Noize Absorption Index MT4
Ekaterina Saltykova
5 (1)
Noize Absorption Index - is the manual trading system that measures the difference of pressure between bears forces and bulls forces. Green line - is a noize free index that showing curent situation. Zero value of index shows totally choppy/flat market.Values above zero level shows how powerfull bullish wave is and values below zero measures bearish forces.Up arrow appears on bearish market when it's ready to reverse, dn arrow appears on weak bullish market, as a result of reverse expectation. S
Gösterge, tarihsel olanlarla karşılaştırılabilecek güncel teklifler oluşturur ve bu temelde bir fiyat hareketi tahmini yapar. Gösterge, istenen tarihe hızlı navigasyon için bir metin alanına sahiptir. Seçenekler: Sembol - göstergenin göstereceği sembolün seçimi; SymbolPeriod - göstergenin veri alacağı dönemin seçimi; GöstergeRenk - gösterge rengi; Ters - doğru tırnakları tersine çevirir, yanlış - orijinal görünüm; Sonraki, tarihi girebileceğiniz ve 'enter' tuşuna basarak hemen atlayab
Before
Nadiya Mirosh
The Before indicator predicts the most likely short-term price movement based on complex mathematical calculations. Most of the standard indicators commonly used in trading strategies are based on fairly simple calculations. This does not mean that there were no outstanding mathematicians in the world at the time of their creation. It is just that computers did not yet exist in those days, or their power was not enough for the sequential implementation of complex mathematical operations. Nowad
Добрый День уважаемые трейдеры!  Вашему вниманию индикатор созданный и работающий на базе трендовика ADX,  для торговли на смене направления движения который учитывает коррекцию и даёт возможность на ней заработать.  Применяю этот индикатор для скальпинга. Рекомендую таймфреймы от 15 ти минутного(М15) до часового (Н1) периодов.  Красный кружок сигнал на продажу- Sell) Зелёный кружок  сигнал на покупку Buy) Чем меньше ваш таймфрейм тем меньше пунктов вы зарабатываете.   Важно выставлять стопы! !В
Piyasaya Yeni Bir Kral Geldi – Gösterge + Emir Yönetimi (TP1 + TP2 + TP3) (TAM TİCARET SİSTEMİ) Bu gösterge; gelişmiş bir strateji, tamamen özelleştirilebilir emir yönetim sistemi ve Envelopes genişlemelerini kullanan bir Ortalama Dönüş (Mean Reversion) sistemi ile birlikte gelir. RSI gibi çoklu akıllı onay filtreleri sayesinde yüksek olasılıklı dönüş noktalarını tespit eder ve net BUY (Alış) ile SELL (Satış) sinyalleri üretir. Gösterge Repaint Yapmaz (No Repaint). Sadece işlem açmayı değil, ayn
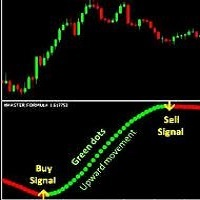
Xmaster göstergesinin yeni, daha doğru versiyonu. Dünyanın dört bir yanından 200'den fazla tüccar, en etkili ve doğru formülü elde etmek için bu göstergenin farklı kombinasyonlarının 15.000'den fazla testini bilgisayarlarında gerçekleştirdi. Ve burada size doğru sinyalleri gösteren ve yeniden boyamayan "Xmaster formül göstergesi forex yeniden boyama yok" göstergesini sunuyoruz. Bu gösterge aynı zamanda tüccara e-posta ve push yoluyla sinyaller gönderir. Her yeni tick'in gelmesiyle birlikte, 75'
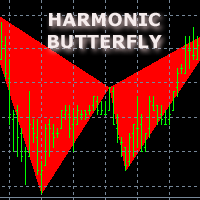
The indicator detects and displays М. Gartley's Butterfly pattern. The pattern is plotted by the extreme values of the ZigZag indicator (included in the resources, no need to install). After detecting the pattern, the indicator notifies of that by the pop-up window, a mobile notification and an email. The pattern and wave parameters are displayed on the screenshots. The default parameters are used for demonstration purposes only in order to increase the amount of detected patterns. Parameters z
The indicator provides a superior alternative to price action analysis. It enables the identification of normalized patterns, which are then transformed into a graphical representation to forecast future steps within a time series. In the top-left corner, you'll find information regarding the expected prediction accuracy, determined through a complex MSQE calculation. You have the flexibility to adjust the time window, making it easy to validate the indicator's performance. Additionally, you can
Bu ürünün alıcıları ayrıca şunları da satın alıyor
Trend SniperX MT4
Sarvarbek Abduvoxobov
5 (5)
Trend Sniper X , işlemcilerin trend yönünü ve olası dönüş noktalarını netlik ve hassasiyetle belirlemelerine yardımcı olan MetaTrader 5 için çoklu zaman dilimli bir trend takip göstergesidir. MT5 İçin: https://www.mql5.com/en/market/product/181101 Fiyat Bilgisi: Mevcut fiyat tanıtım amaçlıdır ve gelecek güncellemeler ile yeni özellikler eklendikçe değişebilir. Code2Profit Kanalı Çoklu Zaman Dilimi Analizi ile Piyasaya Hakim Olun! Trend Sniper X ile Kazanma Oranınızı Nasıl En Üst Düzeye Çıkarırsı
Scalper Vault
Oleg Rodin
5 (40)
Scalper Vault, gün içi işlemlerde istikrar yakalamak isteyen yatırımcılar için tasarlanmış, güçlü ve tam donanımlı bir alım satım sistemidir. Bu yüksek hassasiyetli gösterge; hem Forex hem de İkili Opsiyon yatırımcıları için kurumsal düzeyde analizler sunan, bağımsız ve eksiksiz bir alım satım sistemi işlevi görür. SATIN ALIM İŞLEMİNDEN SONRA BENİMLE İLETİŞİME GEÇİN; ALIM SATIM İPUÇLARIMI VE HARİKA BİR BONUSU ALIN! Tahmin yürütme zorunluluğunu ve karmaşık manuel analiz süreçlerini ortadan kaldır
PRO Renko Sistemi, RENKO grafikleri ticareti için özel olarak tasarlanmış son derece hassas bir ticaret sistemidir. Bu, çeşitli ticaret araçlarına uygulanabilen evrensel bir sistemdir. Sistemi etkin piyasa sana doğru ters sinyallerine erişim hakkı denilen ses nötralize eder. Göstergenin kullanımı çok kolaydır ve sinyal üretiminden sorumlu tek bir parametreye sahiptir. Aracı, seçtiğiniz herhangi bir ticaret aracına ve renko çubuğunun boyutuna kolayca uyarlayabilirsiniz. Yazılımımla karlı bir
SR Liquidity
Oleg Rodin
5 (2)
SR Liquidity , piyasa likiditesinin yoğunlaştığı ve fiyatın en güçlü tepkiyi verdiği gizli bölgeleri ortaya çıkarmak için tasarlanmış bir alım-satım göstergesidir. Bu özel likidite alanları güçlü destek ve direnç seviyeleri işlevi görerek, piyasanın yön değiştirme ihtimalinin en yüksek olduğu yerlere dair size net bir harita sunar. SR Liquidity, sıradan Destek/Direnç çizgileri çizmek yerine, alım ve satım baskısının yoğunlaştığı bölgeleri tespit etmek için gerçek fiyat hareketlerini analiz eder.
M1 Sniper
Oleg Rodin
4.97 (30)
M1 SNIPER kullanımı kolay bir işlem göstergesi sistemidir. M1 zaman dilimi için tasarlanmış bir ok göstergesidir. Gösterge, M1 zaman diliminde scalping için bağımsız bir sistem olarak kullanılabilir ve mevcut işlem sisteminizin bir parçası olarak kullanılabilir. Bu işlem sistemi özellikle M1'de işlem yapmak için tasarlanmış olsa da, diğer zaman dilimleriyle de kullanılabilir. Başlangıçta bu yöntemi XAUUSD ve BTCUSD ticareti için tasarladım. Ancak bu yöntemi diğer piyasalarda işlem yaparken de ya
Currency Strength Wizard , başarılı ticaret için size hepsi bir arada çözüm sağlayan çok güçlü bir göstergedir. Gösterge, birden çok zaman dilimindeki tüm para birimlerinin verilerini kullanarak şu veya bu forex çiftinin gücünü hesaplar. Bu veriler, şu veya bu para biriminin gücünü görmek için kullanabileceğiniz, kullanımı kolay para birimi endeksi ve para birimi güç hatları biçiminde temsil edilir. İhtiyacınız olan tek şey, işlem yapmak istediğiniz tabloya göstergeyi eklemektir ve gösterge size
Gann Made Easy
Oleg Rodin
4.84 (174)
Gann Made Easy , bay teorisini kullanarak ticaretin en iyi ilkelerine dayanan, profesyonel ve kullanımı kolay bir Forex ticaret sistemidir. WD Gann. Gösterge, Zararı Durdur ve Kâr Al Seviyeleri dahil olmak üzere doğru SATIN AL ve SAT sinyalleri sağlar. PUSH bildirimlerini kullanarak hareket halindeyken bile işlem yapabilirsiniz. Satın alma işleminden sonra, alım satım talimatlarını ve harika ek göstergeleri ücretsiz olarak almak için lütfen benimle iletişime geçin! Muhtemelen Gann ticaret yöntem
AW Prime Oscillator
AW Trading Software Limited
5 (1)
İki osilatörün birleşimi. Birincisi giriş noktalarını, ikincisi ise mevcut trendi gösterir. Gösterge, osilatör sinyallerini iki modda oklarla görüntüleyebilir; tüm hızlı osilatör sinyalleri veya yalnızca mevcut trend yönündeki sinyaller. Çok zaman dilimli bir panele ve üç tür sinyal bildirimine sahiptir. Faydalar: Günlük ve scalping ticaretine uygundur Trend filtreleme Basit ve hassas kurulum Çoklu zaman dilimi paneli Bir danışmana entegrasyona uygundur. Herhangi bir sembol ve herhangi bir zaman
Hidden Cycles
Lev Vladimirovic Marushkin
5 (1)
The Only 100% Universal Tool! Stop trading against nature! This is your chance to secure the only indicator rooted in the absolute laws that govern the entire universe. Most tools guess—this one reveals the truth. Buy another toy or buy the truth. Your choice... Based on Universal Laws — NOT Some Guy’s Algorithm: Let the market adjust to the Hidden Cycles Geometry — not the other way around. Most indicators are based on a man-made formula. They often lag, fail over time, or need constant re-o
CRT Multi-Timeframe Market Structure & Liquidity Sweep Indicator Non-Repainting | Multi-Asset | MT5 Version Available MT5 Version:   https://www.mql5.com/en/market/product/162075 Full User Guide — explains what each feature does and why:   https://www.mql5.com/en/blogs/post/767525 Quick Start User Guide  — explains how to configure and in what order:  https://www.mql5.com/en/blogs/post/767540 Indicator Overview CRT Ghost Candle HTF Fractal is a complete institutional-grade market structure too
SIO Oscillator: Kendi Kendini Optimize Eden Yarı Varyans Dengesizlik Osilatörü İndikatörü satın alın, ona dayalı Uzman Danışmanı (EA) ÜCRETSİZ edinin. Çoğu osilatör, tüm fiyat hareketlerini aynı şekilde değerlendirir. SIO ise yükseliş ve düşüş baskısını birbirinden ayırır ve aralarındaki dengesizliği ölçerek piyasayı gerçekte kimin kontrol ettiğini gösterir: alıcılar mı, satıcılar mı. Dengesizlik bir uç noktaya ulaştığında SIO, giriş, Stop Loss ve Take Profit seviyeleriyle birlikte net bir sinya
Neuro Poseidon MT4
Daria Rezueva
4.74 (46)
Neuro Poseidon is a new indicator by Daria Rezueva. It combines precise trading signals with adaptive TP/SL levels - creating best possible trades as a result! Message me and get  Neuro Poseidon Assistant  as a gift to automize your trading process! What makes it stand out? 1. Proven profitability on all assets and timeframes 2. Only confirmed BUY and SELL signals present on the chart 3. Adaptive TP & SL levels generated by the software for each trade 4. Easy to understand - suitable for all
This is a professional chart indicator designed for traders focused on stability and clear price action. It helps filter market noise and provides clear visual entry and exit zones for your trading decisions. Core Features: Strictly Non-Repainting: The system is built with strict non-repaint logic. What you see on the chart is the true historical performance. Confirmed Signals: Signals are triggered and confirmed only after the candle closes . Once a trading arrow appears on a closed candle, it
GoldRush Trend Ok Sinyali GoldRush Trend Ok Sinyali göstergesi, XAU/USD'de yüksek hızlı, kısa vadeli scalperlar için özel olarak tasarlanmış hassas, gerçek zamanlı trend analizi sağlar. 1 dakikalık zaman dilimi için özel olarak tasarlanan bu araç, net giriş noktaları için yön okları gösterir ve scalper'ların değişken piyasa koşullarında güvenle hareket etmelerini sağlar. Gösterge, PRIMARY ve SECONDARY uyarı oklarından oluşur. PRIMARY sinyalleri, trend yönündeki değişikliği gösteren Beyaz ve
Advanced Supply Demand
Bernhard Schweigert
4.91 (302)
Özel Ticaret –%30 İndirim Yeni Başlayanlar veya Uzman Yatırımcılar İçin En İyi Çözüm! Bu gösterge, bir dizi özel özellik ve yeni bir formül içerdiği için benzersiz, yüksek kaliteli ve uygun fiyatlı bir işlem aracıdır. Bu güncelleme ile çift zaman dilimi bölgeleri gösterebileceksiniz. Sadece daha yüksek bir zaman dilimini değil, hem grafik zaman dilimini hem de daha yüksek zaman dilimini gösterebileceksiniz: İÇ İÇE GEÇMİŞ BÖLGELER GÖSTERİYOR. Tüm Arz Talep yatırımcıları buna bayılacak. :) Önem
Super Signal – Skyblade Edition Profesyonel No-Repaint / Gecikmesiz Trend Sinyal Sistemi, Olağanüstü Kazanma Oranı ile | MT4 / MT5 için 1 dakika, 5 dakika ve 15 dakika gibi daha düşük zaman dilimlerinde en iyi şekilde çalışır. Temel Özellikler: Super Signal – Skyblade Edition, özellikle trend bazlı işlemler için geliştirilmiş akıllı bir sinyal sistemidir. Yalnızca güçlü, yönlü ve gerçek momentum destekli piyasa hareketlerini tespit etmek amacıyla çok katmanlı bir filtreleme yapısı kullanır. Bu s
ŞU ANDA %40INDIRIMLI Yeni Başlayanlar veya Uzman Tüccarlar için En İyi Çözüm! Bu Gösterge benzersiz, yüksek kaliteli ve uygun fiyatlı bir ticaret aracıdır çünkü bir dizi tescilli özellik ve yeni bir formül ekledik. Sadece BİR grafik ile 28 Forex çifti için Döviz Gücünü okuyabilirsiniz! Yeni bir trendin veya scalping fırsatının tam tetik noktasını belirleyebildiğiniz için ticaretinizin nasıl gelişeceğini hayal edin? Kullanım kılavuzu: buraya tıklayın Bu ilk olan, orijinal! Değersiz bir özent
Trend Lines PRO
Roman Podpora
5 (2)
TREND ÇİZGİLERİ PRO     Piyasanın gerçek yön değişimini anlamaya yardımcı olur. Gösterge, gerçek trend dönüşlerini ve büyük oyuncuların piyasaya yeniden girdiği noktaları gösterir. Anlıyorsun     BOS hatları  Daha yüksek zaman dilimlerindeki trend değişiklikleri ve önemli seviyeler, karmaşık ayarlar veya gereksiz gürültü olmadan gösterilir. Sinyaller yeniden çizilmez ve çubuk kapandıktan sonra grafikte kalır. VERSION MT 5     -    RFI LEVELS PRO  göstergesiyle birlikte kullanıldığında maksimum p
Şu anda %30 İNDİRİMLİ! Herhangi bir Acemi veya Uzman Tüccar için En İyi Çözüm! Bu gösterge paneli yazılımı 28 döviz çifti üzerinde çalışıyor. Ana göstergelerimizden 2'sine (Gelişmiş Para Birimi Gücü 28 ve Gelişmiş Para Birimi Dürtüsü) dayanmaktadır. Tüm Forex piyasasına harika bir genel bakış sağlar. Gelişmiş Para Birimi Gücü değerlerini, para birimi hareket hızını ve tüm (9) zaman dilimlerinde 28 Forex çifti için sinyalleri gösterir. Trendleri ve / veya scalping fırsatlarını belirlemek için
DayTrader PRO MT4
Davit Beridze
4.6 (10)
DayTrader PRO MT5:  https://www.mql5.com/en/market/product/186222 DayTrader PRO, John Ehlers'in Laguerre filtresini güçlü bir otomatik optimizasyon motoruyla birleştiren gelişmiş bir alım satım indikatörüdür. Sabit parametreler kullanmak yerine, indikatör yakın piyasa koşullarına göre en iyi ayarları otomatik olarak arar ve sürekli manuel ayarlamalar yapmadan değişen piyasa volatilitesine uyum sağlamanıza yardımcı olur. İndikatör, net ALIM (BUY) ve SATIM (SELL) sinyallerinin yanı sıra mevcut piy
Indicator plots price cycle blocks and sends signals with smart volume confirmation. Price cycles and fractals are combined to determine the demand/supply blocks. The indicator can be used alone or combined with other Cycle Indicators Inputs: Period: Recommended value is between 35 and 55( Which are Set 1 and Set 2 periods of cycle sniper ) Engulfing: If true, you will be able to see the engulfing bar confirmation. Volume Filter: True (The  arrow comes with volume confirmation ) Videos with dif
Currency Strength Exotics
Bernhard Schweigert
4.88 (33)
ŞU ANDA %20 INDIRIMLI! Herhangi bir Acemi veya Uzman Tüccar için En İyi Çözüm! Bu Gösterge, Egzotik Çiftler Emtialar, Endeksler veya Vadeli İşlemler gibi herhangi bir sembol için para birimi gücünü göstermek için uzmanlaşmıştır. Türünün ilk örneğidir, Altın, Gümüş, Petrol, DAX, US30, MXN, TRY, CNH vb. gerçek para birimi gücünü göstermek için 9. satıra herhangi bir sembol eklenebilir. Bu benzersiz, yüksek kaliteli ve uygun fiyatlı bir ticaret aracıdır çünkü bir dizi tescilli özelliği ve yeni b
Scalper Inside PRO
Alexey Minkov
4.74 (69)
Scalper Inside PRO helps you read the intraday trend and plan a trade before you enter the market. It is built around three exclusive strategies for a sharper read of the market. The moment a signal appears, the indicator evaluates market direction and calculates the key levels, so you see the potential entry, the expected stop-loss and several profit-taking levels in advance. Detailed performance statistics show how different instruments and strategies performed in history and help you pick ass
Blahtech Supply Demand
Blahtech Limited
4.58 (36)
Was: $299  Now: $99   Supply Demand uses previous price action to identify potential imbalances between buyers and sellers. The key is to identify the better odds zones, not just the untouched ones. Blahtech Supply Demand indicator delivers functionality previously unavailable on any trading platform. This 4-in-1 indicator not only highlights the higher probability zones using a multi-criteria strength engine, but also combines it with multi-timeframe trend analysis, previously confirmed swings
Elliott Wave Trend was designed for the scientific wave counting. This tool focuses to get rid of the vagueness of the classic Elliott Wave Counting using the guideline from the template and pattern approach. In doing so, firstly Elliott Wave Trend offers the template for your wave counting. Secondly, it offers Wave Structural Score to assist to identify accurate wave formation. It offers both impulse wave Structural Score and corrective wave Structure Score. Structural Score is the rating to sh
Supply and Demand Dashboard PRO
Bernhard Schweigert
4.81 (21)
Şu anda %30 İNDİRİMLİ! Bu gösterge paneli, birden fazla sembol ve 9 zaman dilimine kadar çalışan çok güçlü bir yazılım parçasıdır. Ana göstergemize dayanmaktadır (En iyi yorumlar: Advanced Supply Demand ).     Gösterge paneli harika bir genel bakış sağlar. Gösterir:    Bölge mukavemet derecesi dahil filtrelenmiş Arz ve Talep değerleri, Bölgelere/ve bölgeler içindeki pip mesafeleri, İç içe geçmiş bölgeleri vurgular, Tüm (9) zaman dilimlerinde seçilen semboller için 4 çeşit uyarı verir. Kişisel
PipFinite Trend PRO
Karlo Wilson Vendiola
4.88 (2252)
Breakthrough Solution For Trend Trading And Filtering With All Important Features Built Inside One Tool! Trend PRO's smart algorithm detects the trend, filters out market noise and gives entry signals with exit levels. The new features with enhanced rules for statistical calculation improved the overall performance of this indicator. Important Information Revealed Maximize the potential of Trend Pro, please visit www.mql5.com/en/blogs/post/713938 The Powerful Expert Advisor Version Automatin
Miraculous Indicator Binary & Forex v3 StrategySafe Miraculous Indicator Binary & Forex v3 StrategySafe , net sinyaller, güçlü onay araçları ve Binary ile Forex piyasalarında kullanılabilecek yapılandırılmış bir işlem yaklaşımı isteyen traderlar için geliştirilmiş profesyonel bir indikatördür. v3 sürümü; MIR Dashboard, Miraculous Confirmation Dashboard, GANN Law, Square of 9 seviyeleri, GANN açıları ve daha gelişmiş Forex modu ile daha güçlü bir piyasa analizi sunar. Öne çıkan özellikler Tek ind
ICT Pro 4
Robby Suhendrawan
MT4 İçin Ultimate AIO ICT Concept Indicator: Smart Money Concepts'te Otomatik Olarak Uzmanlaşın Her gün ekranlarınızı manuel olarak çizmek için saatler harcamaktan yoruldunuz mu? AIO ICT Concept göstergesi, Smart Money Concepts'te ustalaşmak için eksiksiz, hepsi bir arada çözümünüzdür. Manuel teknik analizin tahmin yürütme ve duygusal yorgunluğunu ortadan kaldırmak için tasarlanan bu güçlü algoritmik araç, en kritik fiyat hareketi öğelerini (price action) doğrudan grafiğinize otomatik olarak eşl
Cycles Predictor Indicator This indicator uses past market cycles to predict future price movements. The indicator scans through past data and considers  combinations  of cycles. When cycles  coincide  at the same future date/time then it is considered a valid future prediction. The predictions are drawn as vertical lines on the right side of the chart in the future. A prediction will often result in type of candle (ex. bull or bear) and/or a reversal point (ex. bottom or top) forming at this ex
Yazarın diğer ürünleri
Gold Apex EA MT4
Ahmed Ismail Muhammad Ismail Al Talhat
Gold Apex EA Gold Apex EA , yalnızca MetaTrader 4 platformu için geliştirilmiş; 1 dakikalık (M1) zaman dilimini kullanarak Altın (XAUUSD) üzerinde yüksek frekanslı scalping ve momentum işlemleri gerçekleştirmek üzere özel olarak tasarlanmış gelişmiş bir otomatik Uzman Danışmandır (Expert Advisor). Sistem, sistematik kurallar ve sıkı risk kontrolleri aracılığıyla kıymetli maden ticaretinin doğasında bulunan hızlı fiyat hareketlerini ve likidite değişimlerini yönetmek için tasarlanmıştır. Temel
SignalX Session Breakout
Ahmed Ismail Muhammad Ismail Al Talhat
SIGNALX SESSION BREAKOUT MetaTrader 4 için Nihai Kurumsal Fiyat Hareketi ve Aralık Haritalama Göstergesi ÜRÜNE GENEL BAKIŞ VE PAZAR AVANTAJI SignalX Session Breakout'a hoş geldiniz — MetaTrader 4 üzerinde mutlak matematiksel kesinlik talep eden profesyonel tüccarlar, algoritmik geliştiriciler ve fiyat hareketi uzmanları için özel olarak tasarlanmış elit düzeyde bir teknik analiz çözümüdür. Modern finansal piyasalarda, erken seans konsolidasyonu (Asya likidite aralığı veya Londra öncesi
SignalX Trade Panel
Ahmed Ismail Muhammad Ismail Al Talhat
What this is An on-chart control panel for manual MT4 trading. Instead of typing a lot size and hoping it is right, you set a risk percent once and every button on the panel sizes the position from your stop distance and the symbol tick value. What it does On-chart BUY/SELL buttons that size the position from a risk percent, plus CLOSE ALL and BE ALL. Interactive chart panel with risk-based sizing; no dependency on any indicator. Runs as an Expert Advisor attached to a single chart. No DLL calls
SignalX ATR Stop Planner
Ahmed Ismail Muhammad Ismail Al Talhat
What this is A planning tool that projects a volatility-based stop and target onto the chart and tells you the lot size that a fixed risk percent implies at that distance. Useful before you commit to a trade, and useful for building the habit of sizing from risk rather than from feeling. What it does Draws ATR-based stop and target levels and shows the lot size for a fixed risk percent. Volatility-adaptive stop projection drawn live on the chart. Runs as an Expert Advisor attached to a single ch
SignalX Break Even Guardian
Ahmed Ismail Muhammad Ismail Al Talhat
What this is A trade manager that works in R multiples. Once a position reaches a chosen R multiple it protects the trade, optionally takes partial profit, and only then starts trailing. It never opens trades. What it does Moves stops to break-even at a chosen R multiple, optionally takes a partial close, then trails. R-multiple driven management rather than fixed pip triggers; partial-close state persisted globally. Runs as an Expert Advisor attached to a single chart. No DLL calls. No external
SignalX Daily Risk Guard
Ahmed Ismail Muhammad Ismail Al Talhat
What this is An account-level circuit breaker. It watches the day's closed results plus floating profit and loss, and when a daily loss limit or a maximum trade count is reached it can stop new orders on the panel and flatten what is open. What it does Stops the day when a loss limit or a max-trade count is reached, and can flatten open positions. Account-level daily circuit breaker computed from closed history plus floating P/L. Runs as an Expert Advisor attached to a single chart. No DLL calls
SignalX Spread Monitor
Ahmed Ismail Muhammad Ismail Al Talhat
What this is A small on-chart readout of current spread, with a warning threshold, a colour state and an optional countdown to the next candle. Spread is a cost that most EAs and most manual traders simply do not measure. What it does Live spread versus 60-bar average, current session bucket, and seconds to the next bar close. Combines spread context, session awareness and bar timing in one compact panel. Runs as an Expert Advisor attached to a single chart. No DLL calls. No external services. N
SignalX Trade Journal Export
Ahmed Ismail Muhammad Ismail Al Talhat
What this is Writes your closed trade history to a CSV file on a timer or every tick, including commission and swap, with a totals row at the end. The point is a clean spreadsheet you can actually analyse offline instead of screenshots. What it does Writes the full closed-trade history to a CSV with a totals row, on a timer or every tick. Clean spreadsheet output including commission, swap and a computed total. Runs as an Expert Advisor attached to a single chart. No DLL calls. No external servi
SignalX Account Pulse
Ahmed Ismail Muhammad Ismail Al Talhat
What this is A free single-strip readout of the numbers that decide whether an account survives a bad hour: equity, free margin, margin level with a colour state that warns before the margin call, floating profit and loss, and the current spread measured against its sixty-bar average. It takes no decisions for you and it is free on purpose. What it does Free strip showing equity, free margin, margin level with margin-call colouring, floating P/L and current spread against its 60-bar average. Fre
FREE
SignalX Exposure Lens
Ahmed Ismail Muhammad Ismail Al Talhat
What this is Most multi-pair traders think in positions, not in currencies. Three long EURUSD trades and one short EURJPY feel diversified, but the book is really one large long EUR position. Exposure Lens opens every trade, splits it into its base and quote leg, nets every leg of the same currency together, converts the result into your account currency and shows what share of your equity each currency actually represents. What it does Nets every open position into per-currency long/short expos
SignalX Order Session Guard
Ahmed Ismail Muhammad Ismail Al Talhat
What this is Pending orders left overnight and positions carried through the weekend are two of the most common ways a planned trade turns into an unplanned risk. This utility handles the clock for you: it cancels pending orders that have been sitting for longer than you allow, closes everything at a session end time you choose, and forces a cut-off before the Friday close. What it does Expires stale pending orders, flattens all positions at a chosen session end time, and forces a Friday cut-off
SignalX Range Compression Scanner
Ahmed Ismail Muhammad Ismail Al Talhat
What this is Ranges compress before they expand. This indicator finds the bars where the Bollinger band width is in the lowest percentage of a lookback window and where the compression has lasted for a minimum number of bars, then draws each zone as a box with the upper and lower breakout levels extended to the right and the box height in points. What it does Marks historical squeeze zones where Bollinger width sits in the lowest x% of the lookback, boxes each run, extends the two breakout level
SignalX Volatility Regime Gauge
Ahmed Ismail Muhammad Ismail Al Talhat
What this is An ATR value of 12 points means very different things on EURUSD H1 and on gold M5. This indicator turns ATR into a percentile: the current ATR is ranked against the previous bars, and the result is plotted on a 0 to 100 scale with four bands. 20 means the market is quieter than 80 percent of the recent past; 90 means it is near the most volatile reading of the window. What it does Plots the percentile rank of ATR over a lookback window as a 0-100 oscillator with LOW / NORMAL / ACTIV
SignalX Currency Strength Meter
Ahmed Ismail Muhammad Ismail Al Talhat
What this is A currency is not strong or weak on its own; it is strong or weak against the others. This dashboard builds one score per major currency by measuring the change of every pair that currency appears in and crediting the base side with that change while debiting the quote side by the same amount. Averaging those credits gives eight numbers that can be compared directly. What it does Builds one strength score per currency from the change of every pair it appears in, and ranks all eight
SignalX Daily Range Envelope
Ahmed Ismail Muhammad Ismail Al Talhat
What this is Every symbol has a typical day. When a symbol has already travelled most of that distance, the rest of the day usually holds less, and a breakout strategy that works on a fresh day can stall on a spent one. This indicator measures the average daily range from history and projects half, three quarters and all of it above and below today open, so the scale of the current move is obvious at a glance. What it does Measures the average daily range over N days and projects 50%, 75% and 10
SignalX Hourly Range Stats
Ahmed Ismail Muhammad Ismail Al Talhat
What this is Not every hour of the trading day moves the same amount, and the difference matters: a breakout at a dead hour is far more likely to fail than the same setup during the session when the symbol actually travels. This indicator averages the high-low range of each hour of the server day over a number of days and shows all twenty-four hours as a ranked table. What it does Averages the high-low range of every hour of the server day over N days and ranks all 24 hours with a bar and a perc
SignalX Level Alert Grid
Ahmed Ismail Muhammad Ismail Al Talhat
What this is Watching several charts for a handful of price levels is a poor use of attention. This tool watches the levels for you. You type a list such as 1.0850;1.0900;EURUSD 1.2700 into one input, and it alerts when price approaches, touches or crosses each level. Every level fires once, so an alert means something happened rather than repeating all day. What it does Watches a list of price levels, on one symbol or several, and alerts on approach, touch and cross, each firing once per level.
SignalX Margin Buffer Guard
Ahmed Ismail Muhammad Ismail Al Talhat
What this is When margin runs low, the broker closes whatever it decides to close, usually the largest position and usually at the worst moment. This utility acts before that point with two stages: an alert at a warning level you set, and then an orderly close of the least profitable position once a lower level is reached, pausing between closes and stopping as soon as margin recovers. What it does Warns at one margin level and starts closing the least profitable position, one at a time with a c
SignalX Pending Order Grid
Ahmed Ismail Muhammad Ismail Al Talhat
What this is Placing a ladder of pending orders by hand is slow and error-prone, and one mistyped lot size turns a plan into an accident. This tool builds the whole ladder in one action: a fixed number of levels per side, a fixed distance between them, one lot size, and optional stop loss and take profit in points. Before anything is sent it draws exactly where the orders would sit, and it only places them when you set the arming input to true. What it does Places a symmetric ladder of buy-limit
SignalX Pivot Levels
Ahmed Ismail Muhammad Ismail Al Talhat
What this is Pivot levels give a reference frame for the day without any indicator clutter: where the previous period balance sits, and where the likely support and resistance are. This indicator draws daily, weekly and monthly pivots at once, in classic, Fibonacci, Camarilla or Woodie form, labelled with their prices. What it does Draws daily, weekly and monthly pivots at once in one of four methods: classic, Fibonacci, Camarilla or Woodie. Three timeframes of pivot structure in one tool with t
SignalX Prop Challenge Tracker
Ahmed Ismail Muhammad Ismail Al Talhat
What this is Evaluation accounts are scored on rules, not on feelings, and the rules are unforgiving in one direction: a profit target is a goal, but a daily loss limit or a maximum drawdown is a hard stop. This tracker keeps all three numbers on the chart at once, measured from the starting balance you enter, so the distance between where the account is and where it is allowed to go is always visible. What it does Tracks profit-target progress, worst daily loss and worst total loss against the
SignalX Spread History Export
Ahmed Ismail Muhammad Ismail Al Talhat
What this is The spread you are quoted is a cost you pay on every trade, and most traders never measure it. This recorder samples the spread on a schedule, for one symbol or for everything in Market Watch, and appends it to a CSV file inside the terminal data folder. The result is a record you can open in a spreadsheet and use to compare hours, days and brokers. What it does Samples live spread on a fixed interval, one symbol or the whole Market Watch, and appends time / symbol / spread / ask /
SignalX Weekend Gap Detector
Ahmed Ismail Muhammad Ismail Al Talhat
What this is Weekend gaps are one of the few market events that can be measured exactly on your own chart. This indicator marks every gap between the Friday close and the Monday open, draws it as a zone, and reports what share of the recent gaps were filled and how long the fill took on average for this symbol. What it does Finds every weekend gap, draws it as a zone and reports what share of the last N gaps were filled and how many bars the fill took on average. Converts a folk belief into a pe
Visual Lot Size Calculator
Ahmed Ismail Muhammad Ismail Al Talhat
Visual trade planning and lot calculation utility for MetaTrader 5. Description: This utility allows traders to plan their entries visually directly on the chart. By using interactive graphical boxes, you can define your entry, stop loss, and take profit levels before opening a position. The software automatically calculates the required volume (lots) based on your account settings. It provides real-time data updates as you move the graphical elements on the screen. Key Features: Interactive In
SignalX Spread Monitor MT5
Ahmed Ismail Muhammad Ismail Al Talhat
What this is A small on-chart readout of current spread, with a warning threshold, a colour state and an optional countdown to the next candle. Spread is a cost that most EAs and most manual traders simply do not measure. What it does On-chart readout of current spread in points, its 60-bar average, spread against a warning level, the active session and a countdown to the next bar close. Puts the cost of the trade on the chart next to the price, with a warning state, instead of hiding it in the
SignalX Account Pulse MT5
Ahmed Ismail Muhammad Ismail Al Talhat
What this is A free single-strip readout of the numbers that decide whether an account survives a bad hour: equity, free margin, margin level with a colour state that warns before the margin call, floating profit and loss, and the current spread measured against its sixty-bar average. It takes no decisions for you and it is free on purpose. What it does Free strip showing equity, free margin, margin level with margin-call colouring, floating P/L, open position count and current spread against it
FREE
SignalX Level Alert Grid MT5
Ahmed Ismail Muhammad Ismail Al Talhat
What this is Watching several charts for a handful of price levels is a poor use of attention. This tool watches the levels for you. You type a list such as 1.0850;1.0900;EURUSD 1.2700 into one input, and it alerts when price approaches, touches or crosses each level. Every level fires once, so an alert means something happened rather than repeating all day. What it does Watches a list of price levels, on one symbol or several, and alerts on approach, touch and cross, each firing once per level.
SignalX Session Range Levels MT5
Ahmed Ismail Muhammad Ismail Al Talhat
What this is Draws the high and low of a configurable session window together with the recent range history, so the levels that price has repeatedly reacted to are visible without hand-drawing them every day. What it does Marks the high and low of a configurable session window and keeps the last N sessions on the chart as boxes, with breakout levels extended to the right and each box labelled with its range in points. Session structure on demand at any hour window, drawn as the actual tradable b
SignalX Volatility Regime Gauge MT5
Ahmed Ismail Muhammad Ismail Al Talhat
What this is An ATR value of 12 points means very different things on EURUSD H1 and on gold M5. This indicator turns ATR into a percentile: the current ATR is ranked against the previous bars, and the result is plotted on a 0 to 100 scale with four bands. 20 means the market is quieter than 80 percent of the recent past; 90 means it is near the most volatile reading of the window. What it does Plots the percentile rank of ATR over a lookback window as a 0-100 oscillator with LOW / NORMAL / ACTIV
Filtrele:
Değerlendirme yok
Değerlendirmeye yanıt