Session Flow Map MT5

SessionFlowMap — POC Seviyeli Çoklu Seans Hacim ve Delta Profili

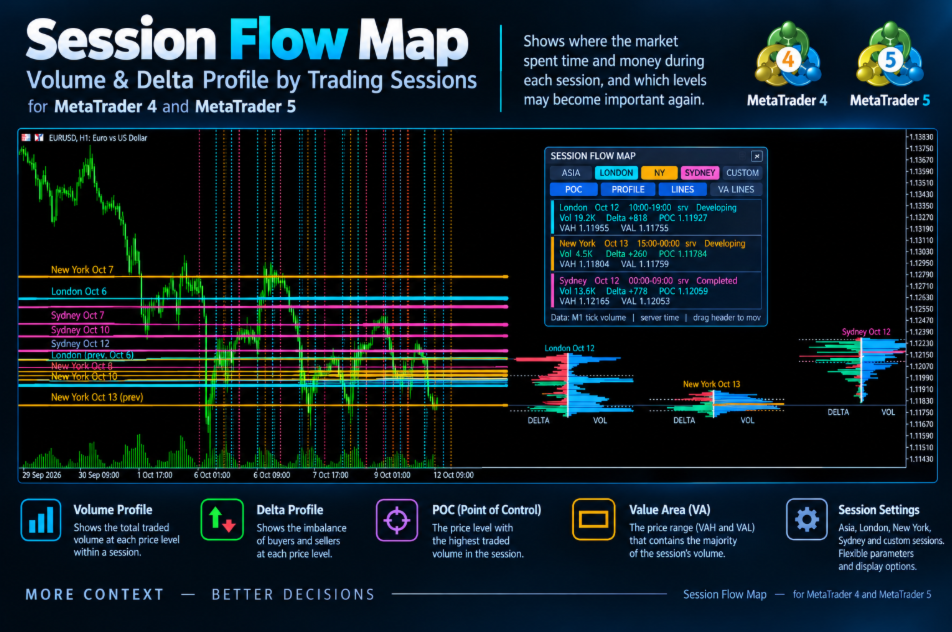
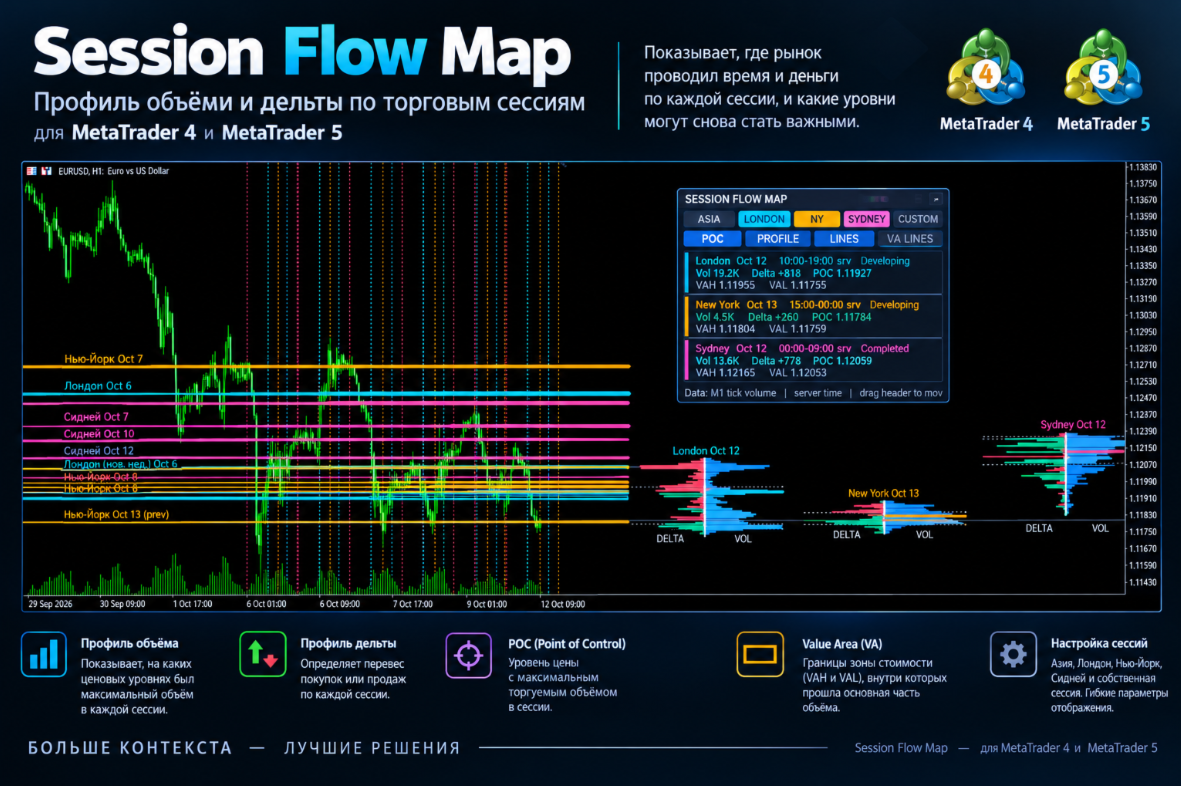
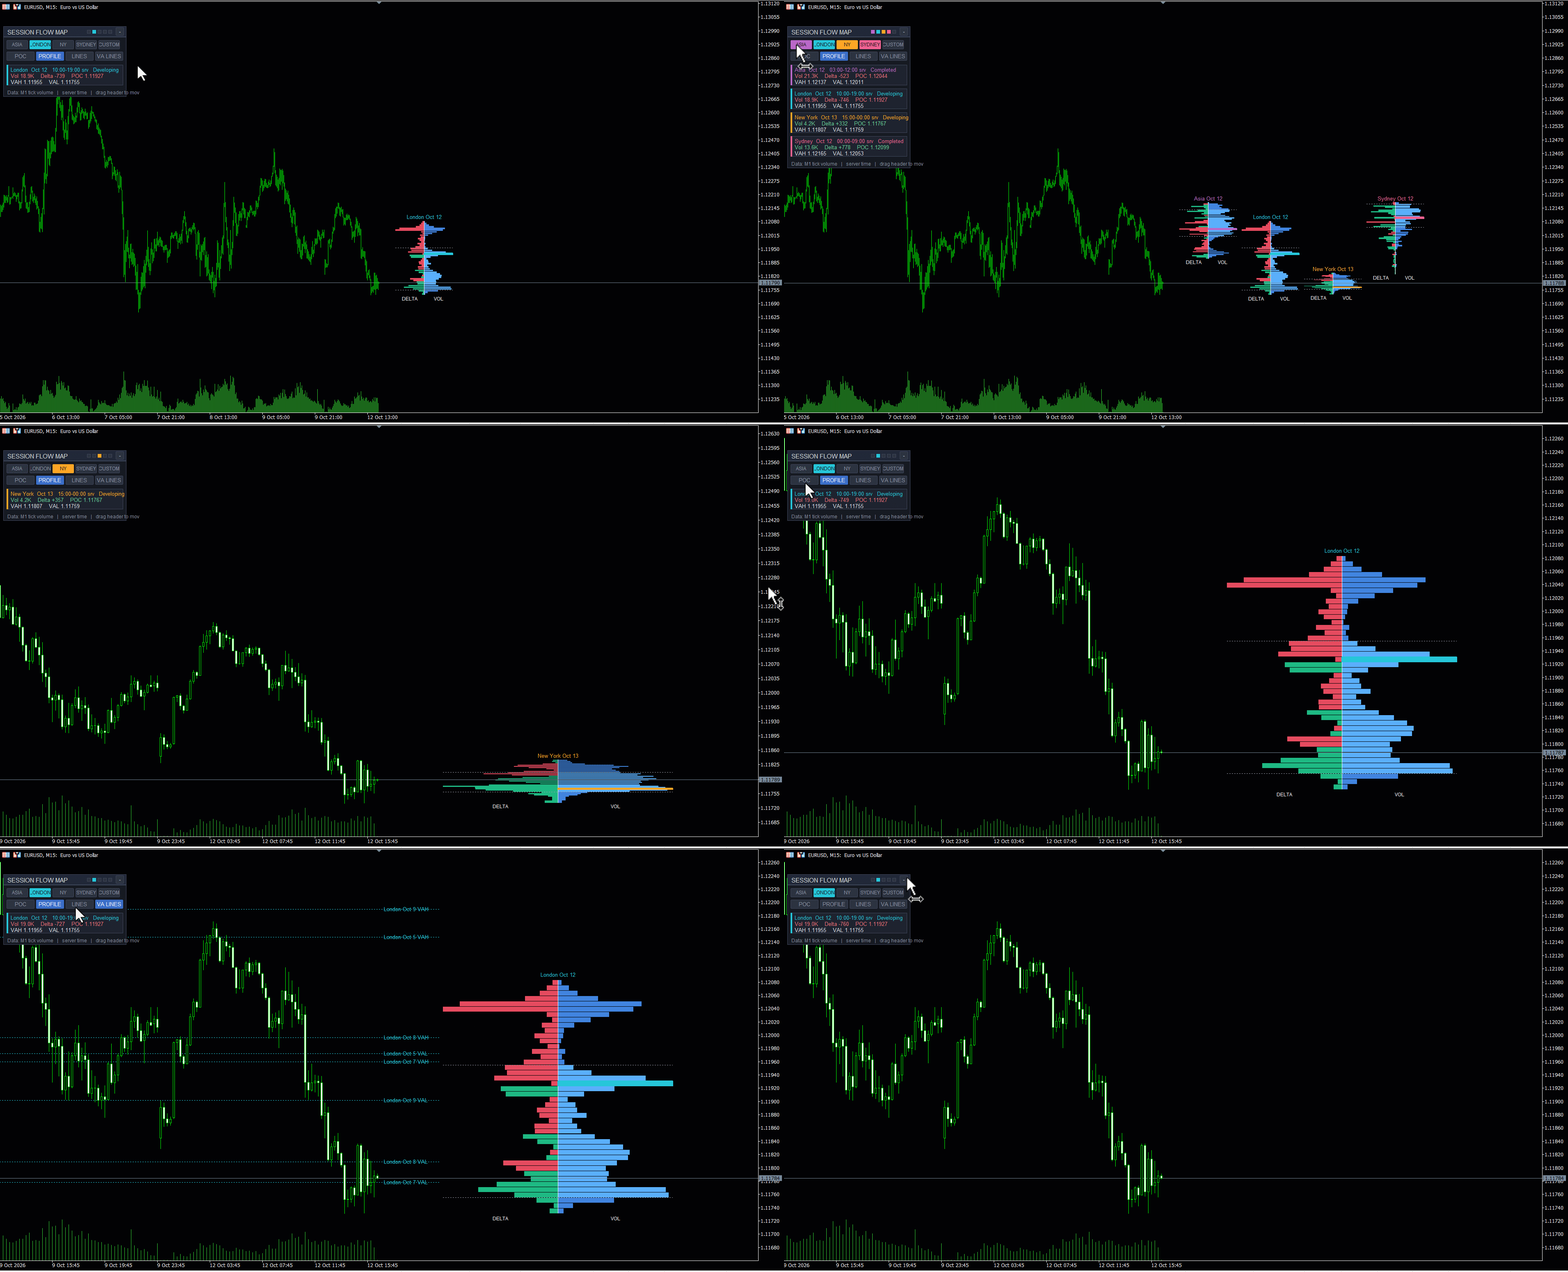
SessionFlowMap, forex işlem gününün seansları (Asya, Londra, New York ve isteğe bağlı olarak Sidney ile özel bir seans) için hacim profili ve delta profili (alım ve satım dengesizliği) oluşturur ve doğrudan grafik üzerinde gösterir. Her seans için POC'yi (Point of Control — en yüksek işlem hacmine sahip fiyat) ve Value Area'yı (VAH ve VAL — hacmin büyük bölümünü barındıran aralık) bulur, bu seviyeleri yatay çizgiler olarak sağa doğru uzatır. Piyasanın her seansta zamanı ve parayı nerede harcadığını ve hangi seviyelerin yeniden önem kazanabileceğini bir bakışta görebilirsiniz.

MT4-version: https://www.mql5.com/en/market/product/200941

Nasıl çalışır

  • Her seans, kendi saatlerine göre M1 geçmişinden kesilir. Asya, Londra, New York ve Sidney saatleri GMT olarak ayarlanır ve aracı kurumunuzun sunucu saatine otomatik olarak çevrilir. Özel seans doğrudan sunucu saatini kullanır.
  • Seansın fiyat aralığı fiyat satırlarına bölünür (hedef sayıyı siz belirlersiniz) ve hacim bu satırlara dağıtılır. Forex'te merkezi bir hacim yoktur, bu nedenle tick hacmi kullanılır.
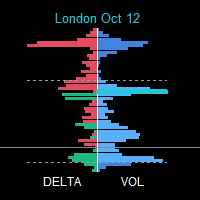
  • Hacim profili, her satırdaki toplam hacimdir. Delta profili, her satırdaki alım hacmi eksi satım hacmidir (yeşil: alıcılar baskın, kırmızı: satıcılar baskın).
  • «M1 bars» modunda alım/satım dağılımı, her mumun kapanışının kendi aralığı içindeki konumuna göre tahmin edilir. «Real ticks» modunda ise her tick'in yönünden (aracı kurum sağlıyorsa BUY/SELL bayraklarından) hesaplanır.
  • POC, hacmi en yüksek olan satırdır. Value Area, POC'den başlayarak seçilen hacim yüzdesini (varsayılan %70) kapsayana kadar genişler; böylece VAH ve VAL belirlenir.
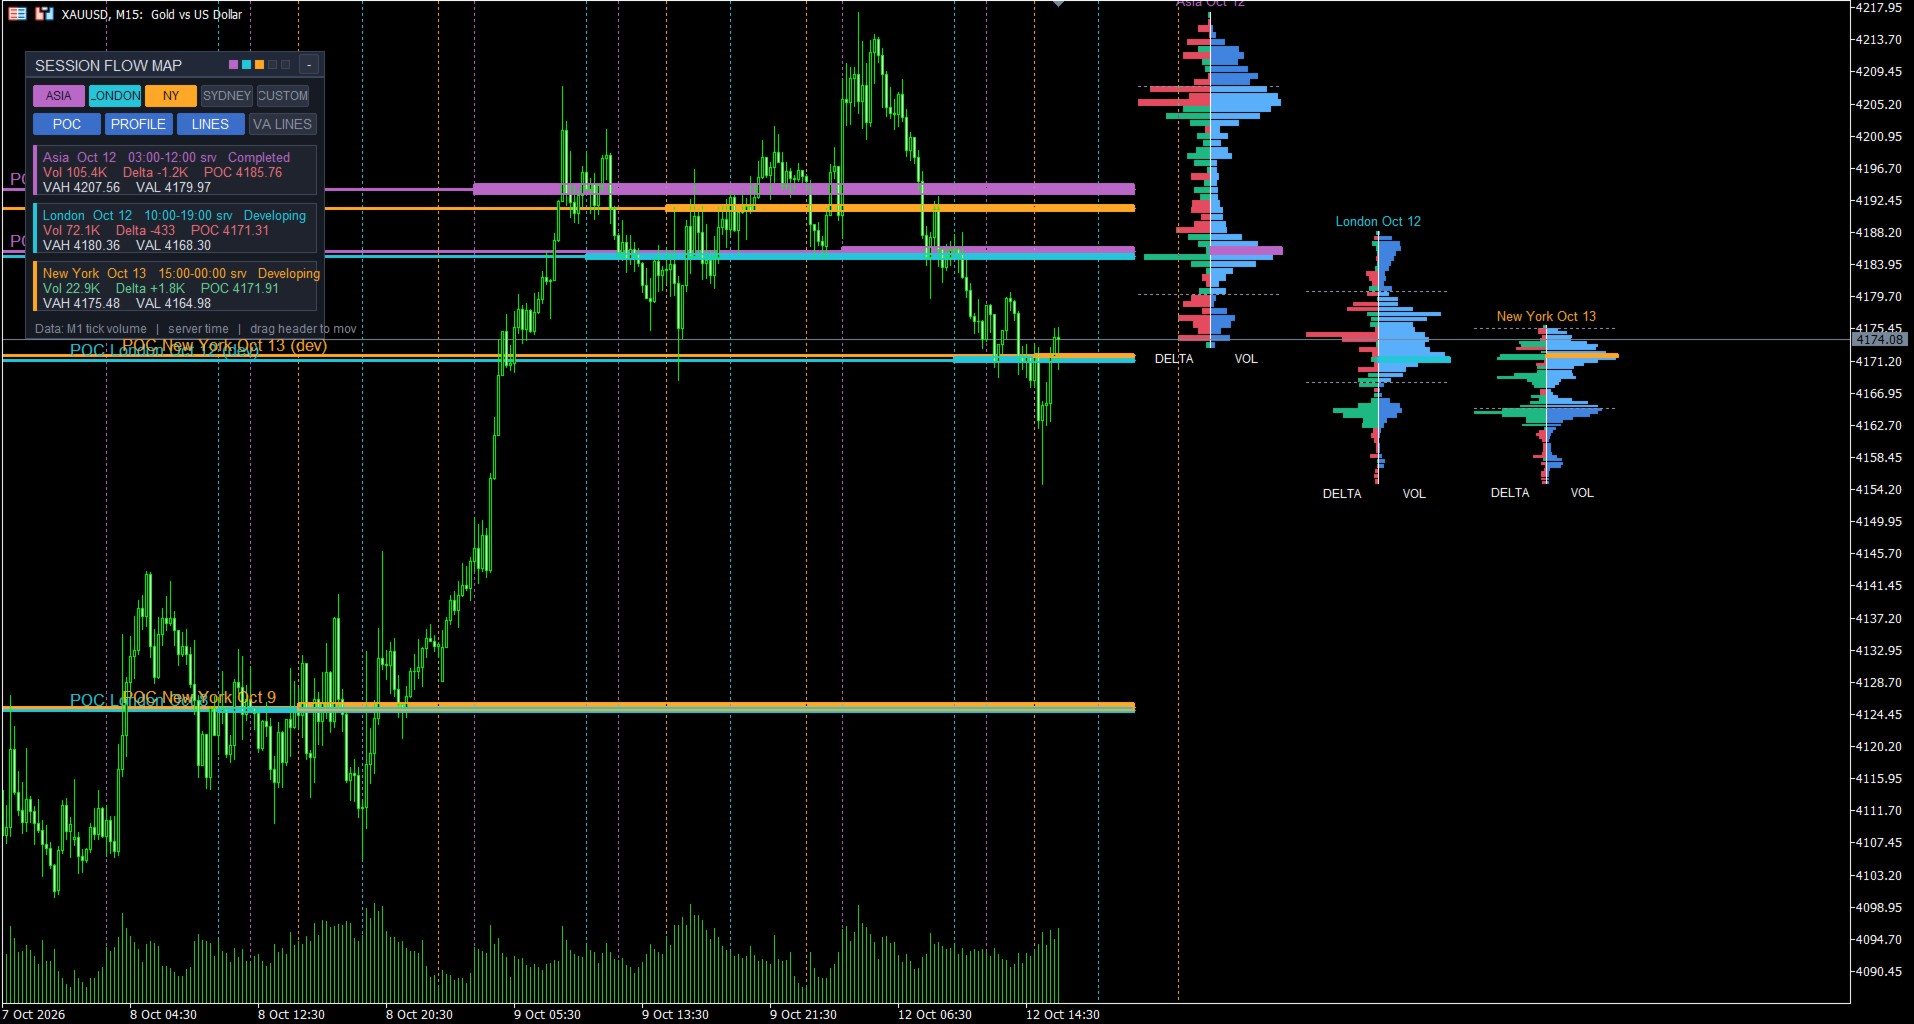
  • Her seansın en son profili, son mumun sağında bir küme olarak (hacim ve delta bir ayırıcı çizgi etrafında sırt sırta) veya grafikte seansın kendi aralığı içinde çizilir. POC bir bölge ve/veya çizgi olarak gösterilir; tüm grafiği kat eden uzun bir çizginin sol üstünde etiketi bulunur. Önceki seansların POC'leri referans seviyeleri olarak grafikte kalır.
  • Dikey çizgiler her seansın başlangıcını ve bitişini işaretler. Her seansın kendi rengi vardır.

Bir trader nasıl kullanabilir

  • Önceki seansın POC'sini destek veya direnç olarak ve fiyat için bir «mıknatıs» olarak kullanın: fiyat seviyeye döndüğünde tepkisini gözlemleyin.
  • Çıplak POC (naked POC) modu: fiyatın henüz yeniden ziyaret etmediği seviyeler uzatılmış kalır; ilk temastan sonra çizgi durur.
  • VAH ve VAL'i «adil değerin» sınırları olarak izleyin: bölge içinde kabul, dışında ret, Value Area'dan çıkışlar.
  • Delta profili, hangi fiyatlarda alıcıların veya satıcıların baskın olduğunu gösterir; POC'deki deltayı komşu satırlarla karşılaştırın.
  • Seans bağlamı: Asya aralığı, Londra ve New York POC'lerinin buna göre konumu, Londra ile New York'un çakışma saatleri.
  • Çakışma (confluence): farklı seansların ve günlerin POC'leri birbirine yakınsa daha önemli bir bölge oluşur.
  • Uyarılar, fiyat uzatılmış seviyelere döndüğünde sizi bilgilendirir.
  • Her sembolde ve zaman diliminde çalışır (profiller M1'den oluşturulur); en yaygın kullanım M5–H1 aralığıdır.

Panel ve düğmeler

  • Paneli başlığından sürükleyebilir ve «-» düğmesiyle daraltabilirsiniz. Başlıktaki renkli noktalar etkin seansları gösterir.
  • ASIA, LONDON, NY, SYDNEY ve CUSTOM düğmeleri seansları doğrudan grafik üzerinde açıp kapatır.
  • POC, PROFILE, LINES ve VA LINES düğmeleri katmanları açıp kapatır: POC seviyeleri, profiller, dikey seans çizgileri ve uzatılmış VAH/VAL.
  • Her seans için bir kart gösterilir: ad, tarih, sunucu saatiyle seans saatleri, durum (Completed veya Developing), hacim, delta, POC, VAH ve VAL. Alt satır veri kaynağını gösterir.
  • Panelin konumu, daraltılmış durumu ve düğme durumları her grafik için ayrı ayrı hatırlanır.

Gereksinimler

Gerekli dönem için M1 geçmişi yüklenmiş olmalıdır. Grafik kaydırmayı (Chart shift) etkinleştirin ve profil kümeleri için sağda boş alan bırakın.

Ayarlar

1. Sessions

  • «Show Asian session» — Asya seansını etkinleştirir (paneldeki ASIA düğmesi de aynısını yapar).
  • «Asian session hours (GMT, HH:MM-HH:MM)» — Asya seansının GMT olarak başlangıcı ve bitişi, varsayılan 00:00-09:00. Gece yarısını aşan seanslar desteklenir.
  • «Show London session» / «London session hours (GMT, HH:MM-HH:MM)» — Londra seansı, varsayılan 07:00-16:00.
  • «Show New York session» / «New York session hours (GMT, HH:MM-HH:MM)» — New York seansı, varsayılan 12:00-21:00.
  • «Show Sydney session» / «Sydney session hours (GMT, HH:MM-HH:MM)» — Sidney seansı, varsayılan olarak kapalı, saatler 21:00-06:00.
  • «Show custom session (broker day by default)» / «Custom session hours (SERVER time, HH:MM-HH:MM)» — sunucu saatiyle kendi seansınız; varsayılan 00:00-24:00 aracı kurumun tüm günüdür.
  • «Auto-detect broker GMT offset» — sunucunun GMT'ye göre farkı, aracı kurumun yaz saati değişiklikleri dahil otomatik olarak algılanır.
  • «Manual broker GMT offset, hours (if auto is off)» — otomatik algılama kapalıyken kullanılan, saat cinsinden sabit fark.
  • «Skip sessions starting on Saturday/Sunday» — hafta sonu başlayan seansları atlar. İpucu: Londra ve New York saatleri GMT olarak tanımlanmıştır; bu merkezler yaz saatine geçtiğinde saatleri bir saat kaydırın.

2. Data

  • «Data source» — «M1 bars (tick volume, fast)»: bir dakikalık mumlardan hızlı hesaplama; «Real ticks (precise, slower)»: tick'lerden hassas ama daha yavaş hesaplama.
  • «Refresh interval (seconds)» — geçerli seansın ne sıklıkla yeniden hesaplanıp çizileceği. Yeni bir mum, yeniden hesaplamayı hemen başlatır.

3. Volume and delta profiles

  • «Show volume profile» — hacim profilini gösterir.
  • «Show delta profile» — delta profilini gösterir.
  • «Volume profile side (delta is opposite)» — hacmin ayırıcının hangi tarafına çizileceği; delta karşı tarafa çizilir.
  • «Target price rows per session (10-70)» — profilin ayrıntı düzeyi. Nesne sayısı çok fazlaysa satırlar yalnızca çizim için birleştirilir; POC ve Value Area kesin kalır.
  • «Profile placement» — «Shared divider at right»: tüm seansların en son profilleri son mumun sağında yan yana yer alır; «Session edges»: profil, seansın zaman aralığı içine çizilir.
  • «Previous sessions: edge» — önceki profillerin seansın hangi kenarına (sol veya sağ) çizileceği.
  • «Profiles to display» — «Latest session of each type only»: her türün yalnızca en son seansı; «Latest + previous sessions»: önceki seanslar da.
  • «Previous sessions with full profiles (1-10)» — her türden kaç önceki seansın tam profille gösterileceği.
  • «Profile width (% of session, edges mode)» — profilin her yarısının, seans süresinin yüzdesi olarak azami genişliği.
  • «Shared divider: width per side (bars)» — ortak ayırıcı modunda profilin her yarısının mum sayısı cinsinden genişliği.
  • «Shared divider: gap after last bar (bars)» — son mumdan kümeye olan mesafe; profiller fiyatı engelliyorsa artırın.
  • «Show value area high / low lines» — her profilde noktalı VAH ve VAL çizgilerini gösterir.
  • «Value area (%)» — Value Area içindeki hacim oranı, varsayılan 70.
  • «Show volume / delta numbers in rows» — satırların içinde hacim ve delta sayılarını gösterir.
  • «Drawing budget (max histogram boxes)» — terminali hızlı tutmak için histogram nesnelerinin üst sınırı.

4. POC

  • «Show POC» — POC'yi gösterir.
  • «POC display» — «Zone»: POC satırı üzerinde dolu bir bölge; «Line»: bir çizgi.
  • «Zone width basis» — «POC row»: bölge POC satırına eşittir; «Custom points»: merkez etrafında belirlenen genişlikte bir bölge.
  • «Custom zone total width (points)» — «Custom points» modunda bölgenin toplam genişliği (puan).
  • «Extend developing session POC right» — hâlâ oluşmakta olan seansın POC'sini sağa uzatır.
  • «Zone transparency (0-100)» — bölge dolgusunun şeffaflığı.
  • «Zone border width» — bölge kenarlığının kalınlığı.
  • «Show POC center line inside zone» — bölgenin ortasından geçen kesik çizgi.
  • «POC line across the whole chart (extended POCs)» — POC çizgisi geçmişin başından kümeye kadar uzanır, sol üstünde etiketi bulunur.
  • «POC line width» — POC çizgisinin kalınlığı.

5. Previous sessions levels

  • «Extend previous sessions' POC right» — tamamlanmış seansların POC'lerini sağa uzatır.
  • «Previous sessions to extend per session type (1-30)» — her türden son tamamlanmış kaç seansın uzatılacağı.
  • «Allow incomplete sessions in history» — verisi eksik seansların seviyelerinin de uzatılmasına izin verir (yıldız * ile işaretlenir).
  • «Show dated level labels» — seans adı ve tarihi içeren seviye etiketlerini gösterir.
  • «Naked POC mode: stop extension at first revisit» — fiyat POC'ye ilk kez döndüğü anda çizgi durur.
  • «Also extend previous VAH / VAL right» — önceki seansların VAH ve VAL seviyelerini de uzatır.
  • «Extension length to the right (bars)» — küme çizgileri sınırlamadığında sağa uzatmanın mum sayısı cinsinden uzunluğu.
  • «Stop extended lines before the profile cluster (shared divider mode)» — uzatılmış çizgiler profil kümesinden önce biter, böylece küme temiz kalır.

6. Colors

  • «Asian session color», «London session color», «New York session color», «Sydney session color», «Custom session color» — seans renkleri: POC, çizgiler, etiketler ve panel kartları.
  • «Volume» — hacim histogramının rengi.
  • «Volume inside value area» — Value Area içindeki hacmin rengi.
  • «Positive delta» / «Negative delta» — pozitif ve negatif delta renkleri.
  • «Value area lines» — VAH ve VAL çizgilerinin rengi.
  • «Profile transparency (0-100)» — histogramların şeffaflığı.
  • «Show profile titles» — profillerin üstünde (seans adı ve tarih) ve altında (VOL ve DELTA) başlıklar.

7. Alerts

  • «Alert when price touches extended POC / VAH / VAL» — fiyat uzatılmış seviyelere dokunduğunda uyarıyı etkinleştirir (uzatmaları açıksa VAH ve VAL dahil).
  • «Popup alert» — açılır pencere.
  • «Push notification» — mobil uygulamaya anlık bildirim.
  • «Sound alert» — sesli sinyal.
  • «Touch tolerance (points)» — dokunma toleransı (puan).

8. Panel

  • «Show interactive panel (drag header, buttons)» — düğmeli paneli gösterir.
  • «Panel start X (drag header to move)» / «Panel start Y (drag header to move)» — panelin başlangıç konumu; sonrasında fareyle sürükleyebilirsiniz.

9. Session lines

  • «Show vertical lines at session start / end» — seansların başlangıcında ve bitişinde dikey çizgiler gösterir.
  • «Session lines style» — bu çizgilerin stili.
Önerilen ürünler
Master Edition, piyasa yapısını hacim ve para akışı merceğinden görselleştirmek için tasarlanmış profesyonel kalitede bir analiz aracıdır. Standart hacim göstergelerinin aksine, bu araç doğrudan grafiğinizde bir Günlük Hacim Profili görüntüleyerek, fiyat keşfinin tam olarak nerede gerçekleştiğini ve "akıllı paranın" nerede konumlandığını görmenizi sağlar. Bu Master Edition, netlik ve hız için tasarlanmıştır ve yüklendiğinde grafik düzeninizi anında güzelleştiren benzersiz bir Otomatik Tema Senkr
Value Chart Candlesticks
Flavio Javier Jarabeck
4.57 (14)
The idea of a Value Chart indicator was presented in the very good book I read back in 2020 , " Dynamic Trading Indicators: Winning with Value Charts and Price Action Profile ", from the authors Mark Helweg and David Stendahl. The idea is simple and the result is pure genius: Present candlestick Price analysis in a detrended way! HOW TO READ THIS INDICATOR Look for Overbought and Oversold levels. Of course, you will need to test the settings a lot to find the "correct" one for your approach. It
FREE
Simple QM Pattern MT5
Suvashish Halder
3.75 (4)
Simple QM Pattern   is a powerful and intuitive trading indicator designed to simplify the identification of the Quasimodo (QM) trading pattern. The QM pattern is widely recognized among traders for effectively signaling potential   reversals   by highlighting key market structures and price action formations. This indicator helps traders easily visualize the QM pattern directly on their charts, making it straightforward even for those who are new to pattern trading. Simple QM Pattern includes d
FREE
Volume Profile FREE — Multi-Session Heatmap (POC · VAH · VAL) See where trading activity actually occurs—not just where price moves. This indicator builds a clear, color-coded Volume Profile Heatmap directly on your chart and highlights the market's most important price levels: the Point of Control (POC) and the Value Area (VAH/VAL) , where price is most likely to react.
FREE
Fixed Volume Profile
Carlos Pascual Perez Maturano
This indicator, titled "Fixed Volume Profile.mq5", is a custom tool for MetaTrader 5 (MQL5) designed to calculate and display a Volume Profile over a user-defined fixed time range. The Volume Profile shows the distribution of trading volume at different price levels during a specific period, helping to identify areas of high activity (such as Points of Control or POCs) and volume-based support/resistance areas. Main Functionality: Interactive Range: The indicator creates two vertical lines on
FREE
The   Visual Volatility Clustering   indicator clusters the market based on volatility. The indicator does not redraw and gives accurate data, does not use closing prices. Uses the opening prices or the highs or lows of the previous completed bar. Therefore, all information will be clear and unambiguous. The essence of the indicator is to divide the price market into certain areas according to a similar type of volatility. This can be done in any way. In this example, the indicator is configure
Haven Volume Profile
Maksim Tarutin
4.64 (14)
Haven Volume Profile, ticaret hacminin dağılımına dayalı olarak önemli fiyat seviyelerini belirlemeye yardımcı olan çok fonksiyonlu bir hacim profili analiz göstergesidir. Piyasayı daha iyi anlamak ve önemli giriş ve çıkış noktalarını belirlemek isteyen profesyonel yatırımcılar için tasarlanmıştır. Diğer Ürünler ->  BURADAN Temel Özellikler: Point of Control (POC) Hesaplama - en yüksek ticaret aktivitesinin gerçekleştiği seviye, en likit seviyeleri belirlemeye yardımcı olur Value Area (yüksek ak
FREE
Blahtech VWAP MT5
Blahtech Limited
5 (1)
Blahtech VWAP - Volume Weighted Average Price (VWAP) is the ratio of price to total volume. It provides an average price over a specified time interval.  Links [  Install  |  Update  |  Documentation   ] Feature Highlights Configurable VWAP Line Sessions, intervals, anchored or continuous Previous day settlement line Standard Deviation bands Alerts at bar close or real time Automatic Broker or Tick volumes Significantly reduced CPU usage Input Parameters Expert Advisor Mode  - Reserved for iCu
FREE
Ospe POC Volume Profile
Nur Azureen Binti Ab Aziz
A volume-at-price heatmap with POC, value area, estimated buy/sell pressure, confirmed signals and alerts. POC Volume Profile Heatmap is a MetaTrader 5 indicator that organizes historical volume across price levels. It identifies the Point of Control, displays the selected value area, and estimates buying and selling pressure at the POC. The indicator is intended for traders who use volume-at-price structure to study acceptance, rejection and interaction around high-activity price levels. It c
FREE
The Horizontal Ray Tool is a lightweight, professional charting utility designed to streamline support and resistance mapping on MetaTrader 5. It brings rapid, one-click horizontal level placement directly to your live chart, eliminating the workspace clutter associated with infinite horizontal lines or manually drawn trendlines. Key Features: Interactive On-Screen Button: Spawns a clean, responsive "DRAW RAY" button docked directly on your chart canvas. A single click drops an independent hor
FREE
Smart SMC FVG
Ekkasawat Pitichalermroch
SMC + Volume Profile + FVG: Indicator Guide Overview SMC + Volume Profile + FVG is an all-in-one indicator for MetaTrader 5. It combines three popular price-action tools on a single chart: Smart Money Concepts (SMC): market structure (swings, BOS, CHoCH) and Order Blocks Fair Value Gaps (FVG): price imbalances left behind by fast moves Volume Profile: where the most trading happened, shown as POC, Value Area High and Value Area Low Everything is drawn automatically. You can turn each part on or
Enhanced Volume Profile: The Ultimate Order Flow & Liquidity Analysis Tool Overview Enhanced Volume Profile is an indicator for MetaTrader 5 that displays the traded volume at specific price levels over a defined period. It separates the total volume into buy and sell components, presenting them as a side-by-side histogram on the chart. This allows users to observe the volume distribution and the proportion of buy and sell volumes at each price level. Graphics Rendering The indicator uses the
FREE
Session Profiles
Basharat Umar Khan
Short Description Draws rolling Time-Price-Opportunity (TPO) and footprint volume profiles for the Asia, London, and New York sessions with POC/VAH/VAL levels, delta volume bias, order flow overlays, liquidity heatmaps, developing rolling lines, Naked POC (NPOC) tracking, Initial Balance breakouts, multi-session confluence zones, and automatic broker GMT-offset detection. Full Description Plots separate market-profile and volume-profile style histograms for the three major trading sessions (Asi
FREE
Blahtech Supply Demand MT5
Blahtech Limited
4.57 (14)
Was: $299  Now: $99  Supply Demand uses previous price action to identify potential imbalances between buyers and sellers. The key is to identify the better odds zones, not just the untouched ones. Blahtech Supply Demand indicator delivers functionality previously unavailable on any trading platform. This 4-in-1 indicator not only highlights the higher probability zones using a multi-criteria strength engine, but also combines it with multi-timeframe trend analysis, previously confirmed swings a
Volume-to-Price Movement Oscillator (VP Oscillator) for MT5 The VP Oscillator highlights the balance (or imbalance) between trading volume and price movement, helping traders spot hidden accumulation, distribution, or weakening trends. How It Works: Calculates each bar’s price range (High–Low) and tick volume. Normalizes both values over a set period (default: 14). Plots the absolute difference between them ×100 — showing how closely price action aligns with trading activity. Interpretation: Hig
FREE
BoxProfile MT5
Evgeny Shevtsov
4.6 (10)
The indicator displays volume profiles based on the nesting principle. Profiles periods are pre-set so that each subsequent profile has a length twice as long as the length of the previous profile. In addition to profiles, the indicator displays volume clusters sorted by color, depending on the volume they contain. Indicator operation features The indicator works on typical timeframes from M5 to MN, but for calculations uses historical data from smaller timeframes: M1 - for timeframes from M5
FREE
(Special New Year promotion - free price!) The indicator displays the actual 'Scale in points per bar' (identical to the manual setting in the Terminal, see screenshot) in the upper right corner of the chart. The displayed value changes INSTANTLY whenever the chart scale is changed! (This is very convenient when planning screenshots). In Settings: Change language (Russian/English), font size of the displayed text, text label offset coefficient from the graph corner, equally in X and Y directi
FREE
Advanced Volume Profile Liquidity Analysis via Custom Area Selection The Advanced Manual Volume Profile is a precision tool for MetaTrader 5 designed to deconstruct market structure through price-level volume analysis. Unlike static profiles, this indicator exclusively processes the price and time range defined by the user via a rectangle object, offering a surgical view of the market auction. Elite Technical Specifications Dynamic Algorithm: Real-time calculation (400ms refresh rate) based on t
FREE
VP hidden
Emr Aljnaby
4.33 (12)
The indicator works to convert normal volume into levels and determine financial liquidity control points. It is very similar in function to Fixed Volume Profile. But it is considered more accurate and easier to use than the one found on Trading View because it calculates the full trading volumes in each candle and in all the brokers present in MetaTrade, unlike what is found in Trading View, as it only measures the broker’s displayed prices. To follow us on social media platforms: telegram
FREE
Mirror Chart MT5
Andrej Hermann
5 (1)
The Mirror Chart MT5 is a overlay indicator specifically designed to project a second financial instrument directly onto the main chart window. This tool is invaluable for traders who rely on correlation analysis, as it visualizes the price movements of two different instruments in real time. Unlike traditional overlays, this indicator utilizes intelligent, dynamic centering and scaling logic. It continuously analyzes the visible price range in the current window for both symbols and calculates
FREE
The indicator highlights the points that a professional trader sees in ordinary indicators. VisualVol visually displays different volatility indicators on a single scale and a common align. Highlights the excess of volume indicators in color. At the same time, Tick and Real Volume, Actual range, ATR, candle size and return (open-close difference) can be displayed. Thanks to VisualVol, you will see the market periods and the right time for different trading operations. This version is intended f
FREE
ApeX Trade Manager MT5  →     ApeX Journal MT5  →     ApeX Indicator SMC MT5  →     ApeX Indicator ICT Concepts MT5  →     ApeX Indicator Volume Profile MT5  →    ApeX Indicator ICT Macros MT5  → One profile per session tells you about the session. One profile per swing tells you about the trade you are in. ApeX Volume Profile builds a profile for every pivot the market makes. 1. The profile Point of Control — The price where the most volume traded in that leg, optionally extended right or bo
Aggression Volume
Flavio Javier Jarabeck
4.29 (17)
Aggression Volume Indicator is the kind of indicator that is rarely found in the MQL5 community because it is not based on the standard Volume data provided by the Metatrader 5 platform. It requires the scrutiny of all traffic Ticks requested on the platform... That said, Aggression Volume indicator requests all Tick Data from your Broker and processes it to build a very special version of a Volume Indicator, where Buyers and Sellers aggressions are plotted in a form of Histogram. Additionally,
FREE
Daily & Composite Volume Profile   This is a professional-grade market profile tool designed for MetaTrader 5. It utilizes a   Dual-Profile System   to visualize supply, demand, and liquidity concentrations. Key Features Left Side: Daily Session Profiles Automatically identifies the start and end of every trading day. Generates a unique Volume Profile for each individual day. Allows you to see how value migrated from yesterday to today (e.g., Is today's volume higher or lower than yesterday?).
BoxInside MT5
Evgeny Shevtsov
5 (4)
This indicator calculates the volume profile and places labels that correspond to the VAH, VAL and POC levels, for each candle individually. Indicator operation features The indicator works on the timeframes from M3 to MN, but it uses the history data of smaller periods: M1 - for periods from M3 to H1, M5 - for periods from H2 to H12, M30 - for the D1 period, H4 - for the W1 period, D1 - for the MN period. The color and location of the VAL, VAH and POC labels on the current candle are considere
FREE
Here   our more valuable tools SMC Trend Trading   ,  Easy SMC Trading  ,  Institutional SMC Architect Volume Analysis Tools  ,  Volume flow Profile  ,  Market volume profile  , FVG with Volume  , Liquidity Heatmap Profile  ,  Volume Spread Analysis A professional spike pattern indicator built for synthetic traders who scalp and swing Crash 500/300/1000 with precision.  This indicator: Detects powerful 3-candle spike formations (Spike → Pullback → Spike) Automatically draws a clean box a
FREE
Volume Profile Multiple — Algoritmik Ticaret için Buffer Destekli Çoklu Hacim Profili Her zaman diliminde her seferinde Volume Profile'ı bloktan bloğa yeniden çizip yeniden hesaplamaktan yoruldunuz mu? Volume Profile Multiple , grafik üzerinde birbirini takip eden birden çok hacim profilini otomatik olarak çizer ve kurumsal ilginin sadece son görünür aralıkta değil, piyasanın her bölümünde gerçekte nerede yoğunlaştığını ortaya koyar. Bu gösterge sizin için ne yapar? Gösterge, fiyat geçmişini her
Here   our more valuable tools SMC Trend Trading   ,  Easy SMC Trading  ,  Institutional SMC Architect Volume Analysis Tools  ,  Volume flow Profile  ,  Market volume profile  , FVG with Volume  , Liquidity Heatmap Profile  ,  Volume Spread Analysis The    Liquidity Heatmap   is a sophisticated institutional trading tool designed to reveal where over-leveraged traders are trapped. By calculating estimated liquidation levels based on volume spikes and leverage, this indicator draws a dynamic "h
TradeVision Pro
Ian Nganga Comba
TradeVisonPro Forex Analyzer Pro MT5 İşlem Hesabı Analiz ve İzleme Paneli TradeVisonPro Forex Analyzer Pro, MetaTrader 5 kullanıcıları için tasarlanmış bir işlem analizi ve hesap izleme çözümüdür. Ürün, MT5 işlem verilerini yapılandırılmış web tabanlı bir panelde düzenleyerek yatırımcıların hesap bilgilerini görüntülemesine, açık pozisyonları izlemesine, işlem geçmişini analiz etmesine, stratejileri takip etmesine, işlem günlüğü tutmasına ve performans istatistiklerini incelemesine olanak tanır.
FREE
Deviation Trend Profile Overview Deviation Trend Profile is a MetaTrader 5 chart indicator that combines three visual layers in a single chart window: a moving average with momentum-based coloring, deviation bands calculated from volatility, and a horizontal distribution profile drawn to the right of the current price. The indicator is an analytical tool. It does not open, modify or close trades, and it is not a complete trading system. It is designed to help the user observe trend direction, mo
FREE
Bu ürünün alıcıları ayrıca şunları da satın alıyor
Trend Sniper X
Sarvarbek Abduvoxobov
4.9 (41)
Trend Sniper X , tüccarların trend yönünü ve olası dönüş noktalarını netlik ve hassasiyetle belirlemelerine yardımcı olan MetaTrader 5 için çoklu zaman dilimli bir trend takip göstergesidir. MT4 için: https://www.mql5.com/en/market/product/193245 Fiyat Bilgisi: Mevcut fiyat tanıtım amaçlıdır ve gelecek güncellemeler ile yeni özellikler yayınlandıkça değişebilir. Bonus Fırsatı: Bu indikatör için ÜCRETSİZ Oto-Trade Assistant EA'yı almak için lütfen satın aldıktan sonra yazara mesaj gönderin. Code
Smart Trend Trading System — MetaTrader 5 Satın aldıktan sonra Smart Universal Expert Advisor'ı ÜCRETSİZ edinmek ve beraberinde çevrimiçi kurs, PDF kılavuzu ve özel gruba erişim almak için MQL5 üzerinden bana mesaj gönderin. STTS; trend yönünü, giriş ve çıkış sinyallerini, dönüş bölgelerini ve önemli fiyat seviyelerini doğrudan grafiğinizde bir araya getirir. Sistemi manuel işlemler için kullanabilir veya ayrı bir uyumlu EA’yı bağlayarak seçtiğiniz ayarlarla otomatik işlem gerçekleştirebilirsini
Efsane geri dönüyor: Entry Points Pro 10. MQL5 Market'te 3 yıl boyunca ilk 3'te kalan efsanevi indikatörün yeniden lansmanı. Yüzlerce övgü dolu yorum (iki sürümde toplam 589), her gün binlerce trader onunla işlem yapıyor, 31.000+ demo indirmesi   MT4+MT5 . Beş yıl boyunca yazdığınız her yorumu okudum — ve söz vermek yerine yanıtları 10. sürümün içine işledim. 1999'dan beri piyasada olan ve dürüstlüğe, itibarına ve müşterilerine değer veren bir yazardan. Entry Points Pro, işleme giriş sinyallerin
Gann Made Easy , bay teorisini kullanarak ticaretin en iyi ilkelerine dayanan, profesyonel ve kullanımı kolay bir Forex ticaret sistemidir. WD Gann. Gösterge, Zararı Durdur ve Kâr Al Seviyeleri dahil olmak üzere doğru SATIN AL ve SAT sinyalleri sağlar. PUSH bildirimlerini kullanarak hareket halindeyken bile işlem yapabilirsiniz. Satın alma işleminden sonra, alım satım talimatlarını ve harika ek göstergeleri ücretsiz olarak almak için lütfen benimle iletişime geçin! Muhtemelen Gann ticaret yöntem
Neuro Poseidon MT5
Daria Rezueva
4.75 (52)
Neuro Poseidon is a new indicator by Daria Rezueva. It combines precise trading signals with adaptive TP/SL levels - creating best possible trades as a result! Message me and get  Neuro Poseidon Assistant  as a gift to automize your trading process! What makes it stand out? 1. Proven profitability on all assets and timeframes 2. Only confirmed BUY and SELL signals present on the chart 3. Adaptive TP & SL levels generated by the software for each trade 4. Easy to understand - suitable for al
Auto Optimized SpeedAngle , sürekli İleriye Dönük Optimizasyon (Walk-Forward Optimization, WFO) yoluyla eğri uydurmayı (curve-fitting) ortadan kaldıran kurumsal düzeyde bir momentum vektörleme sistemidir. Piyasa rejimleri değiştiğinde etkinliğini yitiren statik girdilere güvenmek yerine, gösterge, örneklem dışı (Out-of-Sample, OOS) doğrulama kullanarak parametrelerini dinamik olarak yeniden kalibre eder ve böylece gösterilen sinyallerin geçmişteki rastgele anomalileri değil, gerçek bir istatisti
Merhaba yatırımcılar! Birçok bireysel yatırımcı yavaş web komut dosyaları kullanıyor. Kârlı işlem yapmak için sistematik bir yaklaşım şarttır. Astro AI göstergesi sadece bir grafik üzerindeki görselleştirme değildir. Doğrudan terminal içinde çalışan iki ajandan oluşan gelişmiş bir sinir ağıdır. Sistemin teknik detayları: 1. Ajan 1: Analist (Grafiksel Sinir Ağı – GNN) Piyasa, tek tek fiyat çubuklarından değil, birbirine bağlı verilerden oluşan bir ağdan oluşur. İşlev: Ajan 1, bu karmaşık, d
Adaptive Price Action Engine Göstergeyi al, EA'sı (Uzman Danışman) bedava gelsin Kendi Kendini Optimize Eden Multi-Timeframe Trend ve Mum Formasyonu Analizi Piyasalar sürekli değişir ve her Price Action formasyonu her piyasa koşulunda aynı değere sahip değildir. Adaptive Price Action Engine , değişen piyasa koşullarına uyum sağlamak amacıyla trend yapısını, Multi-Timeframe analizini, mum formasyonlarını ve istatistiksel optimizasyonu tek bir analiz sistemi içerisinde birleştirir. İki Adaptif Mod
M1 Sniper MT5
Oleg Rodin
5 (7)
M1 SNIPER   kullanımı kolay bir işlem göstergesi sistemidir. M1 zaman dilimi için tasarlanmış bir ok göstergesidir. Gösterge, M1 zaman diliminde scalping için bağımsız bir sistem olarak kullanılabilir ve mevcut işlem sisteminizin bir parçası olarak kullanılabilir. Bu işlem sistemi özellikle M1'de işlem yapmak için tasarlanmış olsa da, diğer zaman dilimleriyle de kullanılabilir. Başlangıçta bu yöntemi XAUUSD ve BTCUSD ticareti için tasarladım. Ancak bu yöntemi diğer piyasalarda işlem yaparken de
Divergence Bomber
Ihor Otkydach
4.89 (94)
Bu göstergeyi satın alan herkese aşağıdaki ekstra içerikler ücretsiz olarak sunulmaktadır: Her işlemi otomatik olarak yöneten, Stop Loss ve Take Profit seviyelerini ayarlayan ve işlemleri strateji kurallarına göre kapatan özel yardımcı araç: "Bomber Utility" Göstergenin farklı varlıklar üzerinde kullanılmasına yönelik ayar dosyaları (set dosyaları) Bomber Utility için 3 farklı modda kullanım sunan ayar dosyaları: "Minimum Risk", "Dengeli Risk" ve "Bekle-Gör Stratejisi" Bu ticaret stratejisini
Unix Scalper
Issam Kassas
4 (4)
Unix Scalper — MetaTrader 5 Satın aldıktan sonra Smart Universal Expert Advisor'ı ÜCRETSİZ edinmek ve beraberinde çevrimiçi kurs, PDF kılavuzu ve özel gruba erişim almak için MQL5 üzerinden bana mesaj gönderin. İşlem fırsatını belirleyin. Planı görün. Nasıl işlem yapacağınıza karar verin. UNIX Scalper; piyasa analizini, BUY/SELL/WAIT kararlarını ve Entry, Stop Loss, TP1 ve TP2 seviyelerini düzenli bir panelde bir araya getirir. SİNYALİ VE PLANI GÖRÜN • Net kararlar: BUY, SELL veya WAIT. • Belir
Scalper Vault , başarılı bir scalping için ihtiyacınız olan her şeyi size sağlayan profesyonel bir scalping sistemidir. Bu gösterge, forex ve ikili opsiyon tüccarları tarafından kullanılabilecek eksiksiz bir ticaret sistemidir. Önerilen zaman çerçevesi M5'tir. Sistem size trend yönünde doğru ok sinyalleri sağlar. Ayrıca size üst ve alt sinyaller ve Gann piyasa seviyeleri sağlar. Göstergeler, PUSH bildirimleri dahil her türlü uyarıyı sağlar. Göstergeyi satın aldıktan sonra lütfen benimle iletişim
RelicusRoad Pro MT5
Relicus LLC
4.96 (25)
İşlemlerinizi tahminle yapmayı bırakın. Ne zaman gireceğinizi, nereden çıkacağınızı ve piyasanın hangi yöne eğildiğini, hepsini tek grafikte görün. RelicusRoad Pro, neredeyse yirmi aracı tek bir göstergede toplar; işlem tarzınıza uyan araçları açarsınız. Net girişler. Net çıkışlar. Her grafikte bir plan. Tanıdık geliyor mu? Alım yaparsınız, bir dakika sonra fiyat aleyhinize döner. Erken kapatırsınız, sonra hareketin sizsiz devam ettiğini izlersiniz. Grafikte beş gösterge, beş farklı cevap. Zarar
Tanıtım       Quantum Breakout PRO   , Breakout Bölgeleri ile ticaret yapma şeklinizi değiştiren çığır açan MQL5 Göstergesi! 13 yılı aşkın ticaret tecrübesine sahip deneyimli tüccarlardan oluşan bir ekip tarafından geliştirilmiştir.       Kuantum Breakout PRO       yenilikçi ve dinamik koparma bölgesi stratejisiyle ticaret yolculuğunuzu yeni zirvelere taşımak için tasarlanmıştır. Kuantum Breakout Göstergesi, size 5 kar hedefi bölgesi ile kırılma bölgelerinde sinyal okları ve kırılma kutusuna da
Quant Direction MT5
Georgios Kalomoiropoulos
Quant Direction, 3 boyutlu bir piyasa analiz aracıdır. Çeşitli parametrelerdeki yüzdesel sapmaları hassas bir şekilde hesaplayan, tamamen objektif, algoritma tabanlı piyasa analizi sunar. Gelişmiş yapay zeka tabanlı modelleme araçları kullanılarak geliştirilen ve titizlikle test edilen bu algoritma, piyasayı benzersiz bir hassasiyetle analiz eder. Platformda herhangi bir döviz çiftini veya finansal enstrümanı analiz edebilirsiniz. İster kısa vadeli, ister günlük, isterse swing trading yapın, Qua
Volatility Master for MetaTrader is a real-time dashboard tool that scans up to  50 symbols  to identify high-volatility , trending markets instantly. With bullish/bearish signals, customizable alerts, and a user-friendly interface, it helps you avoid range-bound conditions and focus on high-probability trades. Clarity leads to confidence. Trade confidently and protect your capital effectively with this powerful dashboard. We don't offer free or bonus indicators in exchange of reviews from you.
Quantum TrendPulse
Bogdan Ion Puscasu
5 (26)
SuperTrend   ,   RSI   ve   Stochastic'in   gücünü tek bir kapsamlı göstergede birleştirerek işlem potansiyelinizi en üst düzeye çıkaran nihai işlem aracı olan   Quantum TrendPulse'u   tanıtıyoruz. Hassasiyet ve verimlilik arayan yatırımcılar için tasarlanan bu gösterge, piyasa trendlerini, momentum değişimlerini ve en uygun giriş ve çıkış noktalarını güvenle belirlemenize yardımcı olur. Temel Özellikler: SuperTrend Entegrasyonu:   Güncel piyasa trendlerini kolayca takip edin ve karlılık dalgası
Reversal Master for MT5 Reversal Master for MT5 is a non‑repainting reversal indicator for MetaTrader 5. It helps you detect potential market reversal points and shows the maximum favourable price movement after each historical signal, so you can better understand how price behaved after similar situations in the past. The MT5 version keeps the familiar reversal‑signal logic of the original Reversal Master for MT4, but adds improved visualisation, historical statistics and a points summary panel
Atomic Analyst MT5
Issam Kassas
4.48 (61)
Atomic Analyst — MetaTrader 5 Satın aldıktan sonra Smart Universal Expert Advisor'ı ÜCRETSİZ edinmek ve beraberinde çevrimiçi kurs, PDF kılavuzu ve özel gruba erişim almak için MQL5 üzerinden bana mesaj gönderin. Atomic Analyst; fiyat hareketini, trend yönünü, giriş ve çıkış sinyallerini, Stop Loss ve birden fazla Take Profit seviyesini doğrudan grafiğinizde bir araya getirir. SİNYALİ GÖRÜN. İŞLEM KOŞULLARINI ANLAYIN. Atomic Analyst, analizini anlaşılır görsel bilgiler halinde sunar: • Olası gir
Power Candles MT5
Daniel Stein
4.58 (12)
Power Candles V3 - Kendi Kendini Optimize Eden Güç Göstergesi Power Candles V3, döviz ve enstrüman gücünü, eklendiği her grafikte eyleme geçirilebilir bir ticaret planına dönüştürür. Sadece mumları renklendirmek yerine, arka planda canlı bir otomatik optimizasyon çalıştırır ve önünüzdeki sembol için en iyi Stop Loss, Take Profit ve sinyal eşiğini size sunar. Tek bir tıklama ile canlı ticarete uyarlanır - giriş, Stop Loss ve Take Profit ışınları grafikte tam fiyatlarla görünür ve uyarılar yön bil
Mahra Pro Indicator MT5
Mahra Said Mohammed Al Kaabi
Mahra Pro Indicator MT5 Overview Mahra Pro is a MetaTrader 5 chart indicator designed to support structured analysis of XAUUSD (Gold). It combines trend, momentum, volatility and price-structure conditions to identify potential buy and sell setups and display them directly on the chart. The indicator does not open, modify or close trades. All trading decisions and order execution remain under the user's control. Main features • Buy and sell signal arrows on the chart. • Fast and slow EMA lines w
M1 Quantum MT5
Hamed Dehgani
4.2 (10)
M1 Quantum ile Canlı İşlem Sinyalleri : Sinyal   (İşlem otomatik olarak Quantum Trade Assistant tarafından gerçekleştirilmiştir ve bu ürüne ücretsiz olarak dahildir.) Son Haberler: Sürüm 1.64 yayınlandı. Artık tüm işlemlerde Stop Loss, ilgili Destek/Direnç bölgelerinin arkasına yerleştiriliyor. Bu sürümde EA'nın performansını artırmak için Smart Close fonksiyonu da geliştirildi. 9 Ağustos'tan bu yana canlı sinyal Sürüm 1.64 üzerinde çalışıyor. Fiyat Planı: Güncel Fiyat: $169 (Erken kullanıcı te
Quantum Direction , piyasa yönünü belirlemek, trend değişimlerinin erken aşamalarını tespit etmek ve filtrelenmiş giriş ve çıkış sinyalleri sağlamak için tasarlanmış profesyonel bir trend takip göstergesidir. Bu gösterge, MQL5 Market'te ücretsiz olarak sunulan profesyonel bir işlem yönetim aracı olan Quantum Trade Assistant 'ı içerir. Quantum Direction 'a doğrudan bağlanabilir ve geçerli bir sinyal oluştuğunda işlemleri otomatik olarak açabilir veya yapılandırılmış çıkış koşulları karşılandığınd
Advanced Supply Demand MT5
Bernhard Schweigert
4.53 (15)
Herhangi bir Acemi veya Uzman Tüccar için En İyi Çözüm! Bu gösterge benzersiz, yüksek kaliteli ve uygun fiyatlı bir ticaret aracıdır çünkü bir dizi tescilli özelliği ve yeni bir formülü bir araya getirdik. Bu güncelleme ile çift zaman dilimi dilimlerini gösterebileceksiniz. Yalnızca daha yüksek bir TF gösteremeyeceksiniz, aynı zamanda TF grafiğini ve ARTIK daha yüksek TF'yi de gösterebileceksiniz: YUVARLAK BÖLGELERİ GÖSTERMEK. Tüm Arz Talebi tüccarları buna bayılacak. :) Önemli Bilgiler Açıkland
Smart Market Structure Pro by G-Labs — ICT and Smart Money Concepts toolkit with built-in multi-symbol scanner for MetaTrader 5. Break of structure, change of character, order blocks, fair value gaps, liquidity sweeps, premium and discount zones, ICT sessions, confluence scoring, AI trade ideas, and a traffic-light scanner across up to 30 pairs and four timeframes from one chart. Map SMC and ICT on the active chart while the built-in scanner monitors your full watchlist. Each cell shows BUY, S
CRT Pro is a complete Candle Range Theory toolkit for MetaTrader 5. It finds the CRT model on up to three timeframes and adds the tools needed to read it: higher-timeframe candles, structure shifts, fair value gaps, liquidity sweeps, a bias table and SSMT divergence. Every module can be switched on or off. 1. CRT Model A CRT model is built from two candles of the chosen CRT timeframe. C1 is the range candle. C2 is the sweep candle: it takes the high or the low of C1 and closes back inside the
Currency Strength Wizard , başarılı ticaret için size hepsi bir arada çözüm sağlayan çok güçlü bir göstergedir. Gösterge, birden çok zaman dilimindeki tüm para birimlerinin verilerini kullanarak şu veya bu forex çiftinin gücünü hesaplar. Bu veriler, şu veya bu para biriminin gücünü görmek için kullanabileceğiniz, kullanımı kolay para birimi endeksi ve para birimi güç hatları biçiminde temsil edilir. İhtiyacınız olan tek şey, işlem yapmak istediğiniz tabloya göstergeyi eklemektir ve gösterge size
By the time you've clicked through forty charts looking for a first red day at a monthly high, the setup you wanted has already closed. Market Maker Reversal Scanner reads your Market Watch, finds a fixed set of reversal and exhaustion patterns, scores each one on a transparent 10-point scale, and puts the results in a single sortable panel on one chart. You stop hunting. You start choosing. New in v12.1: a DAYS / SESSIONS switch. Sessions mode runs the same scanner on closed H4 candles and tags
ICT Pro
Robby Suhendrawan
MT5 İçin Ultimate AIO ICT Concept Indicator: Smart Money Concepts'te Otomatik Olarak Uzmanlaşın Her gün ekranlarınızı manuel olarak çizmek için saatler harcamaktan yoruldunuz mu? AIO ICT Concept göstergesi, Smart Money Concepts'te ustalaşmak için eksiksiz, hepsi bir arada çözümünüzdür. Manuel teknik analizin tahmin yürütme ve duygusal yorgunluğunu ortadan kaldırmak için tasarlanan bu güçlü algoritmik araç, en kritik fiyat hareketi öğelerini (price action) doğrudan grafiğinize otomatik olarak eşl
The Oracle Pro
Ottaviano De Cicco
5 (1)
The Oracle Pro: Synthetic Multi-Timeframe Bias Engine for MT5 ️ Summer Launch Offer — Get The Oracle Pro for USD 199 (early buyers). Price rises with traction; final price USD 399. The Oracle Pro is a premium multi-timeframe bias engine for MetaTrader 5, built for demanding and professional traders. It answers one question with discipline: what is the directional bias on each timeframe right now, how strong is it, and how much do the timeframes agree? Everything is computed on closed bars only
Yazarın diğer ürünleri
Gösterge, en olası trend durdurma/geri dönüş alanlarını, kendinden emin trend hareket alanlarını hesaplar. Hesaplama şunları dikkate alır: fiyat değişim oranı; grafiğin göreli sapma açısı; fiyat hareketlerinin ortalama genliği; "konfor bölgesini" terk eden fiyat; ATR göstergesinin değerleri. Gösterge, fiyat bir durdurma/geri dönüş alanına girdiğinde bir Uyarı oluşturabilir. Ayarlar Tüm uzunluğu çiz? - grafiğin sonuna kadar alanları çizin; YUKARI trendi durdur - bir yükseliş trendinin durma/ge
Indicator for determining flat and trend. If the price is below any of the two histograms and two lines (red and blue), this is a sell zone. When purchasing this version of the indicator, MT5 version for one real and one demo account - as a gift (to receive, write me a private message)! If the price is above any of the two histograms and two lines (red and blue), this is a buy zone. MT5 version:  https://www.mql5.com/en/market/product/70409 If the price is between two lines or in the zone of
SuperTrend
Evgeniy Zhdan
2.5 (2)
The Supertrend Expert Advisor The Supertrend Expert Advisor with averaging elements. It has been developed during three months until I finally got good results. It is not a scalper. The minimum balance to start trading - 100 $. Is automatically adjusted to the 4 and 5-digit prices. Has an efficient risk management system. The lot and limit on the maximum lot is automatically calculated based on the settings specified in the EA. As a result, you have a complete automated trading system. Download
Stardust
Evgeniy Zhdan
StarDust searches for divergences in the values of several indicators considering them as signs of flat and enters the market if a relatively steady trend is detected. The Expert Advisor trades "basic" symbols with a low spread. The best results are achieved on М15. The EA automatically adjusts to 4 and 5-digit quote flows. Settings Comment_to_orders – comment to a placed order. The field can be left blank if no comment is required. MM – enable money management with automatic setting of a worki
Top Floor
Evgeniy Zhdan
The EA catches the price when it moves against the trend in an effort to open an order in an opposite direction (direction of the main trend). Screenshots illustrate examples of entries and the strategy gist. The EA uses stop losses depending on values of ATR. Settings: Lot_ - if Risk_ = 0, the EA will trade this lot; Risk_ - risk per one trade. Stop loss is taken into account; koeff_ATR - coefficient multiplied by the ATR value to calculate stop loss (the bigger the value, the bigger stop loss
FastBoom
Evgeniy Zhdan
The FastBoom EA finds the most probable points of price pullback/reverse and places an order. It places averaging orders if the price moves further against take profit. Settings of the EA: Lots - initial lot; LotExponent - multiplier for following orders (Martingale). 1 - no multiplier. TakeProfit - take profit in points; Stochastic Settings InpKPeriod - K Period of Stochastic InpDPeriod - D Period of Stochastic InpSlowing - Stochastic Slowing LevHigh - level for sell positions of Stochastic L
The Expert Advisor calculates the double/triple divergence of volumes, and starts trading. It uses a unique formula of lot calculation, which greatly improves stability of trading. Recommended TF - 1h. Currency pair - EURUSD , but the EA can be used on any trading instruments which are not subject to high volatility. Settings mode - trading direction can be set manually; close - order close level (details on the screenshot); Step between orders - step between orders in points; Maximum orders -
OrderOnLine
Evgeniy Zhdan
The Expert Advisor opens orders from the horizontal line, the a trader can set on any level by dragging using the mouse or by changing the line properties. For example, when a horizontal line is above the current price, the EA will open a Buy order once the horizontal line is reached. And vice versa: If the line is below the current price, the EA will open a sell order once the line is crossed. A buy crossover of the line is: opening of the current candlestick below the horizontal line; the curr
SellerATR
Evgeniy Zhdan
5 (1)
The Expert Advisor only sells. Recommended currency pairs : EURUSD; GBPUSD; USDCHF; USDJPY; USDCAD; AUDUSD; EURGBP; EURAUD; EURCHF; EURJPY; GBPCHF; CADJPY; GBPJPY; AUDNZD; AUDCAD; AUDCHF; AUDJPY; CHFJPY; EURNZD; EURCAD; CADCHF; NZDJPY; NZDUSD. Timeframe: H1. Percent% manages closing both loss-making and profitable deals based on the account overall status. Using the EA on 23 symbols mentioned above allows the robot to cope with the drawdown in case of a long trend. While positions on some pairs
Illusion
Evgeniy Zhdan
3 (2)
The Illusion EA uses the probability theory - after a series of consecutive virtual losses - i.e. right during a flat the EA already starts trading in the trend. In addition, the EA considers the ratio of bullish/bearish candles on the higher timeframes to determine the greatest probability of the price movement direction. Only 1 order can be opened at a time. In case of a loss the following order will be placed with an increased lot (the multiplication coefficient is set in the parameters). The
The indicator plots a trend line and determines the levels for opening trades, in case the price goes "too far" away from the trend level. More detailed information is available in the screenshots. Settings Away from the trend line - distance from the trend line to the trades level; Arrow Signal for deals - enable displaying an arrow when the price reaches the trades level; Size of Arrow - size of the arrow; Alert Signal for deals - enable generating alerts when the price reaches the trades lev
Turbina
Evgeniy Zhdan
5 (4)
The axiom of the Forex market is that any trend will be broken. The Expert Advisor determines trend direction (the pink line), and calculates levels for opening opposite orders depending on the settings. The value of Away from the trend line for Deal will be different for each pair and timeframe, depending on the volatility of the trading instrument. Next orders can be opened with an increased lot (a static lot is used by default). See the screenshots to understand the idea of the Expert Advisor
Odysseus
Evgeniy Zhdan
The Expert Advisor determines the moments of strong movements and opens a position in the direction of the most probable price movement. The strategy always uses stop loss and take profit. Several independent orders can be in the market (the maximum number is set in parameters). The goal of the EA's underlying trading system is the quantitative excess of the number of profitable deals over the number of losing ones. Recommended: EURUSD 5m; GBPUSD 5m; USDJPY 5m. The Expert Advisor is able to work
Vise
Evgeniy Zhdan
Vise is a trend indicator. The upper and lower lines follow the price showing the prevailing price direction. Frequent breakthroughs of the upper line indicate a bullish trend, while frequent breakthroughs of the lower line indicate a bearish one. Parameters Points for UpLine - initial number of points for the upper line; Points for DownLine - initial number of points for the lower line. During the breakthrough of the upper level (line), this level shifts upwards by Points for UpLine. If the up
Twinkle
Evgeniy Zhdan
Twinkle is a trend-based scalper using stop loss and take profit invisible to the broker. The EA does not look for trend reversals. The EA catches strong market movements and opens orders in the direction of the trend. Your broker will not see the order closing levels. The EA closes orders independently when reaching the take profit or stop loss levels specified in the settings. Recommended trading symbols: EURUSD M5, GBPUSD M5. ECN accounts with 5 digits quotes are recommended. Expert Advisor
Shine
Evgeniy Zhdan
4.75 (4)
This Expert Advisor implements elements of the Martingale system. Orders are opened at a specified distance from the moving average. The Parabolic SAR indicator and certain technical details are used to ensure the most accurate entries. The EA is highly customizable. It is recommended for simultaneous use on 4 currency pairs: EURUSD M15; GBPUSD M15; USDJPY M15; USDCAD M15. Despite good stability, it is advisable to disable the EA operation during the days rich in news releases. Configurations P
LuckyCase
Evgeniy Zhdan
LuckyCase is an Expert Advisor with martingale elements. The EA strategy is based on a significant "deviation" of the price from SAR inadicator and the Bands levels breakthrough point. The money management system is an essential part of the EA. It starts working after a trade is opened. Trades are closed after accumulating specified points of market orders, by deposit % or after an opposite side of the channel is broken through. The default EA settings are meant for: EURUSD M15; USDJPY M15. The
Elize
Evgeniy Zhdan
The Elize Expert Advisor has been designed to work with the EURCHF currency pair. It considers the peculiarities of this trading instrument, its behavior and dependence on the behavior of other currencies. In particular, when the currencies of the European countries (EURUSD, GBPUSD, EURNOK, EURCHF) move in the same direction, the EA starts its operation and opens a deal in the trend direction of the European currencies. In the event of price rollbacks, the EA uses a unique method for making the
AllTrendLines
Evgeniy Zhdan
4 (1)
Brief Description of the All Trend Lines Indicator The indicator analyzes the wave structure of the market. What it displays on the chart: First. Wave pivots (semaphores) • Red markers – wave highs • Yellow markers – wave lows • Yellow-green markers – additional local extremes Second. Trend lines • Purple/blue lines – trends based on highs (resistance/support) • Beige/green lines – trends based on lows • Lines are built automatically by connecting wave pivots of the same type Third. Main trend
FastTraffic
Evgeniy Zhdan
The Expert Advisor has been specifically developed for trading gold (Spot Gold). The strategy is based on Fibo levels calculated from the previous (first) candle High/Low and the width of the current and lower timeframes channel. If important Fibo levels of different orders are located in a single price channel (within a spread), the EA defines this channel as the target for price movement and starts operation. Martingale and averaging are not used. Each order is independent and is accompanied b
Jazz
Evgeniy Zhdan
The algorithm of this Expert Advisor determines the significant price levels, where the trend often turns into a flat or reverses. Stochastic Oscillator serves as an additional filter of overbought/oversold zones. The EA sets stop loss and take profit after opening an order. The underlying trailing strategy applies a trailing stop. The EA is recommended for simultaneously use on three trading instruments: EURUSD M5, GBPUSD M5, EURCHF M5. Settings: Comment to order - comment to orders. MaxRisk -
Panther
Evgeniy Zhdan
The Expert Advisor looks for technical analysis patterns formed on the higher (hourly) timeframe to start working on the 5-minute chart. Technical analysis patterns used: double top/double bottom, head/shoulders, flag, expanding/narrowing triangles. The Relative Vigor Index technical indicator is used as the filter for opening deals. It is based on the idea that on the bull market the closing price is, as a rule, higher, than the opening price. It is the other way round on the bear market. This
Spook
Evgeniy Zhdan
The Expert Advisor calculates the divergence on the current and higher timeframes. In case the divergences coincide, the EA starts its operation. Deals have strict take profit and stop loss levels. Each deal is managed by trailing stop. The strategy involves the use of a tight stop-loss. Therefore, losing deals and/or series of losing deals are not uncommon. This EA is not suitable for those who have difficulties coping with losing deals. The EA is recommended for simultaneous use on the followi
Grand
Evgeniy Zhdan
The Expert Advisor has been developed specifically for the features of the CHFJPY currency pair. The EA's algorithm determines the direction of the current trend and starts operation. In case of a price reversal within the current trend, the EA adds additional orders. If trend changes, the EA starts to work in the direction contrary to the initial grid of orders. If there were no conditions for closing orders and the trend direction changed again, the EA continues to work with the "first" grid o
Intensive
Evgeniy Zhdan
The Expert Advisor algorithm determines on daily charts those candlestick patterns, which set the intraday trading direction. The trading EA determines how long the price is moving in overbought/oversold zones and starts working in the direction of the expected trend movement. Each position is accompanied with a tight stop loss and take profit. Only one active position can be open in the market. The EA was developed and tested using 99% quality quotes. The Expert Advisor has a built-in news filt
Slender
Evgeniy Zhdan
The strategy of this Expert Advisor is based on a hedging system, which implies placing opposite orders. The EA algorithm determines trend beginning and opens a position in the trend direction. In case of a wrong entry, the EA tries to neutralize the drawdown through opposite (hedging) orders at a preset interval (Coefficient of counter orders). Orders are closed when one of the two values ​​is reached - profit in percent or profit in points. The EA does not use lot increase. The EA wast tested
Dreamer
Evgeniy Zhdan
Советник работает по принципу хеджирования с периодическими "перекосами" в сторону трендовых направлений. Направления тренда советник определяет на основании стандартного индикатора Parabolic Stop and Reverse system (SAR). Уникальная стратегия установки балансирующих позиций позволяет избегать больших просадок даже при самых не благоприятных рыночных условиях. Параметры по умолчанию рекомендуется использовать на торговом инструменте: GBPJPY 15m. Разработка и оптимизация параметров производились
Snoot
Evgeniy Zhdan
5 (1)
This Expert Advisor works using a grid in the direction of a trend movement with the step between opened positions defined in the settings. The positions are closed by the total take profit. The Parabolic SAR standard indicator is used to filter order opening, which comes in the MetaTrader 4 package. The EA has been developed and tested using 99,9% quality of quotes. Operation of the EA in real time can be viewed in the signals . The best trading results have been achieved on CHFJPY M15. Settin
Solipsism
Evgeniy Zhdan
The Expert Advisor builds channels based on the data obtained using ATR and MA indicators according to the equations: Upper channel border = MA + ATR * (FIBO); Lower channel border = MA - ATR * (FIBO), where FIBO has the following values: Style of Trade - Aggressive = 1.61852; Style of Trade - Average = 3.26704; Style of Trade - Calm = 4.85556. Trades are opened inside the channel with the intervals defined in the settings. Long and short positions are opened independently. Positions are closed
The trading statistics indicator notifies the trader of the aggregate income of the trading account for different time intervals. The indicator has wide display settings on the graph. There is a choice of one of the two display languages on the chart- English and Russian. Settings Indicator language (ENG, RUS) - Select the language to display on the chart; To control the magic (-1: any magic) - Entering the Magic for control (-1: any Magic); Angle of indicator tie - Selecting the angle of the c
Filtrele:
Değerlendirme yok
Değerlendirmeye yanıt