Session Flow Map MT5

SessionFlowMap — Profilo multi-sessione di volume e delta con livelli POC

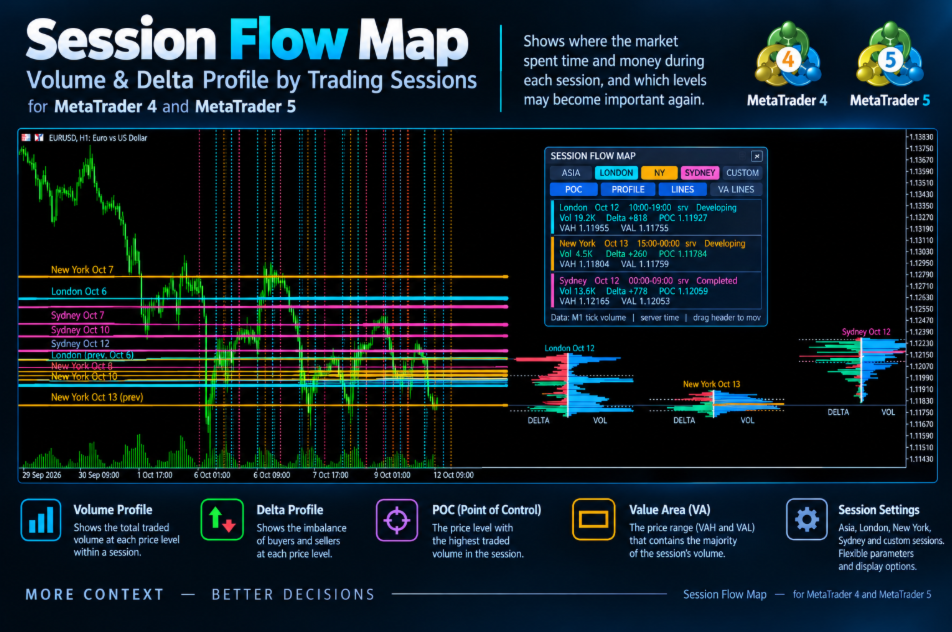
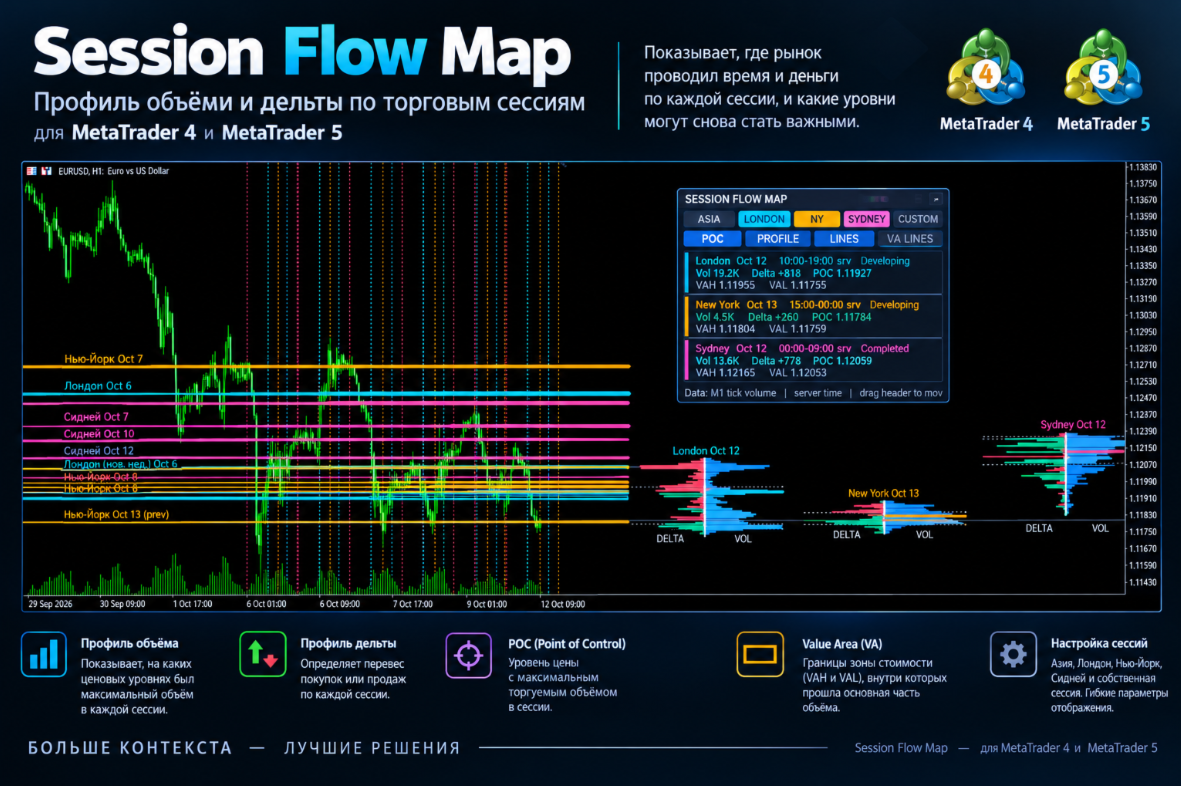
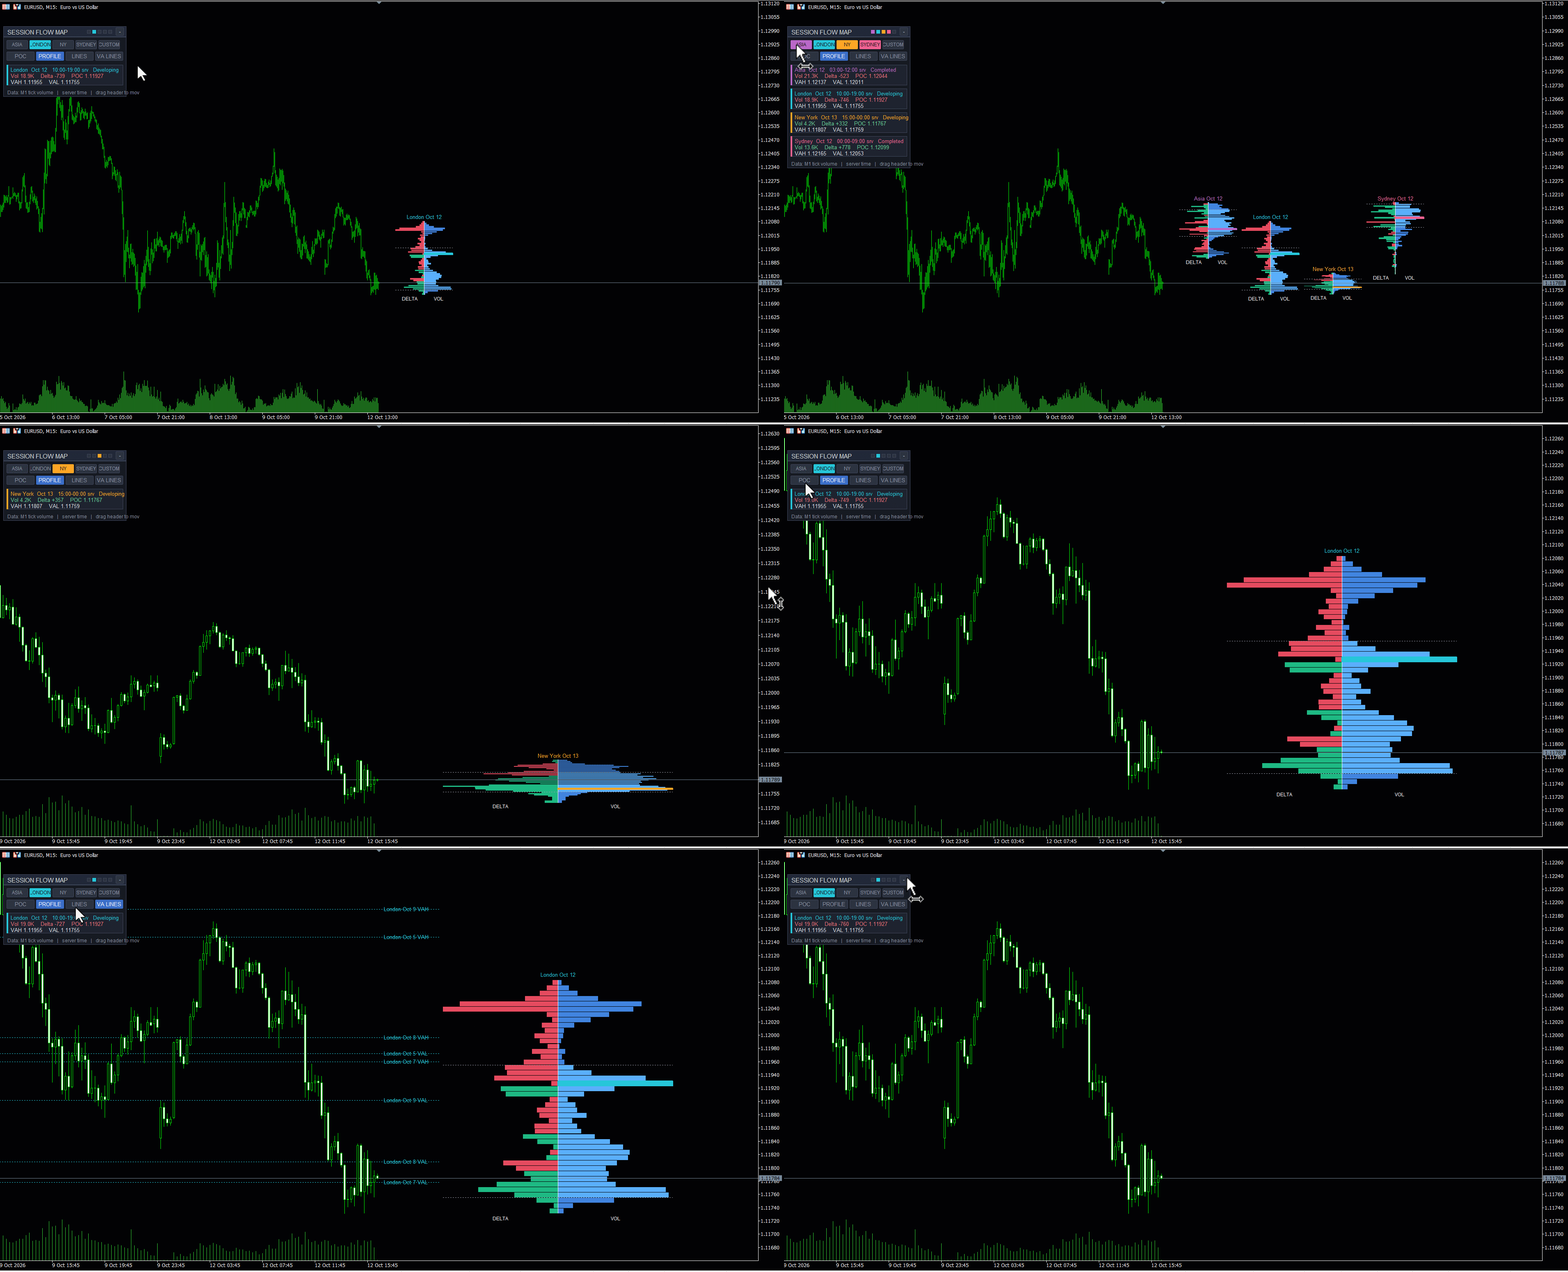
SessionFlowMap costruisce un profilo di volume e un profilo di delta (squilibrio tra acquisti e vendite) per le sessioni della giornata forex: Asia, Londra, New York e, facoltativamente, Sydney e una sessione personalizzata. Per ogni sessione individua il POC (Point of Control: il prezzo con il maggior volume scambiato) e la Value Area (VAH e VAL: l'intervallo che concentra la maggior parte del volume) e prolunga questi livelli verso destra come linee orizzontali. Si vede a colpo d'occhio dove il mercato ha speso tempo e denaro in ogni sessione e quali livelli possono tornare importanti.

MT4-version: https://www.mql5.com/en/market/product/200941

Come funziona

  • Ogni sessione viene ritagliata dallo storico M1 in base ai propri orari. Gli orari di Asia, Londra, New York e Sydney si impostano in GMT e vengono convertiti automaticamente nell'ora del server del vostro broker. La sessione personalizzata usa direttamente l'ora del server.
  • L'intervallo di prezzo della sessione viene suddiviso in righe di prezzo (il numero obiettivo lo impostate voi) e il volume viene distribuito tra le righe. Nel forex non esiste un volume centralizzato, quindi si usa il volume dei tick.
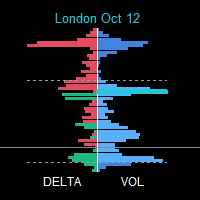
  • Il profilo di volume è il volume totale di ogni riga. Il profilo di delta è il volume di acquisto meno il volume di vendita di ogni riga (verde: dominano gli acquirenti; rosso: dominano i venditori).
  • Nella modalità «M1 bars» la ripartizione tra acquisti e vendite è stimata in base alla posizione della chiusura di ogni candela all'interno del suo intervallo. Nella modalità «Real ticks» deriva dalla direzione di ogni tick (o dai flag BUY/SELL, se il broker li fornisce).
  • Il POC è la riga con il volume maggiore. La Value Area si espande dal POC finché non copre la percentuale di volume scelta (70% per impostazione predefinita), ottenendo così VAH e VAL.
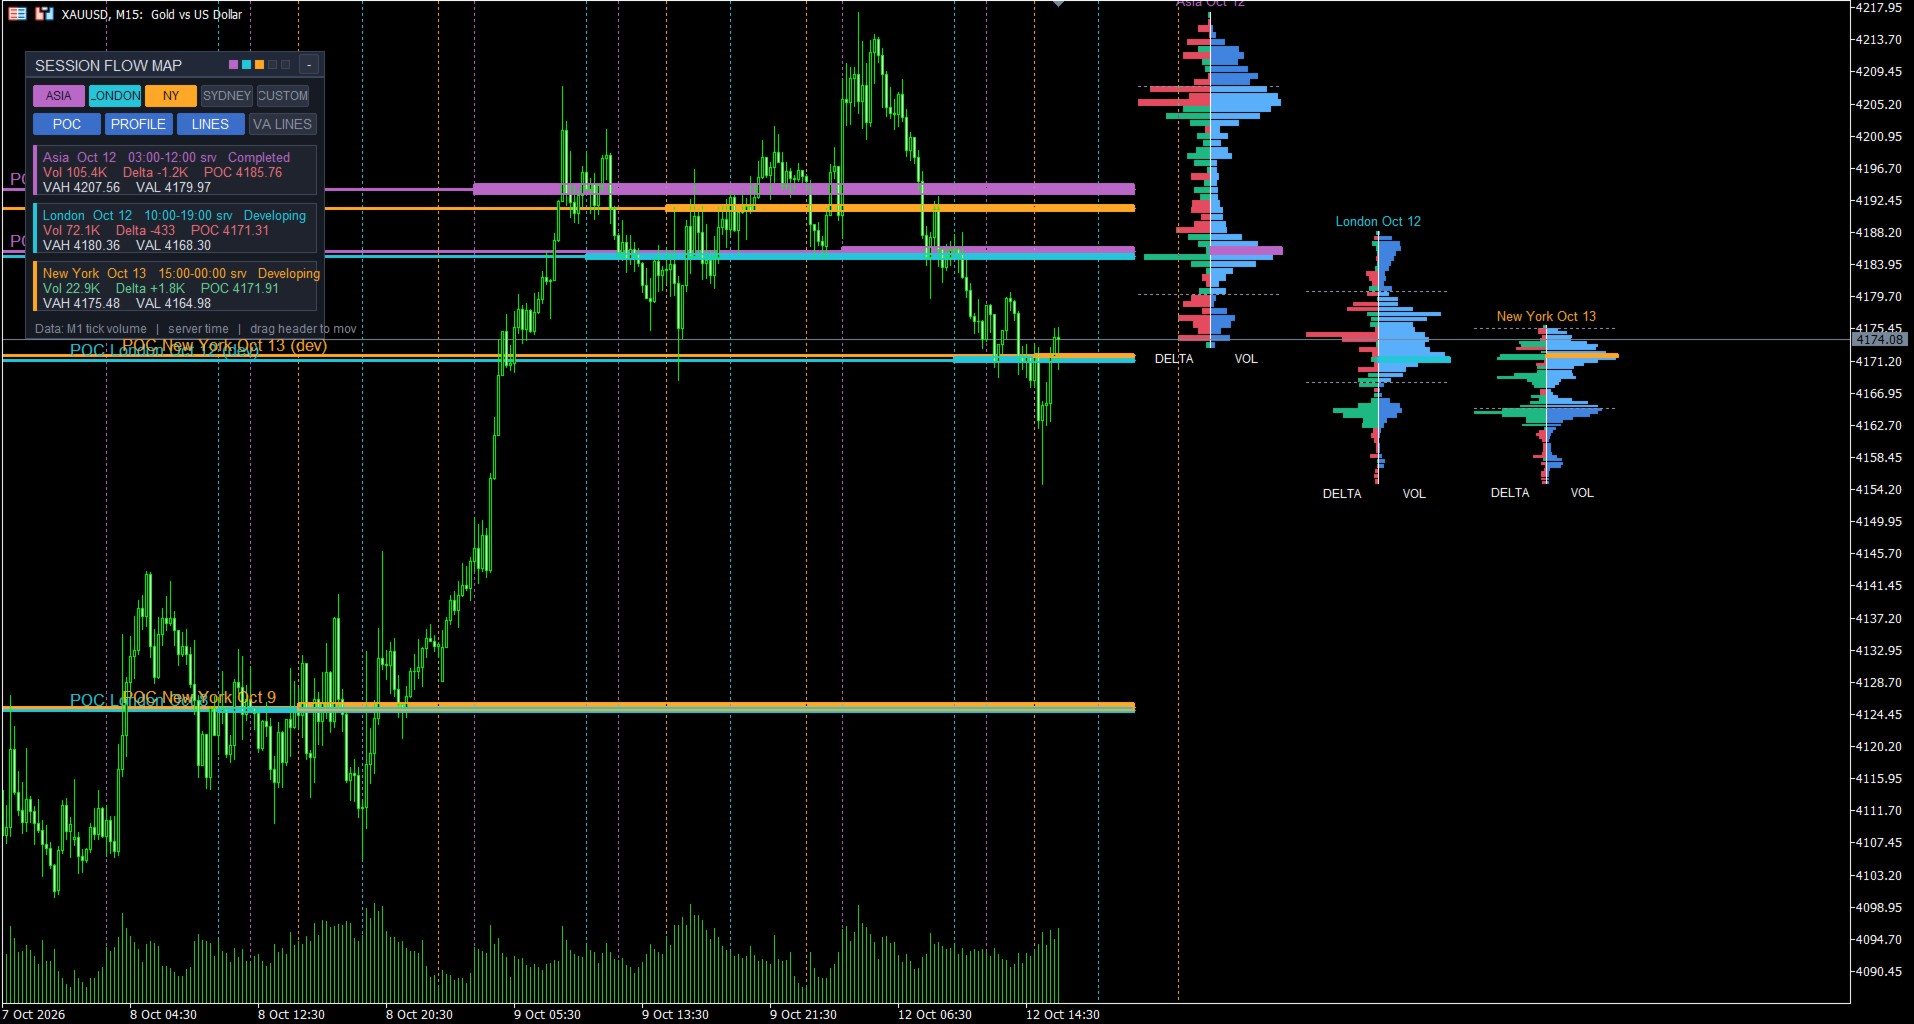
  • L'ultimo profilo di ogni sessione viene disegnato come cluster a destra dell'ultima candela (volume e delta schiena contro schiena attorno a un divisore) oppure all'interno della sessione stessa sul grafico. Il POC è disegnato come zona e/o linea; una lunga linea attraversa tutto il grafico con un'etichetta sopra, a sinistra. I POC delle sessioni precedenti restano sul grafico come livelli di riferimento.
  • Linee verticali segnano l'inizio e la fine di ogni sessione. Ogni sessione ha il proprio colore.

Come può usarlo un trader

  • Il POC della sessione precedente come supporto o resistenza e come «calamita» per il prezzo: osservate come reagisce il prezzo quando torna sul livello.
  • Modalità POC «nudo» (naked POC): i livelli che il prezzo non ha ancora rivisitato restano prolungati; dopo il primo tocco la linea si ferma.
  • VAH e VAL come confini del «valore equo»: accettazione all'interno dell'area, rifiuto all'esterno, uscite dalla Value Area.
  • Il profilo di delta mostra a quali prezzi hanno dominato acquirenti o venditori; confrontate il delta sul POC con le righe vicine.
  • Contesto delle sessioni: il range asiatico, la posizione dei POC di Londra e New York rispetto ad esso, la sovrapposizione tra Londra e New York.
  • Confluenza: quando i POC di sessioni e giorni diversi sono vicini, formano una zona più significativa.
  • Gli avvisi segnalano quando il prezzo torna sui livelli prolungati.
  • Funziona su qualsiasi simbolo e timeframe (i profili sono costruiti dall'M1); M5–H1 è la scelta più comune.

Pannello e pulsanti

  • Trascinate il pannello dall'intestazione e comprimetelo con il pulsante «-». I puntini colorati nell'intestazione indicano le sessioni attive.
  • I pulsanti ASIA, LONDON, NY, SYDNEY e CUSTOM attivano e disattivano le sessioni direttamente sul grafico.
  • I pulsanti POC, PROFILE, LINES e VA LINES attivano o disattivano i livelli visivi: livelli POC, profili, linee verticali di sessione e VAH/VAL prolungati.
  • Ogni sessione ha una scheda: nome, data, orari in ora del server, stato (Completed o Developing), volume, delta, POC, VAH e VAL. L'ultima riga indica la fonte dei dati.
  • La posizione del pannello, lo stato compresso e lo stato dei pulsanti vengono memorizzati separatamente per ogni grafico.

Requisiti

Lo storico M1 del periodo necessario deve essere caricato. Attivate lo spostamento del grafico (Chart shift) e lasciate spazio libero a destra per i cluster dei profili.

Impostazioni

1. Sessions

  • «Show Asian session» — attiva la sessione asiatica (il pulsante ASIA del pannello fa lo stesso).
  • «Asian session hours (GMT, HH:MM-HH:MM)» — inizio e fine della sessione asiatica in GMT, predefinito 00:00-09:00. Sono supportate le sessioni che attraversano la mezzanotte.
  • «Show London session» / «London session hours (GMT, HH:MM-HH:MM)» — la sessione di Londra, predefinito 07:00-16:00.
  • «Show New York session» / «New York session hours (GMT, HH:MM-HH:MM)» — la sessione di New York, predefinito 12:00-21:00.
  • «Show Sydney session» / «Sydney session hours (GMT, HH:MM-HH:MM)» — la sessione di Sydney, disattivata per impostazione predefinita, orario 21:00-06:00.
  • «Show custom session (broker day by default)» / «Custom session hours (SERVER time, HH:MM-HH:MM)» — una sessione tutta vostra in ora del server; il valore predefinito 00:00-24:00 corrisponde all'intera giornata del broker.
  • «Auto-detect broker GMT offset» — lo scostamento del server rispetto al GMT viene rilevato automaticamente, compresi i cambi di ora legale del broker.
  • «Manual broker GMT offset, hours (if auto is off)» — scostamento fisso in ore quando il rilevamento automatico è disattivato.
  • «Skip sessions starting on Saturday/Sunday» — salta le sessioni che iniziano nel fine settimana. Suggerimento: gli orari di Londra e New York sono impostati in GMT; quando queste piazze passano all'ora legale, spostate gli orari di un'ora.

2. Data

  • «Data source» — «M1 bars (tick volume, fast)»: calcolo rapido dalle candele da un minuto; «Real ticks (precise, slower)»: calcolo preciso dai tick, ma più lento.
  • «Refresh interval (seconds)» — ogni quanto la sessione corrente viene ricalcolata e ridisegnata. Una nuova candela provoca subito il ricalcolo.

3. Volume and delta profiles

  • «Show volume profile» — mostra il profilo di volume.
  • «Show delta profile» — mostra il profilo di delta.
  • «Volume profile side (delta is opposite)» — da quale lato del divisore viene disegnato il volume; il delta va sul lato opposto.
  • «Target price rows per session (10-70)» — livello di dettaglio del profilo. Se gli oggetti sono troppi, le righe vengono unite solo nel disegno; POC e Value Area restano esatti.
  • «Profile placement» — «Shared divider at right»: gli ultimi profili di tutte le sessioni sono affiancati a destra dell'ultima candela; «Session edges»: il profilo viene disegnato all'interno dell'intervallo di tempo della sessione.
  • «Previous sessions: edge» — su quale bordo della sessione (sinistro o destro) vengono disegnati i profili precedenti.
  • «Profiles to display» — «Latest session of each type only»: solo la sessione più recente di ogni tipo; «Latest + previous sessions»: anche quelle precedenti.
  • «Previous sessions with full profiles (1-10)» — quante sessioni precedenti di ogni tipo vengono mostrate con il profilo completo.
  • «Profile width (% of session, edges mode)» — larghezza massima di ciascuna metà del profilo come percentuale della durata della sessione.
  • «Shared divider: width per side (bars)» — larghezza di ciascuna metà del profilo in candele nella modalità con divisore condiviso.
  • «Shared divider: gap after last bar (bars)» — distanza dall'ultima candela al cluster; aumentatela se i profili intralciano il prezzo.
  • «Show value area high / low lines» — linee tratteggiate VAH e VAL su ogni profilo.
  • «Value area (%)» — quota di volume all'interno della Value Area, 70 per impostazione predefinita.
  • «Show volume / delta numbers in rows» — numeri di volume e delta all'interno delle righe.
  • «Drawing budget (max histogram boxes)» — limite di oggetti dell'istogramma per mantenere fluido il terminale.

4. POC

  • «Show POC» — mostra il POC.
  • «POC display» — «Zone»: una zona riempita sulla riga del POC; «Line»: una linea.
  • «Zone width basis» — «POC row»: la zona coincide con la riga del POC; «Custom points»: una zona di larghezza impostata attorno al centro.
  • «Custom zone total width (points)» — larghezza totale della zona in punti per la modalità «Custom points».
  • «Extend developing session POC right» — prolunga verso destra il POC di una sessione ancora in formazione.
  • «Zone transparency (0-100)» — trasparenza del riempimento della zona.
  • «Zone border width» — spessore del bordo della zona.
  • «Show POC center line inside zone» — una linea tratteggiata al centro della zona.
  • «POC line across the whole chart (extended POCs)» — la linea del POC va dall'inizio dello storico fino al cluster, con un'etichetta sopra, a sinistra.
  • «POC line width» — spessore della linea del POC.

5. Previous sessions levels

  • «Extend previous sessions' POC right» — prolunga verso destra i POC delle sessioni concluse.
  • «Previous sessions to extend per session type (1-30)» — quante delle ultime sessioni concluse di ogni tipo vengono prolungate.
  • «Allow incomplete sessions in history» — consente di prolungare i livelli di sessioni con dati incompleti (contrassegnati da un asterisco *).
  • «Show dated level labels» — etichette dei livelli con il nome della sessione e la data.
  • «Naked POC mode: stop extension at first revisit» — la linea si ferma nel momento in cui il prezzo torna per la prima volta sul POC.
  • «Also extend previous VAH / VAL right» — prolunga anche VAH e VAL delle sessioni precedenti.
  • «Extension length to the right (bars)» — lunghezza del prolungamento verso destra in candele quando il cluster non limita le linee.
  • «Stop extended lines before the profile cluster (shared divider mode)» — le linee terminano prima del cluster dei profili, così questo resta pulito.

6. Colors

  • «Asian session color», «London session color», «New York session color», «Sydney session color», «Custom session color» — colori delle sessioni: POC, linee, etichette e schede del pannello.
  • «Volume» — colore dell'istogramma del volume.
  • «Volume inside value area» — colore del volume all'interno della Value Area.
  • «Positive delta» / «Negative delta» — colori del delta positivo e negativo.
  • «Value area lines» — colore delle linee VAH e VAL.
  • «Profile transparency (0-100)» — trasparenza degli istogrammi.
  • «Show profile titles» — titoli sopra i profili (nome della sessione e data) e sotto (VOL e DELTA).

7. Alerts

  • «Alert when price touches extended POC / VAH / VAL» — attiva gli avvisi quando il prezzo tocca i livelli prolungati (VAH e VAL se il loro prolungamento è attivo).
  • «Popup alert» — finestra popup.
  • «Push notification» — notifica push all'app mobile.
  • «Sound alert» — segnale acustico.
  • «Touch tolerance (points)» — tolleranza di tocco in punti.

8. Panel

  • «Show interactive panel (drag header, buttons)» — mostra il pannello con i pulsanti.
  • «Panel start X (drag header to move)» / «Panel start Y (drag header to move)» — posizione iniziale del pannello; in seguito potete trascinarlo con il mouse.

9. Session lines

  • «Show vertical lines at session start / end» — linee verticali all'inizio e alla fine delle sessioni.
  • «Session lines style» — stile di queste linee.
Prodotti consigliati
La Master Edition è uno strumento analitico di livello professionale progettato per visualizzare la struttura del mercato attraverso l'obiettivo del volume e del flusso di denaro. A differenza degli indicatori di volume standard, questo strumento visualizza un Profilo di Volume Giornaliero direttamente sul tuo grafico, permettendoti di vedere esattamente dove si è verificata la scoperta dei prezzi e dove è posizionato il "denaro intelligente". Questa Master Edition è progettata per chiarezza e v
Value Chart Candlesticks
Flavio Javier Jarabeck
4.57 (14)
The idea of a Value Chart indicator was presented in the very good book I read back in 2020 , " Dynamic Trading Indicators: Winning with Value Charts and Price Action Profile ", from the authors Mark Helweg and David Stendahl. The idea is simple and the result is pure genius: Present candlestick Price analysis in a detrended way! HOW TO READ THIS INDICATOR Look for Overbought and Oversold levels. Of course, you will need to test the settings a lot to find the "correct" one for your approach. It
FREE
Simple QM Pattern MT5
Suvashish Halder
3.75 (4)
Simple QM Pattern   is a powerful and intuitive trading indicator designed to simplify the identification of the Quasimodo (QM) trading pattern. The QM pattern is widely recognized among traders for effectively signaling potential   reversals   by highlighting key market structures and price action formations. This indicator helps traders easily visualize the QM pattern directly on their charts, making it straightforward even for those who are new to pattern trading. Simple QM Pattern includes d
FREE
Volume Profile FREE — Multi-Session Heatmap (POC · VAH · VAL) See where trading activity actually occurs—not just where price moves. This indicator builds a clear, color-coded Volume Profile Heatmap directly on your chart and highlights the market's most important price levels: the Point of Control (POC) and the Value Area (VAH/VAL) , where price is most likely to react.
FREE
Fixed Volume Profile
Carlos Pascual Perez Maturano
This indicator, titled "Fixed Volume Profile.mq5", is a custom tool for MetaTrader 5 (MQL5) designed to calculate and display a Volume Profile over a user-defined fixed time range. The Volume Profile shows the distribution of trading volume at different price levels during a specific period, helping to identify areas of high activity (such as Points of Control or POCs) and volume-based support/resistance areas. Main Functionality: Interactive Range: The indicator creates two vertical lines on
FREE
The   Visual Volatility Clustering   indicator clusters the market based on volatility. The indicator does not redraw and gives accurate data, does not use closing prices. Uses the opening prices or the highs or lows of the previous completed bar. Therefore, all information will be clear and unambiguous. The essence of the indicator is to divide the price market into certain areas according to a similar type of volatility. This can be done in any way. In this example, the indicator is configure
Haven Volume Profile
Maksim Tarutin
4.64 (14)
Haven Volume Profile è un indicatore multifunzionale per l'analisi del profilo di volume che aiuta a identificare i livelli di prezzo chiave basati sulla distribuzione del volume di scambi. È stato progettato per i trader professionisti che desiderano comprendere meglio il mercato e identificare i punti di ingresso e di uscita cruciali per le loro operazioni. Altri prodotti ->  QUI Caratteristiche principali: Calcolo del Point of Control (POC) - il livello con la massima attività commerciale, ut
FREE
Blahtech VWAP MT5
Blahtech Limited
5 (1)
Blahtech VWAP - Volume Weighted Average Price (VWAP) is the ratio of price to total volume. It provides an average price over a specified time interval.  Links [  Install  |  Update  |  Documentation   ] Feature Highlights Configurable VWAP Line Sessions, intervals, anchored or continuous Previous day settlement line Standard Deviation bands Alerts at bar close or real time Automatic Broker or Tick volumes Significantly reduced CPU usage Input Parameters Expert Advisor Mode  - Reserved for iCu
FREE
Ospe POC Volume Profile
Nur Azureen Binti Ab Aziz
A volume-at-price heatmap with POC, value area, estimated buy/sell pressure, confirmed signals and alerts. POC Volume Profile Heatmap is a MetaTrader 5 indicator that organizes historical volume across price levels. It identifies the Point of Control, displays the selected value area, and estimates buying and selling pressure at the POC. The indicator is intended for traders who use volume-at-price structure to study acceptance, rejection and interaction around high-activity price levels. It c
FREE
The Horizontal Ray Tool is a lightweight, professional charting utility designed to streamline support and resistance mapping on MetaTrader 5. It brings rapid, one-click horizontal level placement directly to your live chart, eliminating the workspace clutter associated with infinite horizontal lines or manually drawn trendlines. Key Features: Interactive On-Screen Button: Spawns a clean, responsive "DRAW RAY" button docked directly on your chart canvas. A single click drops an independent hor
FREE
Smart SMC FVG
Ekkasawat Pitichalermroch
SMC + Volume Profile + FVG: Indicator Guide Overview SMC + Volume Profile + FVG is an all-in-one indicator for MetaTrader 5. It combines three popular price-action tools on a single chart: Smart Money Concepts (SMC): market structure (swings, BOS, CHoCH) and Order Blocks Fair Value Gaps (FVG): price imbalances left behind by fast moves Volume Profile: where the most trading happened, shown as POC, Value Area High and Value Area Low Everything is drawn automatically. You can turn each part on or
Enhanced Volume Profile: The Ultimate Order Flow & Liquidity Analysis Tool Overview Enhanced Volume Profile is an indicator for MetaTrader 5 that displays the traded volume at specific price levels over a defined period. It separates the total volume into buy and sell components, presenting them as a side-by-side histogram on the chart. This allows users to observe the volume distribution and the proportion of buy and sell volumes at each price level. Graphics Rendering The indicator uses the
FREE
Session Profiles
Basharat Umar Khan
Short Description Draws rolling Time-Price-Opportunity (TPO) and footprint volume profiles for the Asia, London, and New York sessions with POC/VAH/VAL levels, delta volume bias, order flow overlays, liquidity heatmaps, developing rolling lines, Naked POC (NPOC) tracking, Initial Balance breakouts, multi-session confluence zones, and automatic broker GMT-offset detection. Full Description Plots separate market-profile and volume-profile style histograms for the three major trading sessions (Asi
FREE
Blahtech Supply Demand MT5
Blahtech Limited
4.57 (14)
Was: $299  Now: $99  Supply Demand uses previous price action to identify potential imbalances between buyers and sellers. The key is to identify the better odds zones, not just the untouched ones. Blahtech Supply Demand indicator delivers functionality previously unavailable on any trading platform. This 4-in-1 indicator not only highlights the higher probability zones using a multi-criteria strength engine, but also combines it with multi-timeframe trend analysis, previously confirmed swings a
Volume-to-Price Movement Oscillator (VP Oscillator) for MT5 The VP Oscillator highlights the balance (or imbalance) between trading volume and price movement, helping traders spot hidden accumulation, distribution, or weakening trends. How It Works: Calculates each bar’s price range (High–Low) and tick volume. Normalizes both values over a set period (default: 14). Plots the absolute difference between them ×100 — showing how closely price action aligns with trading activity. Interpretation: Hig
FREE
BoxProfile MT5
Evgeny Shevtsov
4.6 (10)
The indicator displays volume profiles based on the nesting principle. Profiles periods are pre-set so that each subsequent profile has a length twice as long as the length of the previous profile. In addition to profiles, the indicator displays volume clusters sorted by color, depending on the volume they contain. Indicator operation features The indicator works on typical timeframes from M5 to MN, but for calculations uses historical data from smaller timeframes: M1 - for timeframes from M5
FREE
(Special New Year promotion - free price!) The indicator displays the actual 'Scale in points per bar' (identical to the manual setting in the Terminal, see screenshot) in the upper right corner of the chart. The displayed value changes INSTANTLY whenever the chart scale is changed! (This is very convenient when planning screenshots). In Settings: Change language (Russian/English), font size of the displayed text, text label offset coefficient from the graph corner, equally in X and Y directi
FREE
Advanced Volume Profile
Henry Armando Baltazar
Advanced Volume Profile Liquidity Analysis via Custom Area Selection The Advanced Manual Volume Profile is a precision tool for MetaTrader 5 designed to deconstruct market structure through price-level volume analysis. Unlike static profiles, this indicator exclusively processes the price and time range defined by the user via a rectangle object, offering a surgical view of the market auction. Elite Technical Specifications Dynamic Algorithm: Real-time calculation (400ms refresh rate) based on t
FREE
VP hidden
Emr Aljnaby
4.33 (12)
The indicator works to convert normal volume into levels and determine financial liquidity control points. It is very similar in function to Fixed Volume Profile. But it is considered more accurate and easier to use than the one found on Trading View because it calculates the full trading volumes in each candle and in all the brokers present in MetaTrade, unlike what is found in Trading View, as it only measures the broker’s displayed prices. To follow us on social media platforms: telegram
FREE
Mirror Chart MT5
Andrej Hermann
5 (1)
The Mirror Chart MT5 is a overlay indicator specifically designed to project a second financial instrument directly onto the main chart window. This tool is invaluable for traders who rely on correlation analysis, as it visualizes the price movements of two different instruments in real time. Unlike traditional overlays, this indicator utilizes intelligent, dynamic centering and scaling logic. It continuously analyzes the visible price range in the current window for both symbols and calculates
FREE
The indicator highlights the points that a professional trader sees in ordinary indicators. VisualVol visually displays different volatility indicators on a single scale and a common align. Highlights the excess of volume indicators in color. At the same time, Tick and Real Volume, Actual range, ATR, candle size and return (open-close difference) can be displayed. Thanks to VisualVol, you will see the market periods and the right time for different trading operations. This version is intended f
FREE
ApeX Trade Manager MT5  →     ApeX Journal MT5  →     ApeX Indicator SMC MT5  →     ApeX Indicator ICT Concepts MT5  →     ApeX Indicator Volume Profile MT5  →    ApeX Indicator ICT Macros MT5  → One profile per session tells you about the session. One profile per swing tells you about the trade you are in. ApeX Volume Profile builds a profile for every pivot the market makes. 1. The profile Point of Control — The price where the most volume traded in that leg, optionally extended right or bo
Aggression Volume
Flavio Javier Jarabeck
4.29 (17)
Aggression Volume Indicator is the kind of indicator that is rarely found in the MQL5 community because it is not based on the standard Volume data provided by the Metatrader 5 platform. It requires the scrutiny of all traffic Ticks requested on the platform... That said, Aggression Volume indicator requests all Tick Data from your Broker and processes it to build a very special version of a Volume Indicator, where Buyers and Sellers aggressions are plotted in a form of Histogram. Additionally,
FREE
Daily & Composite Volume Profile   This is a professional-grade market profile tool designed for MetaTrader 5. It utilizes a   Dual-Profile System   to visualize supply, demand, and liquidity concentrations. Key Features Left Side: Daily Session Profiles Automatically identifies the start and end of every trading day. Generates a unique Volume Profile for each individual day. Allows you to see how value migrated from yesterday to today (e.g., Is today's volume higher or lower than yesterday?).
BoxInside MT5
Evgeny Shevtsov
5 (4)
This indicator calculates the volume profile and places labels that correspond to the VAH, VAL and POC levels, for each candle individually. Indicator operation features The indicator works on the timeframes from M3 to MN, but it uses the history data of smaller periods: M1 - for periods from M3 to H1, M5 - for periods from H2 to H12, M30 - for the D1 period, H4 - for the W1 period, D1 - for the MN period. The color and location of the VAL, VAH and POC labels on the current candle are considere
FREE
Here   our more valuable tools SMC Trend Trading   ,  Easy SMC Trading  ,  Institutional SMC Architect Volume Analysis Tools  ,  Volume flow Profile  ,  Market volume profile  , FVG with Volume  , Liquidity Heatmap Profile  ,  Volume Spread Analysis A professional spike pattern indicator built for synthetic traders who scalp and swing Crash 500/300/1000 with precision.  This indicator: Detects powerful 3-candle spike formations (Spike → Pullback → Spike) Automatically draws a clean box a
FREE
Volume Profile Multiple — Profili di Volume Multipli con Buffer per il Trading Algoritmico Stanco di ridisegnare il Volume Profile blocco per blocco, ricalcolando tutto ogni volta che cambi timeframe? Volume Profile Multiple traccia automaticamente più profili di volume consecutivi sul grafico, rivelando dove si è realmente concentrato l'interesse istituzionale in ogni tratto del mercato — non solo nell'ultimo intervallo visibile. Cosa fa l'indicatore per te L'indicatore suddivide lo storico dei
Here   our more valuable tools SMC Trend Trading   ,  Easy SMC Trading  ,  Institutional SMC Architect Volume Analysis Tools  ,  Volume flow Profile  ,  Market volume profile  , FVG with Volume  , Liquidity Heatmap Profile  ,  Volume Spread Analysis The    Liquidity Heatmap   is a sophisticated institutional trading tool designed to reveal where over-leveraged traders are trapped. By calculating estimated liquidation levels based on volume spikes and leverage, this indicator draws a dynamic "h
TradeVision Pro
Ian Nganga Comba
TradeVisonPro Forex Analyzer Pro Dashboard di analisi e monitoraggio dei conti di trading MT5 TradeVisonPro Forex Analyzer Pro è una soluzione di analisi del trading e monitoraggio dei conti progettata per gli utenti di MetaTrader 5. Il prodotto organizza i dati di trading MT5 in una dashboard web strutturata, consentendo ai trader di visualizzare le informazioni del conto, monitorare le posizioni aperte, analizzare lo storico delle operazioni, seguire le strategie, mantenere un diario di tradin
FREE
Deviation Trend Profile Overview Deviation Trend Profile is a MetaTrader 5 chart indicator that combines three visual layers in a single chart window: a moving average with momentum-based coloring, deviation bands calculated from volatility, and a horizontal distribution profile drawn to the right of the current price. The indicator is an analytical tool. It does not open, modify or close trades, and it is not a complete trading system. It is designed to help the user observe trend direction, mo
FREE
Gli utenti di questo prodotto hanno anche acquistato
Trend Sniper X
Sarvarbek Abduvoxobov
4.9 (41)
Trend Sniper X è un indicatore trend-following multi-timeframe per MetaTrader 5 che aiuta i trader a identificare la direzione del trend e i potenziali punti di inversione con chiarezza e precisione. per MT4: https://www.mql5.com/en/market/product/193245 Informazioni sul prezzo: Il prezzo attuale è promozionale ed è soggetto a modifiche con il rilascio di futuri aggiornamenti e nuove funzionalità. Offerta Bonus: Per ricevere GRATIS l'Auto-Trade Assistant EA per questo indicatore, invia un messa
Smart Trend Trading System — MetaTrader 5 Dopo l'acquisto, inviami un messaggio su MQL5 per ricevere GRATUITAMENTE Smart Universal Expert Advisor, insieme al corso online, al manuale PDF e all'accesso al gruppo privato. STTS riunisce la direzione del trend, i segnali di entrata e uscita, le zone di inversione e i livelli di prezzo importanti direttamente sul grafico. Segui il sistema manualmente oppure collega un EA compatibile separato per eseguire le operazioni automaticamente con le impostazi
La leggenda ritorna: Entry Points Pro 10. Il rilancio del leggendario indicatore che per 3 anni è rimasto nella Top-3 del MQL5 Market. Centinaia di recensioni entusiaste (589 su due versioni), migliaia di trader lo usano ogni giorno per operare, 31.000+ download della demo   MT4+MT5 . Ho letto ogni vostra recensione degli ultimi cinque anni — e invece di promesse ho inserito nella versione 10 le risposte. Dall'autore che opera sui mercati dal 1999 e tiene all'onestà, alla propria reputazione e a
Gann Made Easy è un sistema di trading Forex professionale e facile da usare che si basa sui migliori principi del trading utilizzando la teoria di mr. WD Gann. L'indicatore fornisce segnali ACQUISTA e VENDI accurati, inclusi i livelli di Stop Loss e Take Profit. Puoi fare trading anche in movimento utilizzando le notifiche PUSH. CONTATTAMI DOPO L'ACQUISTO PER RICEVERE GRATUITAMENTE LE ISTRUZIONI DI TRADING E OTTIMI INDICATORI EXTRA! Probabilmente hai già sentito parlare molte volte dei metodi d
Neuro Poseidon MT5
Daria Rezueva
4.75 (52)
Neuro Poseidon is a new indicator by Daria Rezueva. It combines precise trading signals with adaptive TP/SL levels - creating best possible trades as a result! Message me and get  Neuro Poseidon Assistant  as a gift to automize your trading process! What makes it stand out? 1. Proven profitability on all assets and timeframes 2. Only confirmed BUY and SELL signals present on the chart 3. Adaptive TP & SL levels generated by the software for each trade 4. Easy to understand - suitable for al
Auto Optimized SpeedAngle è un sistema di vettorizzazione del momento di livello istituzionale che elimina l'overfitting ( curve-fitting ) attraverso l'ottimizzazione continua Walk-Forward (WFO). Invece di affidarsi a input statici che si degradano quando i regimi di mercato cambiano, l'indicatore recalibra dinamicamente i suoi parametri utilizzando la validazione Out-of-Sample (OOS), assicurando che i segnali visualizzati rappresentino reali vantaggi statistici anziché anomalie storiche. Quadro
Ciao a tutti i trader! Molti investitori individuali utilizzano script web lenti. Un approccio sistematico è essenziale per un trading redditizio. L'indicatore Astro AI non è semplicemente una visualizzazione su un grafico. Si tratta di una sofisticata rete neurale composta da due agenti che operano direttamente all'interno del terminale. Dettagli tecnici del sistema: 1. Agente 1: Analista (Rete neurale grafica – GNN) Il mercato non è costituito da singole barre di prezzo, ma da una rete di
Adaptive Price Action Engine Acquista un indicatore, ricevi l'EA gratis Analisi Auto-Ottimizzata del Trend e dei Pattern Candlestick Multi-Timeframe I mercati cambiano continuamente e non tutti i pattern di Price Action hanno lo stesso valore in ogni condizione di mercato. Adaptive Price Action Engine è progettato per adattarsi alle condizioni di mercato in continua evoluzione, combinando struttura del trend, analisi Multi-Timeframe, pattern Candlestick e ottimizzazione statistica in un unico fr
M1 Sniper MT5
Oleg Rodin
5 (7)
M1 SNIPER   è un sistema di indicatori di trading facile da usare. Si tratta di un indicatore a freccia progettato per l'intervallo temporale M1. L'indicatore può essere utilizzato come sistema autonomo per lo scalping sull'intervallo temporale M1 e come parte del tuo sistema di trading esistente. Sebbene questo sistema di trading sia stato progettato specificamente per il trading sull'intervallo temporale M1, può comunque essere utilizzato anche con altri intervalli temporali. Inizialmente ho p
Divergence Bomber
Ihor Otkydach
4.89 (94)
Ogni acquirente dell’indicatore riceverà inoltre gratuitamente: L’utilità esclusiva “Bomber Utility”, che gestisce automaticamente ogni operazione, imposta i livelli di Stop Loss e Take Profit e chiude le posizioni secondo le regole della strategia I file di configurazione (set file) per adattare l’indicatore a diversi asset I set file per configurare il Bomber Utility in tre modalità: “Rischio Minimo”, “Rischio Bilanciato” e “Strategia di Attesa” Una guida video passo-passo per installare, con
Unix Scalper
Issam Kassas
4 (4)
Unix Scalper — MetaTrader 5 Dopo l'acquisto, inviami un messaggio su MQL5 per ricevere GRATUITAMENTE Smart Universal Expert Advisor, insieme al corso online, al manuale PDF e all'accesso al gruppo privato. Individua il setup. Esamina il piano. Scegli come operare. UNIX Scalper riunisce analisi di mercato, indicazioni BUY/SELL/WAIT e livelli Entry, Stop Loss, TP1 e TP2 in un unico pannello organizzato. VISUALIZZA IL SEGNALE E IL PIANO • Indicazioni chiare: BUY, SELL o WAIT. • Livelli definiti: E
Scalper Vault   è un sistema di scalping professionale che ti fornisce tutto il necessario per scalping di successo. Questo indicatore è un sistema di trading completo che può essere utilizzato dai trader di forex e opzioni binarie. L'intervallo di tempo consigliato è M5. Il sistema fornisce segnali di freccia accurati nella direzione della tendenza. Ti fornisce anche i segnali più alti e più bassi e i livelli di mercato di Gann. Gli indicatori forniscono tutti i tipi di avvisi, comprese le noti
RelicusRoad Pro MT5
Relicus LLC
4.96 (25)
Basta andare a intuito nei tuoi trade. Sai quando entrare, dove uscire e da che parte va il mercato, tutto su un solo grafico. RelicusRoad Pro riunisce quasi venti strumenti in un unico indicatore, e attivi quelli che si adattano al tuo modo di operare. Ingressi chiari. Uscite chiare. Un piano su ogni grafico. Ti suona familiare? Compri, e un minuto dopo il prezzo ti va contro. Chiudi troppo presto, poi guardi il movimento proseguire senza di te. Cinque indicatori sul grafico, cinque risposte di
Presentazione       Quantum Breakout PRO   , l'innovativo indicatore MQL5 che sta trasformando il modo in cui scambi le zone di breakout! Sviluppato da un team di trader esperti con un'esperienza di trading di oltre 13 anni,       Quantum Breakout PRO       è progettato per spingere il tuo viaggio di trading a nuovi livelli con la sua strategia innovativa e dinamica della zona di breakout. Quantum Breakout Indicator ti fornirà frecce di segnalazione sulle zone di breakout con 5 zone target di
Quant Direction MT5
Georgios Kalomoiropoulos
Quant Direction è uno strumento di analisi di mercato 3D. Offre un'analisi di mercato perfettamente oggettiva, basata su algoritmi, calcolando con precisione le deviazioni percentuali su diversi parametri. Sviluppato utilizzando strumenti di modellazione avanzati basati sull'intelligenza artificiale e rigorosamente testato, questo algoritmo analizza il mercato con una precisione senza pari. È possibile analizzare qualsiasi coppia di valute o strumento finanziario sulla piattaforma. Che si pratic
Volatility Master for MetaTrader is a real-time dashboard tool that scans up to  50 symbols  to identify high-volatility , trending markets instantly. With bullish/bearish signals, customizable alerts, and a user-friendly interface, it helps you avoid range-bound conditions and focus on high-probability trades. Clarity leads to confidence. Trade confidently and protect your capital effectively with this powerful dashboard. We don't offer free or bonus indicators in exchange of reviews from you.
Quantum TrendPulse
Bogdan Ion Puscasu
5 (26)
Ecco   Quantum TrendPulse   , lo strumento di trading definitivo che combina la potenza di   SuperTrend   ,   RSI   e   Stocastico   in un unico indicatore completo per massimizzare il tuo potenziale di trading. Progettato per i trader che cercano precisione ed efficienza, questo indicatore ti aiuta a identificare con sicurezza le tendenze di mercato, i cambiamenti di momentum e i punti di entrata e uscita ottimali. Caratteristiche principali: Integrazione SuperTrend:   segui facilmente l'andame
Reversal Master for MT5 Reversal Master for MT5 is a non‑repainting reversal indicator for MetaTrader 5. It helps you detect potential market reversal points and shows the maximum favourable price movement after each historical signal, so you can better understand how price behaved after similar situations in the past. The MT5 version keeps the familiar reversal‑signal logic of the original Reversal Master for MT4, but adds improved visualisation, historical statistics and a points summary panel
Atomic Analyst MT5
Issam Kassas
4.47 (60)
Atomic Analyst — MetaTrader 5 Dopo l'acquisto, inviami un messaggio su MQL5 per ricevere GRATUITAMENTE Smart Universal Expert Advisor, insieme al corso online, al manuale PDF e all'accesso al gruppo privato. Atomic Analyst riunisce l’azione del prezzo, la direzione del trend, i segnali di entrata e uscita, lo Stop Loss e diversi livelli di Take Profit direttamente sul grafico. INDIVIDUA IL SEGNALE. COMPRENDI IL CONTESTO OPERATIVO. Atomic Analyst organizza la sua analisi in informazioni visive ch
Power Candles MT5
Daniel Stein
4.58 (12)
Power Candles V3 - Indicatore di forza ad ottimizzazione automatica Power Candles V3 trasforma la forza delle valute e degli strumenti in un piano di trading attuabile su ogni grafico a cui è collegato. Invece di limitarsi a colorare le candele, esegue un'auto-ottimizzazione in tempo reale in background e ti fornisce i migliori valori di Stop Loss, Take Profit e soglia di segnale per il simbolo che hai davanti. Basta un clic per adottarlo nel trading live: i raggi di ingresso, Stop Loss e Take P
Mahra Pro Indicator MT5
Mahra Said Mohammed Al Kaabi
Mahra Pro Indicator MT5 Overview Mahra Pro is a MetaTrader 5 chart indicator designed to support structured analysis of XAUUSD (Gold). It combines trend, momentum, volatility and price-structure conditions to identify potential buy and sell setups and display them directly on the chart. The indicator does not open, modify or close trades. All trading decisions and order execution remain under the user's control. Main features • Buy and sell signal arrows on the chart. • Fast and slow EMA lines w
M1 Quantum MT5
Hamed Dehgani
4.2 (10)
Segnali di Trading Live con M1 Quantum: Segnale   (Operazione eseguita automaticamente dal Quantum Trade Assistant , incluso gratuitamente con questo prodotto.) Ultime notizie: La versione 1.64 è stata rilasciata. Ora tutte le operazioni hanno uno Stop Loss posizionato dietro le relative zone di Supporto/Resistenza. Anche la funzione Smart Close è stata migliorata per aumentare le prestazioni dell'EA in questa versione. Dal 9 agosto, il segnale live è in esecuzione sulla versione 1.64. Piano pr
Quantum Direction è un indicatore professionale di trend following progettato per identificare la direzione del mercato, rilevare i cambiamenti iniziali del trend e fornire segnali filtrati di ingresso e uscita. Questo indicatore include gratuitamente Quantum Trade Assistant , uno strumento professionale per la gestione delle operazioni disponibile sul MQL5 Market. Può collegarsi direttamente a Quantum Direction e aprire automaticamente le operazioni quando appare un segnale valido, oppure chiud
Advanced Supply Demand MT5
Bernhard Schweigert
4.53 (15)
La migliore soluzione per qualsiasi principiante o trader esperto! Questo indicatore è uno strumento di trading unico, di alta qualità e conveniente perché abbiamo incorporato una serie di funzionalità proprietarie e una nuova formula. Con questo aggiornamento, sarai in grado di mostrare fusi orari doppi. Non solo potrai mostrare una TF più alta, ma anche entrambe, la TF del grafico, PIÙ la TF più alta: SHOWING NESTED ZONES. Tutti i trader di domanda di offerta lo adoreranno. :) Informazioni imp
Smart Market Structure Toolkit
Garry James Goodchild
5 (1)
Smart Market Structure Pro by G-Labs — ICT and Smart Money Concepts toolkit with built-in multi-symbol scanner for MetaTrader 5. Break of structure, change of character, order blocks, fair value gaps, liquidity sweeps, premium and discount zones, ICT sessions, confluence scoring, AI trade ideas, and a traffic-light scanner across up to 30 pairs and four timeframes from one chart. Map SMC and ICT on the active chart while the built-in scanner monitors your full watchlist. Each cell shows BUY, S
CRT Pro is a complete Candle Range Theory toolkit for MetaTrader 5. It finds the CRT model on up to three timeframes and adds the tools needed to read it: higher-timeframe candles, structure shifts, fair value gaps, liquidity sweeps, a bias table and SSMT divergence. Every module can be switched on or off. 1. CRT Model A CRT model is built from two candles of the chosen CRT timeframe. C1 is the range candle. C2 is the sweep candle: it takes the high or the low of C1 and closes back inside the
Currency Strength Wizard   è un indicatore molto potente che ti fornisce una soluzione all-in-one per un trading di successo. L'indicatore calcola la potenza di questa o quella coppia forex utilizzando i dati di tutte le valute su più intervalli di tempo. Questi dati sono rappresentati in una forma di indice di valuta facile da usare e linee elettriche di valuta che puoi utilizzare per vedere il potere di questa o quella valuta. Tutto ciò di cui hai bisogno è collegare l'indicatore al grafico ch
By the time you've clicked through forty charts looking for a first red day at a monthly high, the setup you wanted has already closed. Market Maker Reversal Scanner reads your Market Watch, finds a fixed set of reversal and exhaustion patterns, scores each one on a transparent 10-point scale, and puts the results in a single sortable panel on one chart. You stop hunting. You start choosing. New in v12.1: a DAYS / SESSIONS switch. Sessions mode runs the same scanner on closed H4 candles and tags
ICT Pro
Robby Suhendrawan
Ultimate AIO ICT Concept Indicator per MT5: Padroneggia Automaticamente gli Smart Money Concepts Sei stanco di passare ore a tracciare manualmente i tuoi grafici ogni singolo giorno? L'indicatore AIO ICT Concept è la tua soluzione all-in-one completa per padroneggiare gli Smart Money Concepts. Progettato per eliminare le congetture e l'affaticamento emotivo dell'analisi tecnica manuale, questo potente strumento algoritmico mappa automaticamente gli elementi di price action più critici direttamen
The Oracle Pro
Ottaviano De Cicco
5 (1)
The Oracle Pro: Synthetic Multi-Timeframe Bias Engine for MT5 ️ Summer Launch Offer — Get The Oracle Pro for USD 199 (early buyers). Price rises with traction; final price USD 399. The Oracle Pro is a premium multi-timeframe bias engine for MetaTrader 5, built for demanding and professional traders. It answers one question with discipline: what is the directional bias on each timeframe right now, how strong is it, and how much do the timeframes agree? Everything is computed on closed bars only
Altri dall’autore
L'indicatore calcola le aree di arresto/inversione di tendenza più probabili, le aree di movimento di tendenza sicure. Il calcolo considera: il tasso di variazione del prezzo; l'angolo di deviazione relativa del grafico; l'ampiezza media dei movimenti di prezzo; il prezzo che esce dalla sua "zona di comfort"; i valori dell'indicatore ATR. L'indicatore può generare un avviso quando il prezzo entra in un'area di stop/inversione. Impostazioni Disegna l'intera lunghezza? - disegnare le aree fino
Buy and sell zones
Evgeniy Zhdan
5 (2)
Indicator for determining flat and trend. If the price is below any of the two histograms and two lines (red and blue), this is a sell zone. When purchasing this version of the indicator, MT5 version for one real and one demo account - as a gift (to receive, write me a private message)! If the price is above any of the two histograms and two lines (red and blue), this is a buy zone. MT5 version:  https://www.mql5.com/en/market/product/70409 If the price is between two lines or in the zone of
SuperTrend
Evgeniy Zhdan
2.5 (2)
The Supertrend Expert Advisor The Supertrend Expert Advisor with averaging elements. It has been developed during three months until I finally got good results. It is not a scalper. The minimum balance to start trading - 100 $. Is automatically adjusted to the 4 and 5-digit prices. Has an efficient risk management system. The lot and limit on the maximum lot is automatically calculated based on the settings specified in the EA. As a result, you have a complete automated trading system. Download
Stardust
Evgeniy Zhdan
StarDust searches for divergences in the values of several indicators considering them as signs of flat and enters the market if a relatively steady trend is detected. The Expert Advisor trades "basic" symbols with a low spread. The best results are achieved on М15. The EA automatically adjusts to 4 and 5-digit quote flows. Settings Comment_to_orders – comment to a placed order. The field can be left blank if no comment is required. MM – enable money management with automatic setting of a worki
Top Floor
Evgeniy Zhdan
The EA catches the price when it moves against the trend in an effort to open an order in an opposite direction (direction of the main trend). Screenshots illustrate examples of entries and the strategy gist. The EA uses stop losses depending on values of ATR. Settings: Lot_ - if Risk_ = 0, the EA will trade this lot; Risk_ - risk per one trade. Stop loss is taken into account; koeff_ATR - coefficient multiplied by the ATR value to calculate stop loss (the bigger the value, the bigger stop loss
FastBoom
Evgeniy Zhdan
The FastBoom EA finds the most probable points of price pullback/reverse and places an order. It places averaging orders if the price moves further against take profit. Settings of the EA: Lots - initial lot; LotExponent - multiplier for following orders (Martingale). 1 - no multiplier. TakeProfit - take profit in points; Stochastic Settings InpKPeriod - K Period of Stochastic InpDPeriod - D Period of Stochastic InpSlowing - Stochastic Slowing LevHigh - level for sell positions of Stochastic L
The Expert Advisor calculates the double/triple divergence of volumes, and starts trading. It uses a unique formula of lot calculation, which greatly improves stability of trading. Recommended TF - 1h. Currency pair - EURUSD , but the EA can be used on any trading instruments which are not subject to high volatility. Settings mode - trading direction can be set manually; close - order close level (details on the screenshot); Step between orders - step between orders in points; Maximum orders -
OrderOnLine
Evgeniy Zhdan
The Expert Advisor opens orders from the horizontal line, the a trader can set on any level by dragging using the mouse or by changing the line properties. For example, when a horizontal line is above the current price, the EA will open a Buy order once the horizontal line is reached. And vice versa: If the line is below the current price, the EA will open a sell order once the line is crossed. A buy crossover of the line is: opening of the current candlestick below the horizontal line; the curr
SellerATR
Evgeniy Zhdan
5 (1)
The Expert Advisor only sells. Recommended currency pairs : EURUSD; GBPUSD; USDCHF; USDJPY; USDCAD; AUDUSD; EURGBP; EURAUD; EURCHF; EURJPY; GBPCHF; CADJPY; GBPJPY; AUDNZD; AUDCAD; AUDCHF; AUDJPY; CHFJPY; EURNZD; EURCAD; CADCHF; NZDJPY; NZDUSD. Timeframe: H1. Percent% manages closing both loss-making and profitable deals based on the account overall status. Using the EA on 23 symbols mentioned above allows the robot to cope with the drawdown in case of a long trend. While positions on some pairs
Illusion
Evgeniy Zhdan
3 (2)
The Illusion EA uses the probability theory - after a series of consecutive virtual losses - i.e. right during a flat the EA already starts trading in the trend. In addition, the EA considers the ratio of bullish/bearish candles on the higher timeframes to determine the greatest probability of the price movement direction. Only 1 order can be opened at a time. In case of a loss the following order will be placed with an increased lot (the multiplication coefficient is set in the parameters). The
The indicator plots a trend line and determines the levels for opening trades, in case the price goes "too far" away from the trend level. More detailed information is available in the screenshots. Settings Away from the trend line - distance from the trend line to the trades level; Arrow Signal for deals - enable displaying an arrow when the price reaches the trades level; Size of Arrow - size of the arrow; Alert Signal for deals - enable generating alerts when the price reaches the trades lev
Turbina
Evgeniy Zhdan
5 (4)
The axiom of the Forex market is that any trend will be broken. The Expert Advisor determines trend direction (the pink line), and calculates levels for opening opposite orders depending on the settings. The value of Away from the trend line for Deal will be different for each pair and timeframe, depending on the volatility of the trading instrument. Next orders can be opened with an increased lot (a static lot is used by default). See the screenshots to understand the idea of the Expert Advisor
Odysseus
Evgeniy Zhdan
The Expert Advisor determines the moments of strong movements and opens a position in the direction of the most probable price movement. The strategy always uses stop loss and take profit. Several independent orders can be in the market (the maximum number is set in parameters). The goal of the EA's underlying trading system is the quantitative excess of the number of profitable deals over the number of losing ones. Recommended: EURUSD 5m; GBPUSD 5m; USDJPY 5m. The Expert Advisor is able to work
Vise
Evgeniy Zhdan
Vise is a trend indicator. The upper and lower lines follow the price showing the prevailing price direction. Frequent breakthroughs of the upper line indicate a bullish trend, while frequent breakthroughs of the lower line indicate a bearish one. Parameters Points for UpLine - initial number of points for the upper line; Points for DownLine - initial number of points for the lower line. During the breakthrough of the upper level (line), this level shifts upwards by Points for UpLine. If the up
Twinkle
Evgeniy Zhdan
Twinkle is a trend-based scalper using stop loss and take profit invisible to the broker. The EA does not look for trend reversals. The EA catches strong market movements and opens orders in the direction of the trend. Your broker will not see the order closing levels. The EA closes orders independently when reaching the take profit or stop loss levels specified in the settings. Recommended trading symbols: EURUSD M5, GBPUSD M5. ECN accounts with 5 digits quotes are recommended. Expert Advisor
Shine
Evgeniy Zhdan
4.75 (4)
This Expert Advisor implements elements of the Martingale system. Orders are opened at a specified distance from the moving average. The Parabolic SAR indicator and certain technical details are used to ensure the most accurate entries. The EA is highly customizable. It is recommended for simultaneous use on 4 currency pairs: EURUSD M15; GBPUSD M15; USDJPY M15; USDCAD M15. Despite good stability, it is advisable to disable the EA operation during the days rich in news releases. Configurations P
LuckyCase
Evgeniy Zhdan
LuckyCase is an Expert Advisor with martingale elements. The EA strategy is based on a significant "deviation" of the price from SAR inadicator and the Bands levels breakthrough point. The money management system is an essential part of the EA. It starts working after a trade is opened. Trades are closed after accumulating specified points of market orders, by deposit % or after an opposite side of the channel is broken through. The default EA settings are meant for: EURUSD M15; USDJPY M15. The
Elize
Evgeniy Zhdan
The Elize Expert Advisor has been designed to work with the EURCHF currency pair. It considers the peculiarities of this trading instrument, its behavior and dependence on the behavior of other currencies. In particular, when the currencies of the European countries (EURUSD, GBPUSD, EURNOK, EURCHF) move in the same direction, the EA starts its operation and opens a deal in the trend direction of the European currencies. In the event of price rollbacks, the EA uses a unique method for making the
AllTrendLines
Evgeniy Zhdan
4 (1)
Brief Description of the All Trend Lines Indicator The indicator analyzes the wave structure of the market. What it displays on the chart: First. Wave pivots (semaphores) • Red markers – wave highs • Yellow markers – wave lows • Yellow-green markers – additional local extremes Second. Trend lines • Purple/blue lines – trends based on highs (resistance/support) • Beige/green lines – trends based on lows • Lines are built automatically by connecting wave pivots of the same type Third. Main trend
FastTraffic
Evgeniy Zhdan
The Expert Advisor has been specifically developed for trading gold (Spot Gold). The strategy is based on Fibo levels calculated from the previous (first) candle High/Low and the width of the current and lower timeframes channel. If important Fibo levels of different orders are located in a single price channel (within a spread), the EA defines this channel as the target for price movement and starts operation. Martingale and averaging are not used. Each order is independent and is accompanied b
Jazz
Evgeniy Zhdan
The algorithm of this Expert Advisor determines the significant price levels, where the trend often turns into a flat or reverses. Stochastic Oscillator serves as an additional filter of overbought/oversold zones. The EA sets stop loss and take profit after opening an order. The underlying trailing strategy applies a trailing stop. The EA is recommended for simultaneously use on three trading instruments: EURUSD M5, GBPUSD M5, EURCHF M5. Settings: Comment to order - comment to orders. MaxRisk -
Panther
Evgeniy Zhdan
The Expert Advisor looks for technical analysis patterns formed on the higher (hourly) timeframe to start working on the 5-minute chart. Technical analysis patterns used: double top/double bottom, head/shoulders, flag, expanding/narrowing triangles. The Relative Vigor Index technical indicator is used as the filter for opening deals. It is based on the idea that on the bull market the closing price is, as a rule, higher, than the opening price. It is the other way round on the bear market. This
Spook
Evgeniy Zhdan
The Expert Advisor calculates the divergence on the current and higher timeframes. In case the divergences coincide, the EA starts its operation. Deals have strict take profit and stop loss levels. Each deal is managed by trailing stop. The strategy involves the use of a tight stop-loss. Therefore, losing deals and/or series of losing deals are not uncommon. This EA is not suitable for those who have difficulties coping with losing deals. The EA is recommended for simultaneous use on the followi
Grand
Evgeniy Zhdan
The Expert Advisor has been developed specifically for the features of the CHFJPY currency pair. The EA's algorithm determines the direction of the current trend and starts operation. In case of a price reversal within the current trend, the EA adds additional orders. If trend changes, the EA starts to work in the direction contrary to the initial grid of orders. If there were no conditions for closing orders and the trend direction changed again, the EA continues to work with the "first" grid o
Intensive
Evgeniy Zhdan
The Expert Advisor algorithm determines on daily charts those candlestick patterns, which set the intraday trading direction. The trading EA determines how long the price is moving in overbought/oversold zones and starts working in the direction of the expected trend movement. Each position is accompanied with a tight stop loss and take profit. Only one active position can be open in the market. The EA was developed and tested using 99% quality quotes. The Expert Advisor has a built-in news filt
Slender
Evgeniy Zhdan
The strategy of this Expert Advisor is based on a hedging system, which implies placing opposite orders. The EA algorithm determines trend beginning and opens a position in the trend direction. In case of a wrong entry, the EA tries to neutralize the drawdown through opposite (hedging) orders at a preset interval (Coefficient of counter orders). Orders are closed when one of the two values ​​is reached - profit in percent or profit in points. The EA does not use lot increase. The EA wast tested
Dreamer
Evgeniy Zhdan
Советник работает по принципу хеджирования с периодическими "перекосами" в сторону трендовых направлений. Направления тренда советник определяет на основании стандартного индикатора Parabolic Stop and Reverse system (SAR). Уникальная стратегия установки балансирующих позиций позволяет избегать больших просадок даже при самых не благоприятных рыночных условиях. Параметры по умолчанию рекомендуется использовать на торговом инструменте: GBPJPY 15m. Разработка и оптимизация параметров производились
Snoot
Evgeniy Zhdan
5 (1)
This Expert Advisor works using a grid in the direction of a trend movement with the step between opened positions defined in the settings. The positions are closed by the total take profit. The Parabolic SAR standard indicator is used to filter order opening, which comes in the MetaTrader 4 package. The EA has been developed and tested using 99,9% quality of quotes. Operation of the EA in real time can be viewed in the signals . The best trading results have been achieved on CHFJPY M15. Settin
Solipsism
Evgeniy Zhdan
The Expert Advisor builds channels based on the data obtained using ATR and MA indicators according to the equations: Upper channel border = MA + ATR * (FIBO); Lower channel border = MA - ATR * (FIBO), where FIBO has the following values: Style of Trade - Aggressive = 1.61852; Style of Trade - Average = 3.26704; Style of Trade - Calm = 4.85556. Trades are opened inside the channel with the intervals defined in the settings. Long and short positions are opened independently. Positions are closed
The trading statistics indicator notifies the trader of the aggregate income of the trading account for different time intervals. The indicator has wide display settings on the graph. There is a choice of one of the two display languages on the chart- English and Russian. Settings Indicator language (ENG, RUS) - Select the language to display on the chart; To control the magic (-1: any magic) - Entering the Magic for control (-1: any Magic); Angle of indicator tie - Selecting the angle of the c
Filtro:
Nessuna recensione
Rispondi alla recensione