Session Flow Map MT5

SessionFlowMap — Perfil multissessão de volume e delta com níveis POC

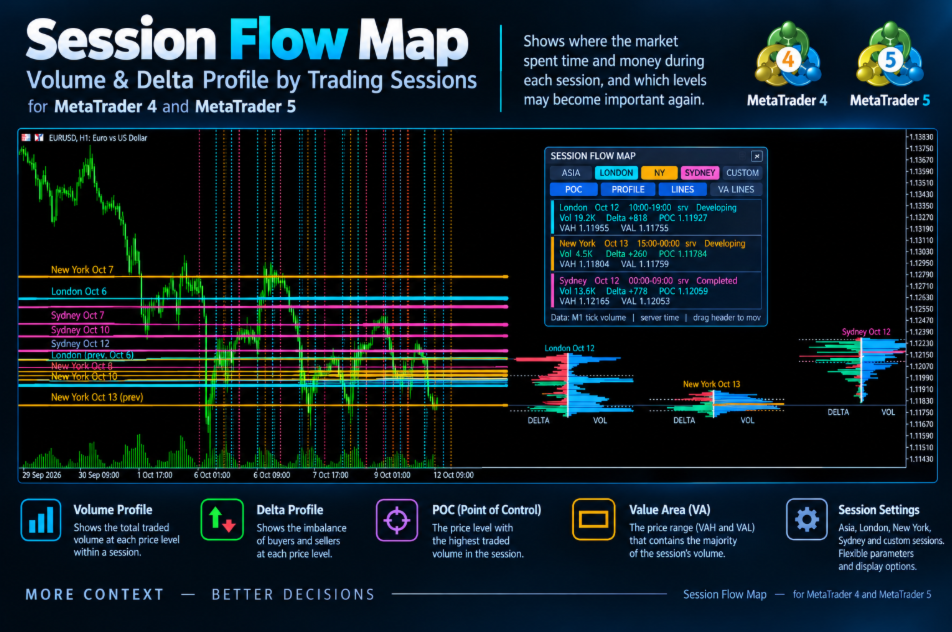
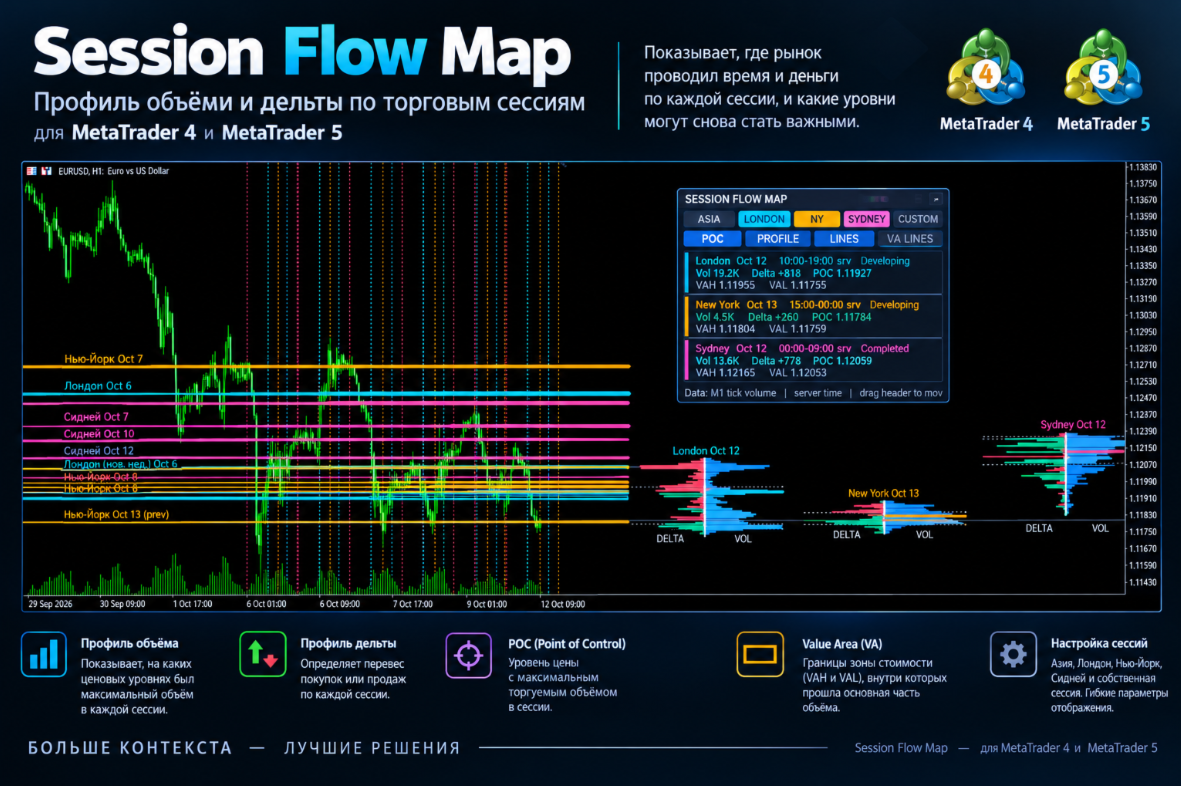
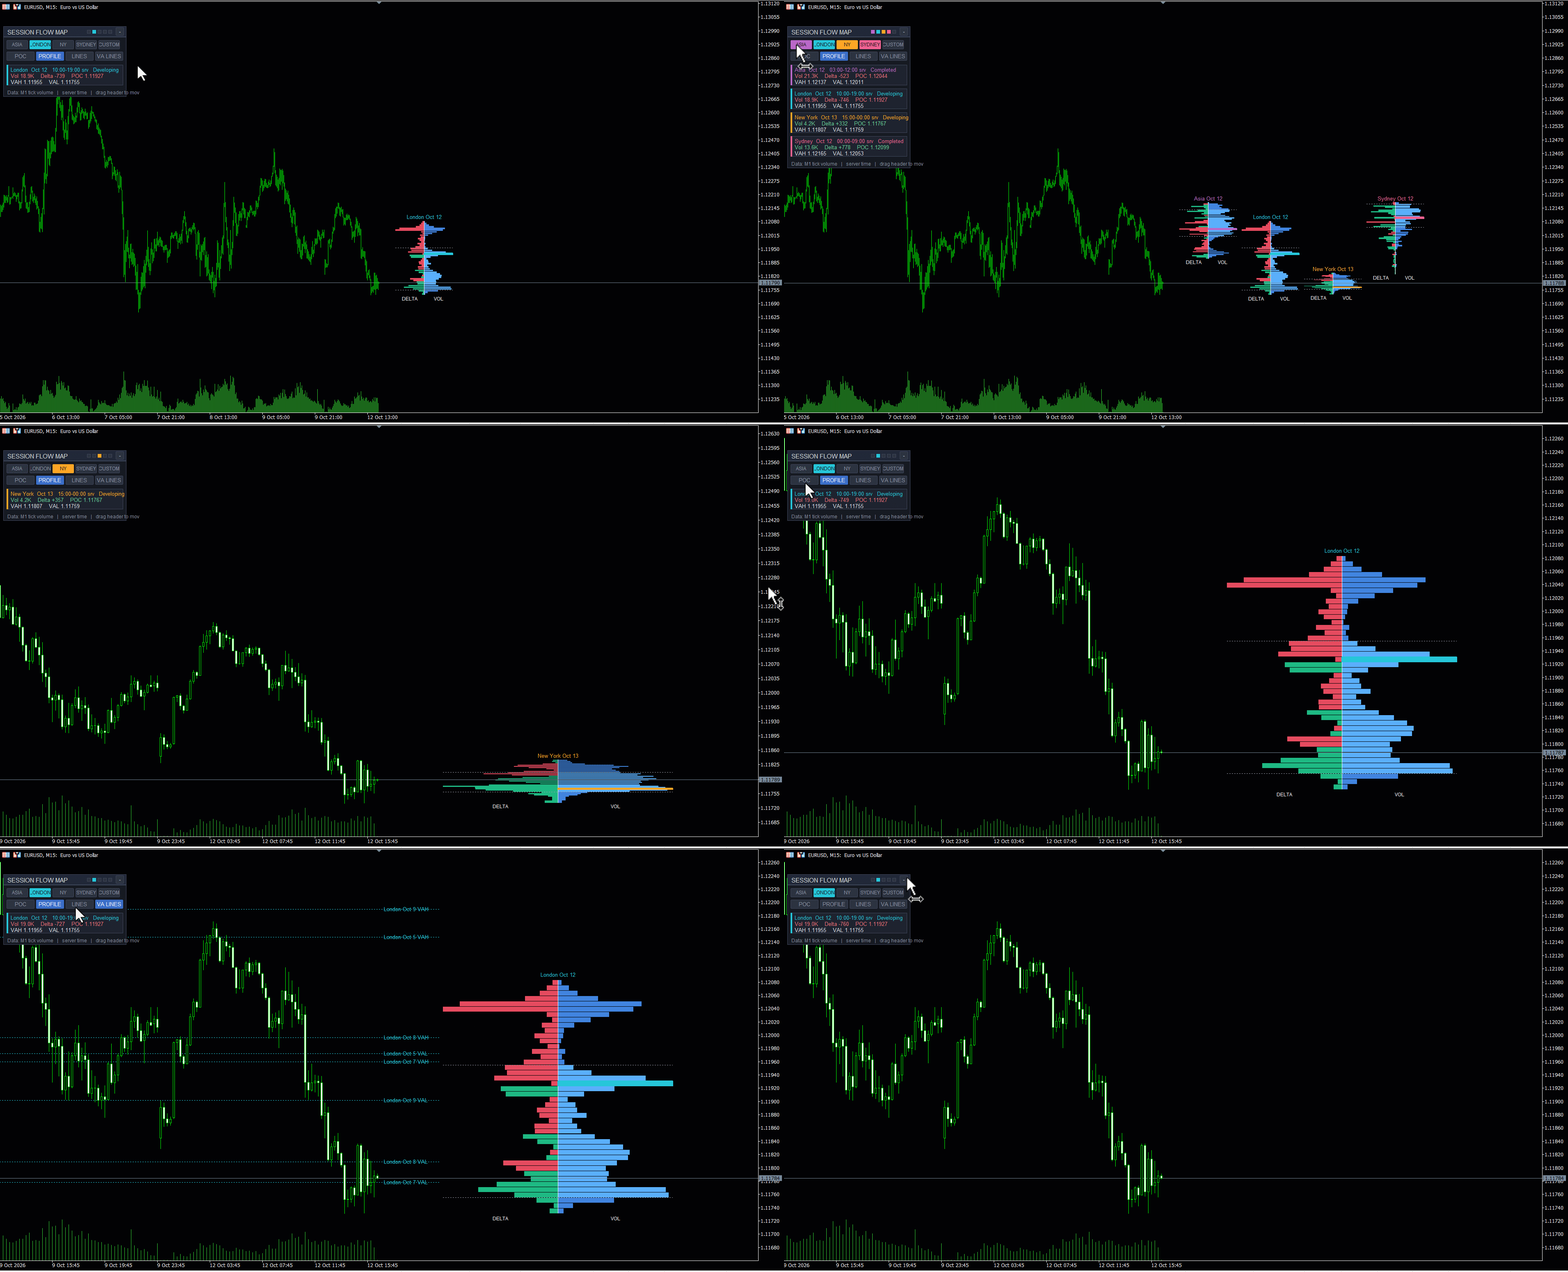
O SessionFlowMap constrói um perfil de volume e um perfil de delta (desequilíbrio entre compras e vendas) para as sessões do dia no forex: Ásia, Londres, Nova York e, opcionalmente, Sydney e uma sessão personalizada. Para cada sessão, encontra o POC (Point of Control: o preço com maior volume negociado) e a Value Area (VAH e VAL: a faixa que concentra a maior parte do volume), e projeta esses níveis para a frente como linhas horizontais. Você vê de relance onde o mercado gastou tempo e dinheiro em cada sessão e quais níveis podem voltar a ser relevantes.

MT4-version: https://www.mql5.com/en/market/product/200941

Como funciona

  • Cada sessão é recortada do histórico M1 de acordo com os seus próprios horários. Os horários de Ásia, Londres, Nova York e Sydney são definidos em GMT e convertidos automaticamente para o horário do servidor da sua corretora. A sessão personalizada usa diretamente o horário do servidor.
  • A faixa de preços da sessão é dividida em linhas de preço (você define o número desejado) e o volume é distribuído entre elas. O forex não tem volume centralizado, por isso é usado o volume de ticks.
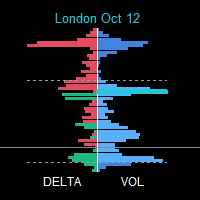
  • O perfil de volume é o volume total em cada linha. O perfil de delta é o volume de compras menos o de vendas em cada linha (verde: dominam os compradores; vermelho: dominam os vendedores).
  • No modo «M1 bars», a divisão entre compras e vendas é estimada pela posição do fechamento de cada vela dentro do seu intervalo. No modo «Real ticks», vem da direção de cada tick (ou das marcações BUY/SELL, quando a corretora as fornece).
  • O POC é a linha com maior volume. A Value Area expande-se a partir do POC até cobrir a porcentagem de volume escolhida (70 % por padrão), o que dá o VAH e o VAL.
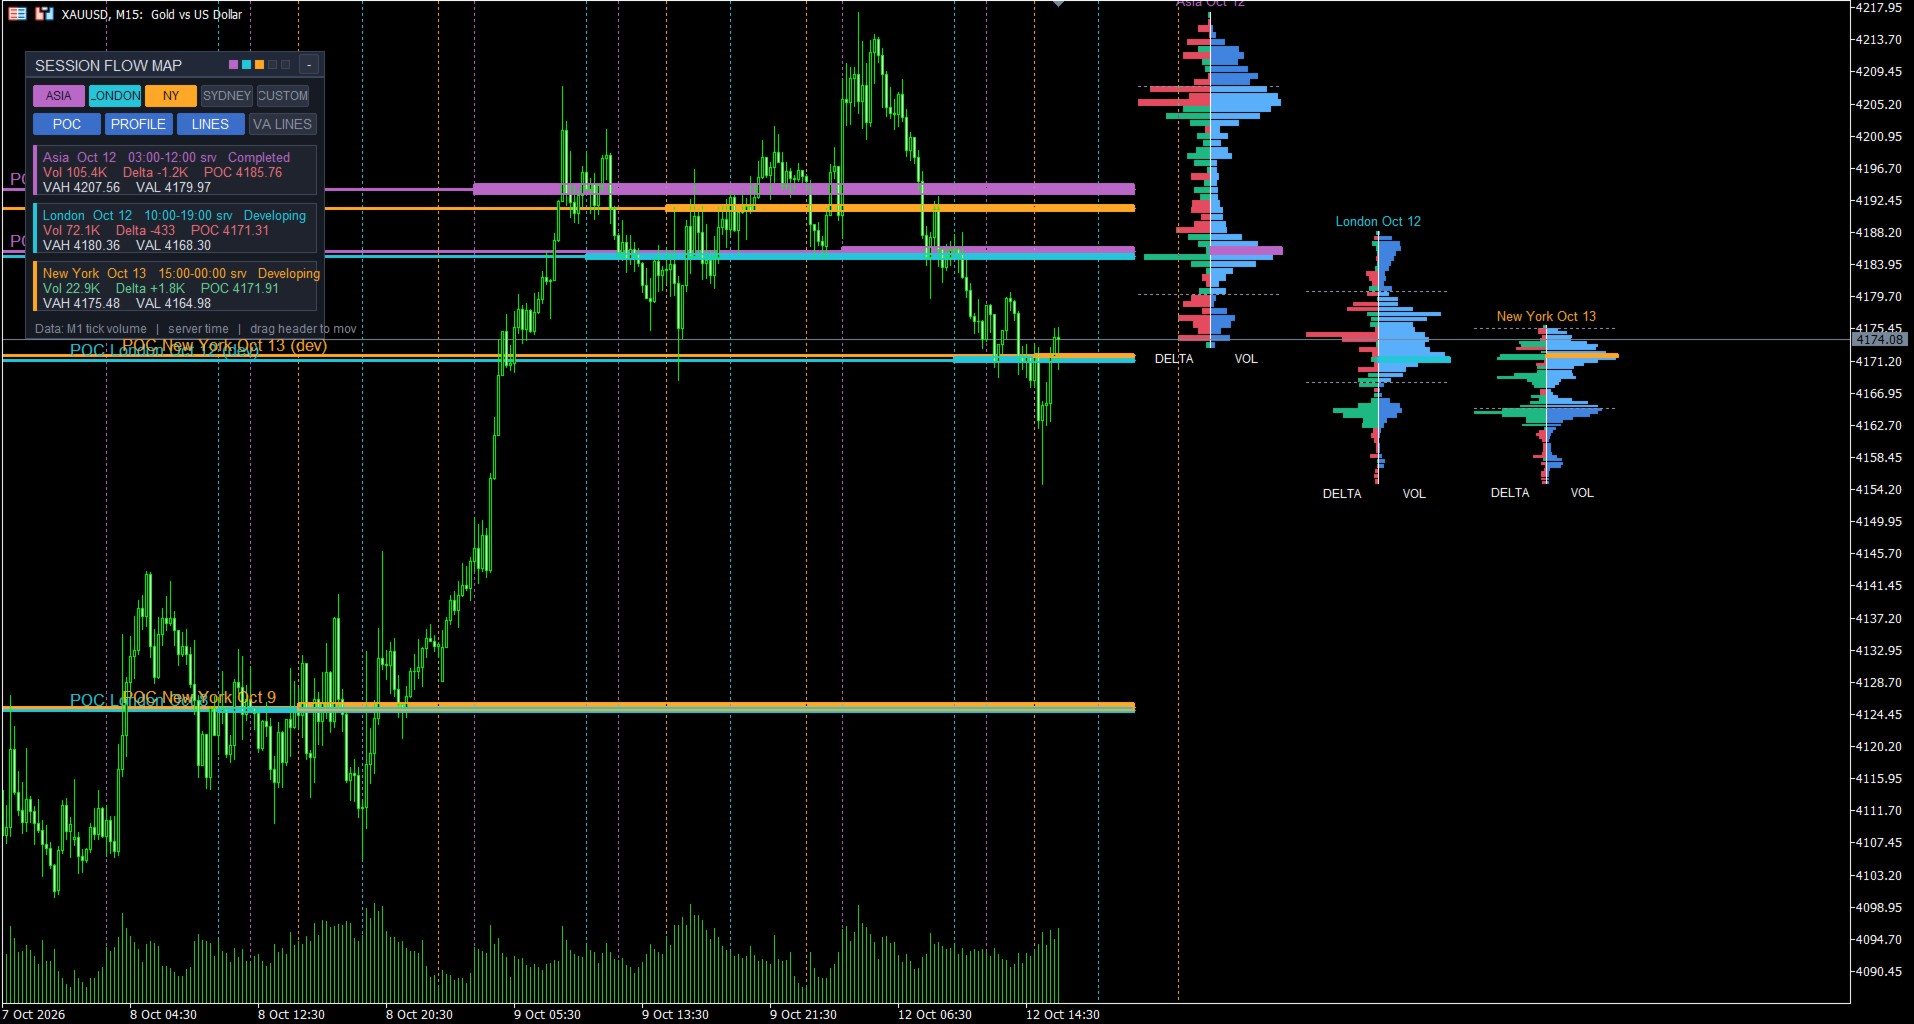
  • O último perfil de cada sessão é desenhado como um cluster à direita da última vela (volume e delta costas com costas em torno de um divisor) ou dentro da própria sessão no gráfico. O POC é desenhado como zona e/ou linha; uma linha longa atravessa todo o gráfico com um rótulo acima, à esquerda. Os POCs de sessões anteriores permanecem no gráfico como níveis de referência.
  • Linhas verticais marcam o início e o fim de cada sessão. Cada sessão tem a sua própria cor.

Como um trader pode usar

  • O POC da sessão anterior como suporte ou resistência e como «ímã» para o preço: observe como o preço reage ao voltar ao nível.
  • Modo POC «nu» (naked POC): níveis que o preço ainda não revisitou permanecem estendidos; após o primeiro toque, a linha para.
  • VAH e VAL como limites do valor justo: aceitação dentro da área, rejeição fora dela e rompimentos da Value Area.
  • O perfil de delta mostra em quais preços dominaram os compradores ou os vendedores; compare a delta no POC com as linhas vizinhas.
  • Contexto das sessões: a faixa asiática, a posição dos POCs de Londres e Nova York em relação a ela e a sobreposição entre Londres e Nova York.
  • Confluência: quando POCs de sessões e dias diferentes ficam próximos, formam uma zona mais significativa.
  • Os alertas avisam quando o preço volta aos níveis estendidos.
  • Funciona em qualquer símbolo e período gráfico (os perfis são construídos a partir do M1); M5–H1 é o uso mais comum.

Painel e botões

  • Arraste o painel pelo cabeçalho e recolha-o com o botão «-». Os pontos coloridos no cabeçalho mostram quais sessões estão ativas.
  • Os botões ASIA, LONDON, NY, SYDNEY e CUSTOM ligam e desligam sessões diretamente no gráfico.
  • Os botões POC, PROFILE, LINES e VA LINES alternam camadas: níveis POC, perfis, linhas verticais das sessões e VAH/VAL estendidos.
  • Cada sessão tem um cartão: nome, data, horário em hora do servidor, estado (Completed ou Developing), volume, delta, POC, VAH e VAL. A linha inferior indica a fonte de dados.
  • A posição do painel, o estado recolhido e o estado dos botões são lembrados separadamente para cada gráfico.

Requisitos

O histórico M1 do período necessário deve estar carregado. Ative o deslocamento do gráfico (Chart shift) e deixe espaço livre à direita para os clusters de perfis.

Configurações

1. Sessions

  • «Show Asian session» — ativa a sessão asiática (o botão ASIA no painel faz o mesmo).
  • «Asian session hours (GMT, HH:MM-HH:MM)» — início e fim da sessão asiática em GMT, padrão 00:00-09:00. Sessões que atravessam a meia-noite são suportadas.
  • «Show London session» / «London session hours (GMT, HH:MM-HH:MM)» — a sessão de Londres, padrão 07:00-16:00.
  • «Show New York session» / «New York session hours (GMT, HH:MM-HH:MM)» — a sessão de Nova York, padrão 12:00-21:00.
  • «Show Sydney session» / «Sydney session hours (GMT, HH:MM-HH:MM)» — a sessão de Sydney, desligada por padrão, horário 21:00-06:00.
  • «Show custom session (broker day by default)» / «Custom session hours (SERVER time, HH:MM-HH:MM)» — a sua própria sessão em hora do servidor; o padrão 00:00-24:00 é o dia inteiro da corretora.
  • «Auto-detect broker GMT offset» — o deslocamento do servidor em relação ao GMT é detectado automaticamente, incluindo as mudanças de horário de verão da corretora.
  • «Manual broker GMT offset, hours (if auto is off)» — deslocamento fixo em horas quando a detecção automática está desligada.
  • «Skip sessions starting on Saturday/Sunday» — ignora sessões que começam no fim de semana. Dica: os horários de Londres e Nova York estão definidos em GMT; quando esses centros mudarem para o horário de verão, desloque as horas em uma hora.

2. Data

  • «Data source» — «M1 bars (tick volume, fast)»: cálculo rápido a partir de barras de um minuto; «Real ticks (precise, slower)»: cálculo preciso a partir de ticks, porém mais lento.
  • «Refresh interval (seconds)» — com que frequência a sessão atual é recalculada e redesenhada. Uma nova vela provoca o recálculo imediatamente.

3. Volume and delta profiles

  • «Show volume profile» — mostrar o perfil de volume.
  • «Show delta profile» — mostrar o perfil de delta.
  • «Volume profile side (delta is opposite)» — em que lado do divisor o volume é desenhado; a delta vai para o lado oposto.
  • «Target price rows per session (10-70)» — nível de detalhe do perfil. Se houver objetos demais, as linhas são agrupadas apenas no desenho; o POC e a Value Area continuam exatos.
  • «Profile placement» — «Shared divider at right»: os últimos perfis de todas as sessões ficam lado a lado à direita da última vela; «Session edges»: o perfil é desenhado dentro do intervalo de tempo da sessão.
  • «Previous sessions: edge» — em qual borda da sessão (esquerda ou direita) os perfis anteriores são desenhados.
  • «Profiles to display» — «Latest session of each type only»: apenas a sessão mais recente de cada tipo; «Latest + previous sessions»: mais as anteriores.
  • «Previous sessions with full profiles (1-10)» — quantas sessões anteriores de cada tipo são mostradas com perfil completo.
  • «Profile width (% of session, edges mode)» — largura máxima de cada metade do perfil como porcentagem da duração da sessão.
  • «Shared divider: width per side (bars)» — largura de cada metade do perfil em velas no modo de divisor compartilhado.
  • «Shared divider: gap after last bar (bars)» — distância da última vela até o cluster; aumente se os perfis atrapalharem o preço.
  • «Show value area high / low lines» — linhas pontilhadas de VAH e VAL em cada perfil.
  • «Value area (%)» — proporção do volume dentro da Value Area, 70 por padrão.
  • «Show volume / delta numbers in rows» — números de volume e delta dentro das linhas.
  • «Drawing budget (max histogram boxes)» — limite de objetos do histograma para manter o terminal rápido.

4. POC

  • «Show POC» — mostrar o POC.
  • «POC display» — «Zone»: uma zona preenchida sobre a linha do POC; «Line»: uma linha.
  • «Zone width basis» — «POC row»: a zona equivale à linha do POC; «Custom points»: uma zona de largura definida em torno do centro.
  • «Custom zone total width (points)» — largura total da zona em pontos para o modo «Custom points».
  • «Extend developing session POC right» — estende para a direita o POC de uma sessão ainda em formação.
  • «Zone transparency (0-100)» — transparência do preenchimento da zona.
  • «Zone border width» — espessura da borda da zona.
  • «Show POC center line inside zone» — uma linha tracejada pelo centro da zona.
  • «POC line across the whole chart (extended POCs)» — a linha do POC vai do início do histórico até o cluster, com um rótulo acima, à esquerda.
  • «POC line width» — espessura da linha do POC.

5. Previous sessions levels

  • «Extend previous sessions' POC right» — estende para a direita os POCs das sessões concluídas.
  • «Previous sessions to extend per session type (1-30)» — quantas das últimas sessões concluídas de cada tipo são estendidas.
  • «Allow incomplete sessions in history» — permite estender níveis de sessões com dados incompletos (marcados com um asterisco *).
  • «Show dated level labels» — rótulos de nível com o nome da sessão e a data.
  • «Naked POC mode: stop extension at first revisit» — a linha para no momento em que o preço volta pela primeira vez ao POC.
  • «Also extend previous VAH / VAL right» — estende também o VAH e o VAL das sessões anteriores.
  • «Extension length to the right (bars)» — comprimento da extensão para a direita em velas quando o cluster não limita as linhas.
  • «Stop extended lines before the profile cluster (shared divider mode)» — as linhas terminam antes do cluster de perfis, para que ele fique limpo.

6. Colors

  • «Asian session color», «London session color», «New York session color», «Sydney session color», «Custom session color» — cores das sessões: POC, linhas, rótulos e cartões do painel.
  • «Volume» — cor do histograma de volume.
  • «Volume inside value area» — cor do volume dentro da Value Area.
  • «Positive delta» / «Negative delta» — cores da delta positiva e negativa.
  • «Value area lines» — cor das linhas VAH e VAL.
  • «Profile transparency (0-100)» — transparência dos histogramas.
  • «Show profile titles» — títulos acima dos perfis (nome da sessão e data) e abaixo deles (VOL e DELTA).

7. Alerts

  • «Alert when price touches extended POC / VAH / VAL» — ativa alertas quando o preço toca níveis estendidos (VAH e VAL se a sua extensão estiver ativada).
  • «Popup alert» — janela pop-up.
  • «Push notification» — notificação push para o aplicativo móvel.
  • «Sound alert» — sinal sonoro.
  • «Touch tolerance (points)» — tolerância de toque em pontos.

8. Panel

  • «Show interactive panel (drag header, buttons)» — mostrar o painel com botões.
  • «Panel start X (drag header to move)» / «Panel start Y (drag header to move)» — posição inicial do painel; depois você pode arrastá-lo com o mouse.

9. Session lines

  • «Show vertical lines at session start / end» — linhas verticais no início e no fim das sessões.
  • «Session lines style» — estilo dessas linhas.
Mais do autor
O indicador calcula as áreas de parada / reversão de tendência mais prováveis, áreas de movimento de tendência confiantes. O cálculo considera: a taxa de variação de preço; o ângulo de desvio relativo do gráfico; a amplitude média dos movimentos de preços; o preço saindo de sua "zona de conforto"; os valores do indicador ATR. O indicador pode gerar um Alerta quando o preço entrar em uma área de parada / reversão. Definições Desenhe todo o comprimento? - desenhar as áreas até o final do gráf
Buy and sell zones
Evgeniy Zhdan
5 (2)
Indicador para determinar o plano e a tendência. Se o preço estiver abaixo de qualquer um dos dois histogramas e duas linhas (vermelha e azul), esta é uma zona de venda. Ao adquirir esta versão do indicador, versão MT4 para uma conta real e uma demo - como um presente (para receber, escreva-me uma mensagem privada)! Se o preço estiver acima de qualquer um dos dois histogramas e duas linhas (vermelha e azul), esta é uma zona de compra. Versão MT4:   https://www.mql5.com/en/market/product/3793 S
SuperTrend
Evgeniy Zhdan
2.5 (2)
The Supertrend Expert Advisor The Supertrend Expert Advisor with averaging elements. It has been developed during three months until I finally got good results. It is not a scalper. The minimum balance to start trading - 100 $. Is automatically adjusted to the 4 and 5-digit prices. Has an efficient risk management system. The lot and limit on the maximum lot is automatically calculated based on the settings specified in the EA. As a result, you have a complete automated trading system. Download
Stardust
Evgeniy Zhdan
StarDust searches for divergences in the values of several indicators considering them as signs of flat and enters the market if a relatively steady trend is detected. The Expert Advisor trades "basic" symbols with a low spread. The best results are achieved on М15. The EA automatically adjusts to 4 and 5-digit quote flows. Settings Comment_to_orders – comment to a placed order. The field can be left blank if no comment is required. MM – enable money management with automatic setting of a worki
Top Floor
Evgeniy Zhdan
The EA catches the price when it moves against the trend in an effort to open an order in an opposite direction (direction of the main trend). Screenshots illustrate examples of entries and the strategy gist. The EA uses stop losses depending on values of ATR. Settings: Lot_ - if Risk_ = 0, the EA will trade this lot; Risk_ - risk per one trade. Stop loss is taken into account; koeff_ATR - coefficient multiplied by the ATR value to calculate stop loss (the bigger the value, the bigger stop loss
FastBoom
Evgeniy Zhdan
The FastBoom EA finds the most probable points of price pullback/reverse and places an order. It places averaging orders if the price moves further against take profit. Settings of the EA: Lots - initial lot; LotExponent - multiplier for following orders (Martingale). 1 - no multiplier. TakeProfit - take profit in points; Stochastic Settings InpKPeriod - K Period of Stochastic InpDPeriod - D Period of Stochastic InpSlowing - Stochastic Slowing LevHigh - level for sell positions of Stochastic L
The Expert Advisor calculates the double/triple divergence of volumes, and starts trading. It uses a unique formula of lot calculation, which greatly improves stability of trading. Recommended TF - 1h. Currency pair - EURUSD , but the EA can be used on any trading instruments which are not subject to high volatility. Settings mode - trading direction can be set manually; close - order close level (details on the screenshot); Step between orders - step between orders in points; Maximum orders -
OrderOnLine
Evgeniy Zhdan
The Expert Advisor opens orders from the horizontal line, the a trader can set on any level by dragging using the mouse or by changing the line properties. For example, when a horizontal line is above the current price, the EA will open a Buy order once the horizontal line is reached. And vice versa: If the line is below the current price, the EA will open a sell order once the line is crossed. A buy crossover of the line is: opening of the current candlestick below the horizontal line; the curr
SellerATR
Evgeniy Zhdan
5 (1)
The Expert Advisor only sells. Recommended currency pairs : EURUSD; GBPUSD; USDCHF; USDJPY; USDCAD; AUDUSD; EURGBP; EURAUD; EURCHF; EURJPY; GBPCHF; CADJPY; GBPJPY; AUDNZD; AUDCAD; AUDCHF; AUDJPY; CHFJPY; EURNZD; EURCAD; CADCHF; NZDJPY; NZDUSD. Timeframe: H1. Percent% manages closing both loss-making and profitable deals based on the account overall status. Using the EA on 23 symbols mentioned above allows the robot to cope with the drawdown in case of a long trend. While positions on some pairs
Illusion
Evgeniy Zhdan
3 (2)
The Illusion EA uses the probability theory - after a series of consecutive virtual losses - i.e. right during a flat the EA already starts trading in the trend. In addition, the EA considers the ratio of bullish/bearish candles on the higher timeframes to determine the greatest probability of the price movement direction. Only 1 order can be opened at a time. In case of a loss the following order will be placed with an increased lot (the multiplication coefficient is set in the parameters). The
The indicator plots a trend line and determines the levels for opening trades, in case the price goes "too far" away from the trend level. More detailed information is available in the screenshots. Settings Away from the trend line - distance from the trend line to the trades level; Arrow Signal for deals - enable displaying an arrow when the price reaches the trades level; Size of Arrow - size of the arrow; Alert Signal for deals - enable generating alerts when the price reaches the trades lev
Turbina
Evgeniy Zhdan
5 (4)
The axiom of the Forex market is that any trend will be broken. The Expert Advisor determines trend direction (the pink line), and calculates levels for opening opposite orders depending on the settings. The value of Away from the trend line for Deal will be different for each pair and timeframe, depending on the volatility of the trading instrument. Next orders can be opened with an increased lot (a static lot is used by default). See the screenshots to understand the idea of the Expert Advisor
Odysseus
Evgeniy Zhdan
The Expert Advisor determines the moments of strong movements and opens a position in the direction of the most probable price movement. The strategy always uses stop loss and take profit. Several independent orders can be in the market (the maximum number is set in parameters). The goal of the EA's underlying trading system is the quantitative excess of the number of profitable deals over the number of losing ones. Recommended: EURUSD 5m; GBPUSD 5m; USDJPY 5m. The Expert Advisor is able to work
Vise
Evgeniy Zhdan
Vise is a trend indicator. The upper and lower lines follow the price showing the prevailing price direction. Frequent breakthroughs of the upper line indicate a bullish trend, while frequent breakthroughs of the lower line indicate a bearish one. Parameters Points for UpLine - initial number of points for the upper line; Points for DownLine - initial number of points for the lower line. During the breakthrough of the upper level (line), this level shifts upwards by Points for UpLine. If the up
Twinkle
Evgeniy Zhdan
Twinkle is a trend-based scalper using stop loss and take profit invisible to the broker. The EA does not look for trend reversals. The EA catches strong market movements and opens orders in the direction of the trend. Your broker will not see the order closing levels. The EA closes orders independently when reaching the take profit or stop loss levels specified in the settings. Recommended trading symbols: EURUSD M5, GBPUSD M5. ECN accounts with 5 digits quotes are recommended. Expert Advisor
Shine
Evgeniy Zhdan
4.75 (4)
This Expert Advisor implements elements of the Martingale system. Orders are opened at a specified distance from the moving average. The Parabolic SAR indicator and certain technical details are used to ensure the most accurate entries. The EA is highly customizable. It is recommended for simultaneous use on 4 currency pairs: EURUSD M15; GBPUSD M15; USDJPY M15; USDCAD M15. Despite good stability, it is advisable to disable the EA operation during the days rich in news releases. Configurations P
LuckyCase
Evgeniy Zhdan
LuckyCase is an Expert Advisor with martingale elements. The EA strategy is based on a significant "deviation" of the price from SAR inadicator and the Bands levels breakthrough point. The money management system is an essential part of the EA. It starts working after a trade is opened. Trades are closed after accumulating specified points of market orders, by deposit % or after an opposite side of the channel is broken through. The default EA settings are meant for: EURUSD M15; USDJPY M15. The
Elize
Evgeniy Zhdan
The Elize Expert Advisor has been designed to work with the EURCHF currency pair. It considers the peculiarities of this trading instrument, its behavior and dependence on the behavior of other currencies. In particular, when the currencies of the European countries (EURUSD, GBPUSD, EURNOK, EURCHF) move in the same direction, the EA starts its operation and opens a deal in the trend direction of the European currencies. In the event of price rollbacks, the EA uses a unique method for making the
AllTrendLines
Evgeniy Zhdan
4 (1)
Brief Description of the All Trend Lines Indicator The indicator analyzes the wave structure of the market. What it displays on the chart: First. Wave pivots (semaphores) • Red markers – wave highs • Yellow markers – wave lows • Yellow-green markers – additional local extremes Second. Trend lines • Purple/blue lines – trends based on highs (resistance/support) • Beige/green lines – trends based on lows • Lines are built automatically by connecting wave pivots of the same type Third. Main trend
FastTraffic
Evgeniy Zhdan
The Expert Advisor has been specifically developed for trading gold (Spot Gold). The strategy is based on Fibo levels calculated from the previous (first) candle High/Low and the width of the current and lower timeframes channel. If important Fibo levels of different orders are located in a single price channel (within a spread), the EA defines this channel as the target for price movement and starts operation. Martingale and averaging are not used. Each order is independent and is accompanied b
Jazz
Evgeniy Zhdan
The algorithm of this Expert Advisor determines the significant price levels, where the trend often turns into a flat or reverses. Stochastic Oscillator serves as an additional filter of overbought/oversold zones. The EA sets stop loss and take profit after opening an order. The underlying trailing strategy applies a trailing stop. The EA is recommended for simultaneously use on three trading instruments: EURUSD M5, GBPUSD M5, EURCHF M5. Settings: Comment to order - comment to orders. MaxRisk -
Panther
Evgeniy Zhdan
The Expert Advisor looks for technical analysis patterns formed on the higher (hourly) timeframe to start working on the 5-minute chart. Technical analysis patterns used: double top/double bottom, head/shoulders, flag, expanding/narrowing triangles. The Relative Vigor Index technical indicator is used as the filter for opening deals. It is based on the idea that on the bull market the closing price is, as a rule, higher, than the opening price. It is the other way round on the bear market. This
Spook
Evgeniy Zhdan
The Expert Advisor calculates the divergence on the current and higher timeframes. In case the divergences coincide, the EA starts its operation. Deals have strict take profit and stop loss levels. Each deal is managed by trailing stop. The strategy involves the use of a tight stop-loss. Therefore, losing deals and/or series of losing deals are not uncommon. This EA is not suitable for those who have difficulties coping with losing deals. The EA is recommended for simultaneous use on the followi
Grand
Evgeniy Zhdan
The Expert Advisor has been developed specifically for the features of the CHFJPY currency pair. The EA's algorithm determines the direction of the current trend and starts operation. In case of a price reversal within the current trend, the EA adds additional orders. If trend changes, the EA starts to work in the direction contrary to the initial grid of orders. If there were no conditions for closing orders and the trend direction changed again, the EA continues to work with the "first" grid o
Intensive
Evgeniy Zhdan
The Expert Advisor algorithm determines on daily charts those candlestick patterns, which set the intraday trading direction. The trading EA determines how long the price is moving in overbought/oversold zones and starts working in the direction of the expected trend movement. Each position is accompanied with a tight stop loss and take profit. Only one active position can be open in the market. The EA was developed and tested using 99% quality quotes. The Expert Advisor has a built-in news filt
Slender
Evgeniy Zhdan
The strategy of this Expert Advisor is based on a hedging system, which implies placing opposite orders. The EA algorithm determines trend beginning and opens a position in the trend direction. In case of a wrong entry, the EA tries to neutralize the drawdown through opposite (hedging) orders at a preset interval (Coefficient of counter orders). Orders are closed when one of the two values ​​is reached - profit in percent or profit in points. The EA does not use lot increase. The EA wast tested
Dreamer
Evgeniy Zhdan
Советник работает по принципу хеджирования с периодическими "перекосами" в сторону трендовых направлений. Направления тренда советник определяет на основании стандартного индикатора Parabolic Stop and Reverse system (SAR). Уникальная стратегия установки балансирующих позиций позволяет избегать больших просадок даже при самых не благоприятных рыночных условиях. Параметры по умолчанию рекомендуется использовать на торговом инструменте: GBPJPY 15m. Разработка и оптимизация параметров производились
Snoot
Evgeniy Zhdan
5 (1)
This Expert Advisor works using a grid in the direction of a trend movement with the step between opened positions defined in the settings. The positions are closed by the total take profit. The Parabolic SAR standard indicator is used to filter order opening, which comes in the MetaTrader 4 package. The EA has been developed and tested using 99,9% quality of quotes. Operation of the EA in real time can be viewed in the signals . The best trading results have been achieved on CHFJPY M15. Settin
Solipsism
Evgeniy Zhdan
The Expert Advisor builds channels based on the data obtained using ATR and MA indicators according to the equations: Upper channel border = MA + ATR * (FIBO); Lower channel border = MA - ATR * (FIBO), where FIBO has the following values: Style of Trade - Aggressive = 1.61852; Style of Trade - Average = 3.26704; Style of Trade - Calm = 4.85556. Trades are opened inside the channel with the intervals defined in the settings. Long and short positions are opened independently. Positions are closed
The trading statistics indicator notifies the trader of the aggregate income of the trading account for different time intervals. The indicator has wide display settings on the graph. There is a choice of one of the two display languages on the chart- English and Russian. Settings Indicator language (ENG, RUS) - Select the language to display on the chart; To control the magic (-1: any magic) - Entering the Magic for control (-1: any Magic); Angle of indicator tie - Selecting the angle of the c
Filtro:
Sem comentários
Responder ao comentário