Session Flow Map MT5

SessionFlowMap — Profil multi-sessions de volume et de delta avec niveaux POC

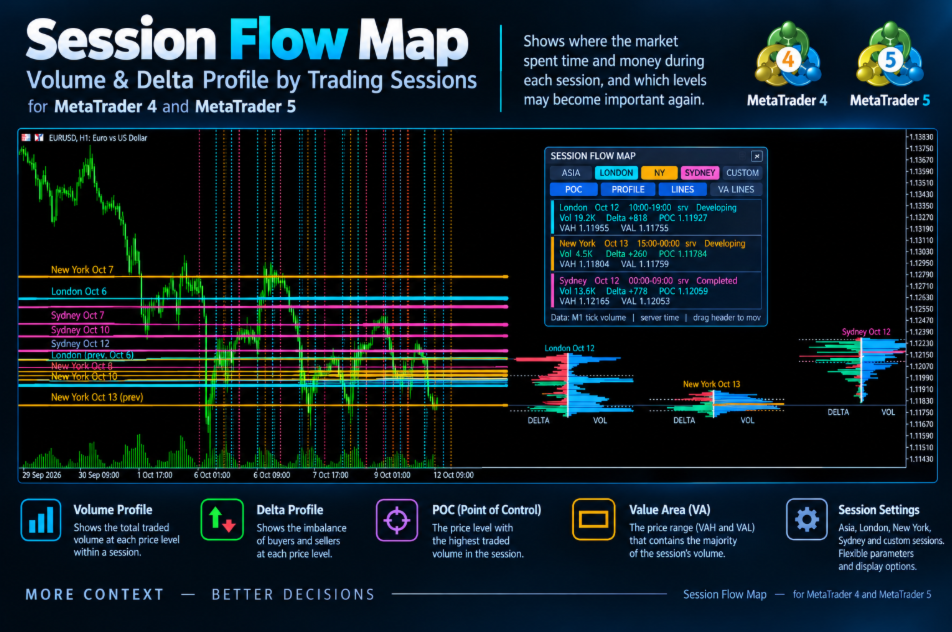
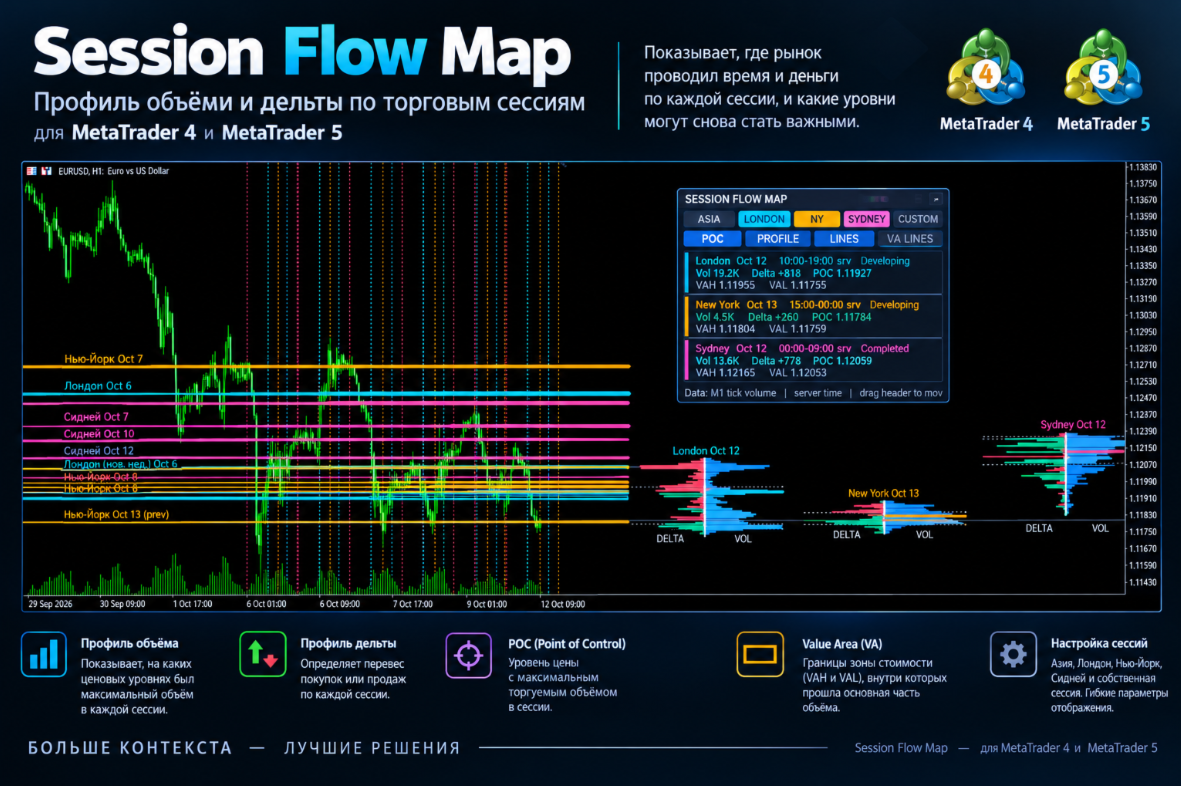
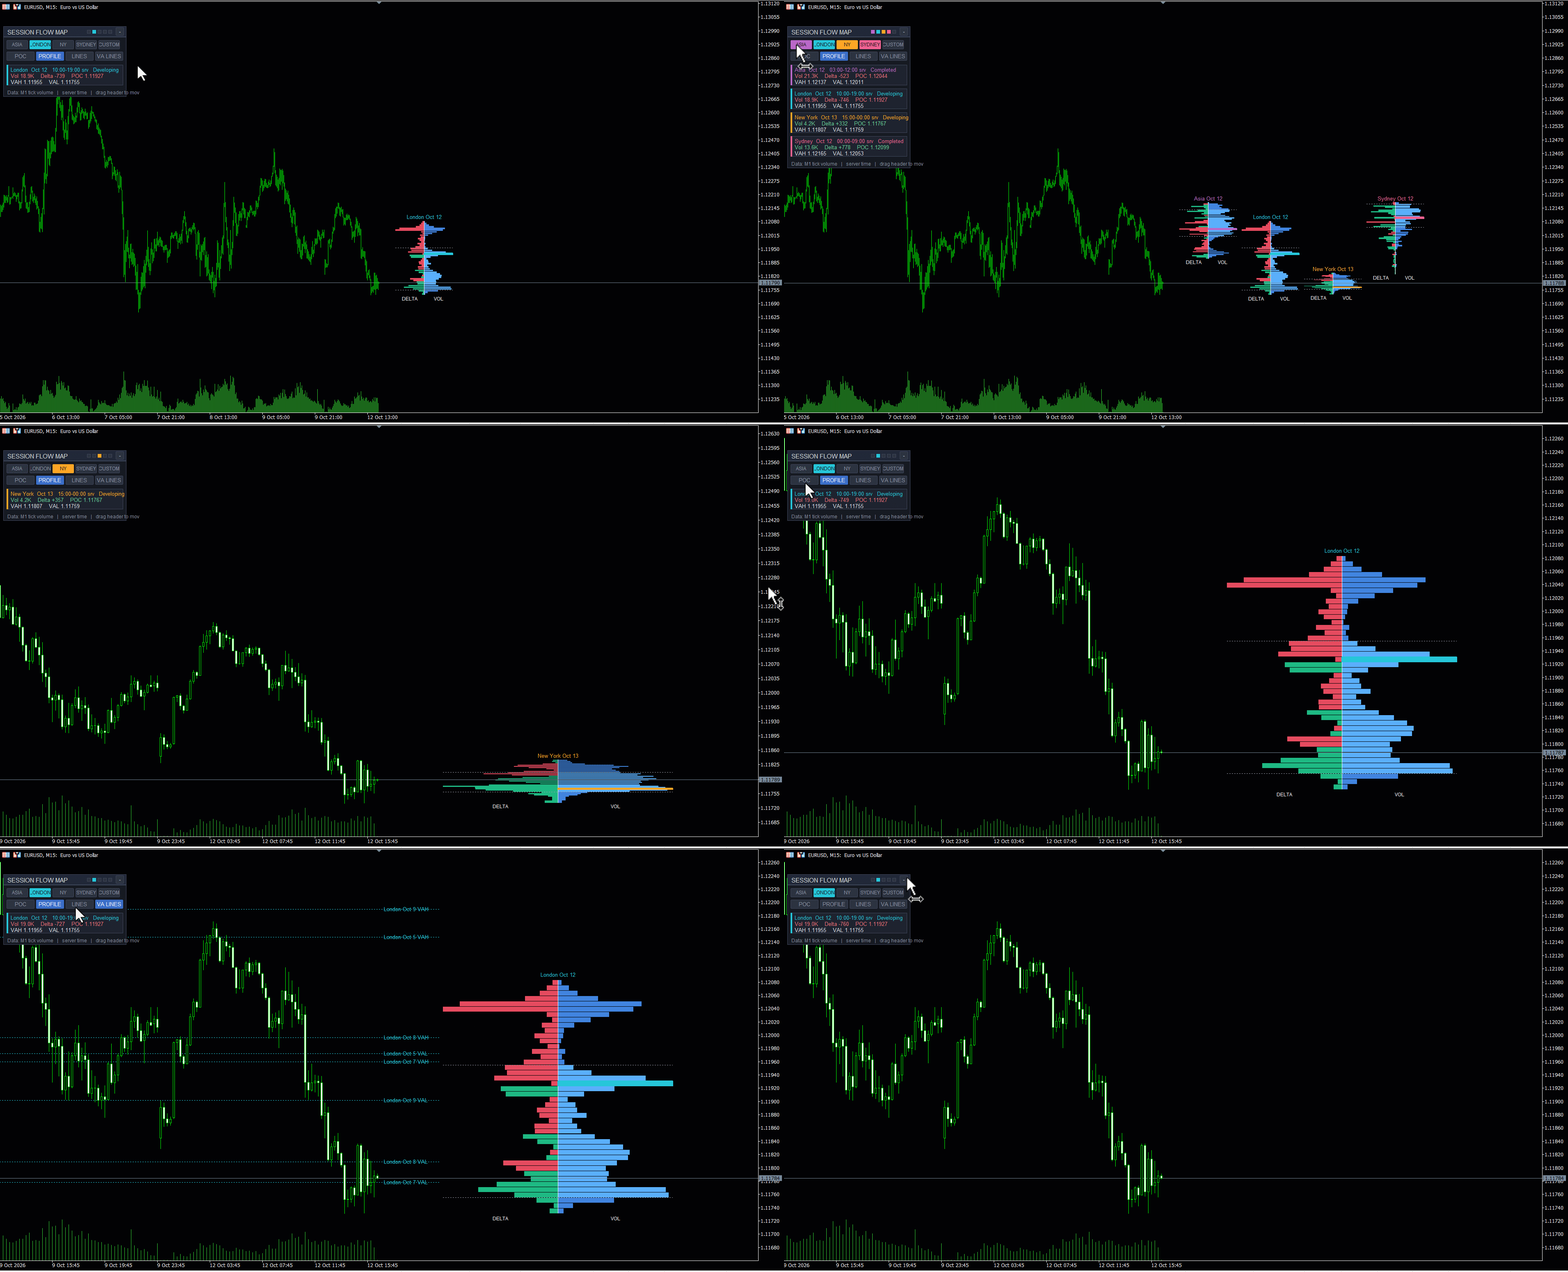
SessionFlowMap construit un profil de volume et un profil de delta (déséquilibre entre achats et ventes) pour les sessions de la journée forex : Asie, Londres, New York, ainsi que, en option, Sydney et une session personnalisée. Pour chaque session, il trouve le POC (Point of Control : le prix où le volume échangé est le plus élevé) et la Value Area (VAH et VAL : la plage qui concentre l'essentiel du volume), puis prolonge ces niveaux vers la droite sous forme de lignes horizontales. Vous voyez d'un coup d'œil où le marché a passé du temps et de l'argent pendant chaque session et quels niveaux peuvent redevenir importants.

MT4-version: https://www.mql5.com/en/market/product/200941

Fonctionnement

  • Chaque session est extraite de l'historique M1 selon ses propres horaires. Les horaires de l'Asie, de Londres, de New York et de Sydney sont définis en GMT et convertis automatiquement en heure du serveur de votre courtier. La session personnalisée utilise directement l'heure du serveur.
  • La fourchette de prix de la session est divisée en lignes de prix (vous fixez le nombre cible) et le volume est réparti entre ces lignes. Le forex n'a pas de volume centralisé ; on utilise donc le volume de ticks.
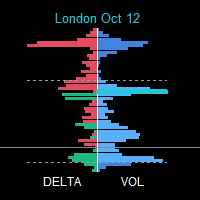
  • Le profil de volume est le volume total de chaque ligne. Le profil de delta est le volume d'achat moins le volume de vente de chaque ligne (vert : les acheteurs dominent ; rouge : les vendeurs dominent).
  • En mode « M1 bars », la répartition entre achats et ventes est estimée à partir de la position de la clôture de chaque bougie dans son amplitude. En mode « Real ticks », elle provient de la direction de chaque tick (ou des indicateurs BUY/SELL lorsque le courtier les fournit).
  • Le POC est la ligne au volume le plus élevé. La Value Area s'étend à partir du POC jusqu'à couvrir le pourcentage de volume choisi (70 % par défaut), ce qui donne le VAH et le VAL.
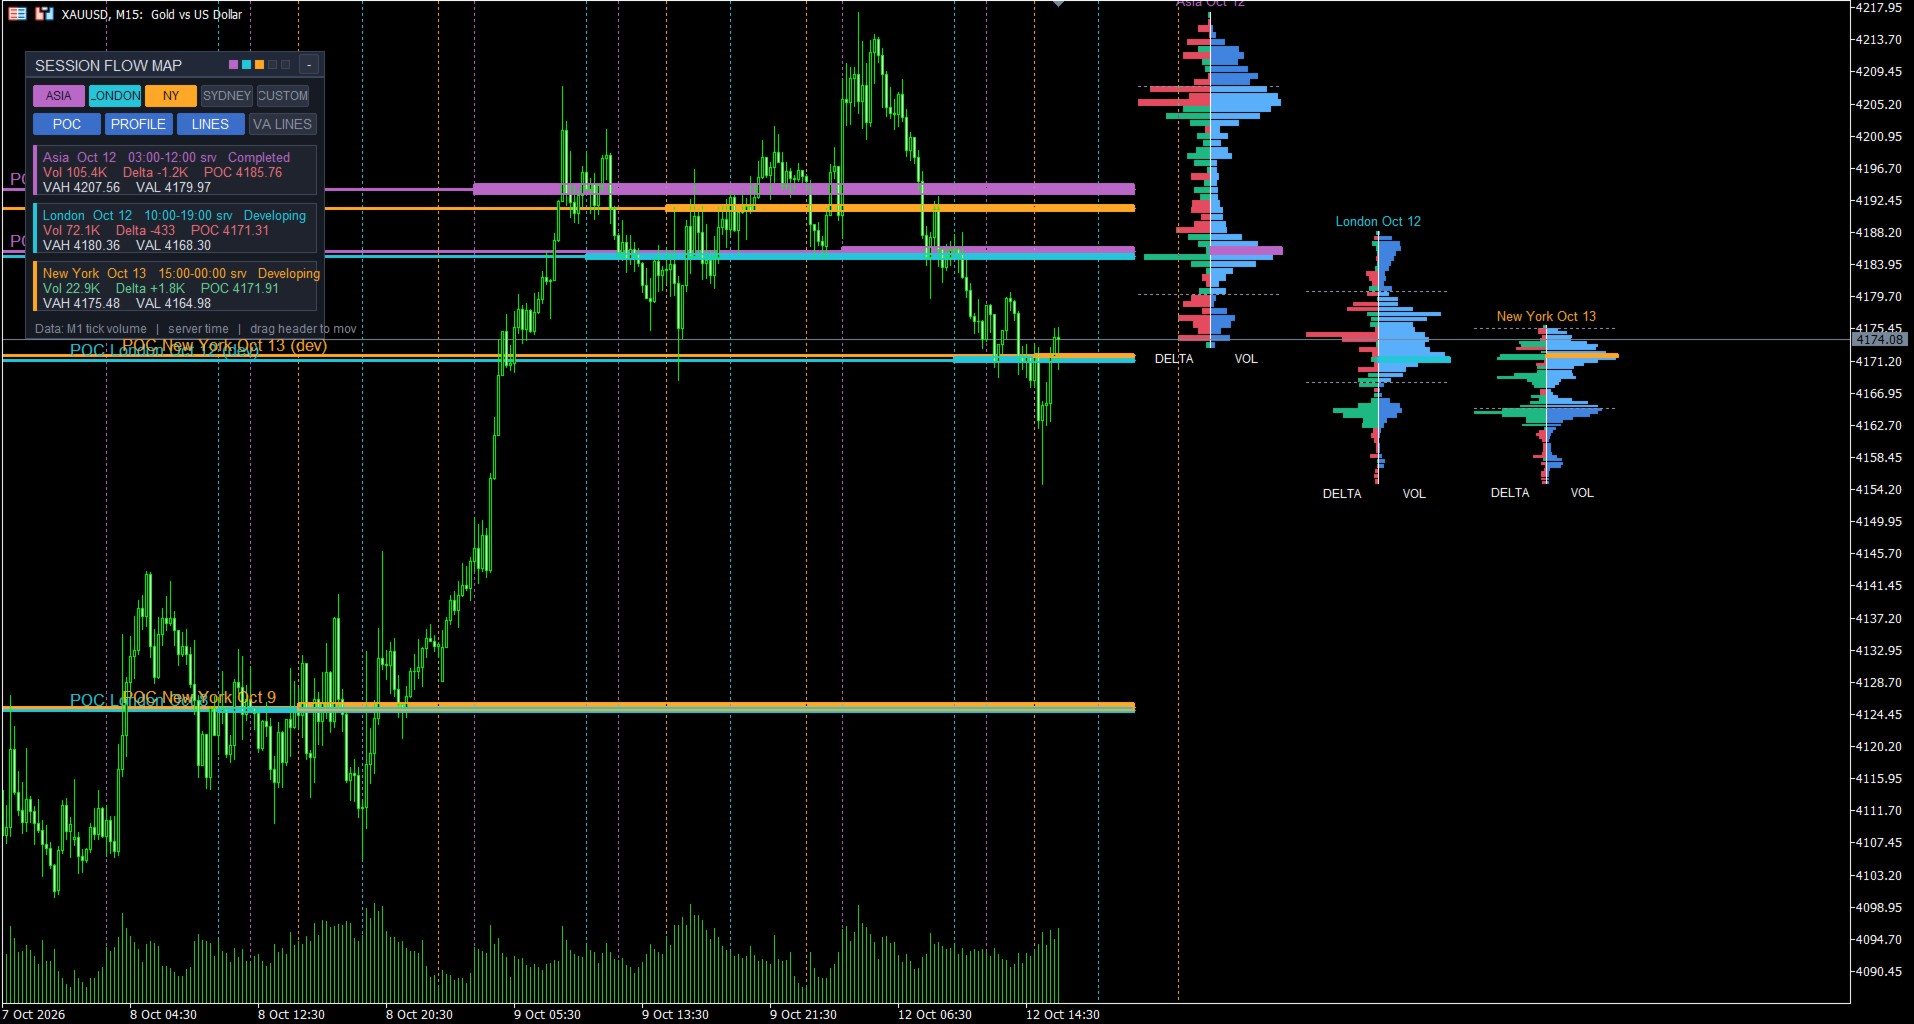
  • Le dernier profil de chaque session est dessiné sous forme de cluster à droite de la dernière bougie (volume et delta dos à dos autour d'un séparateur) ou à l'intérieur de la session elle-même sur le graphique. Le POC est dessiné comme une zone et/ou une ligne ; une longue ligne traverse tout le graphique, avec une étiquette au-dessus, à gauche. Les POC des sessions précédentes restent sur le graphique comme niveaux de référence.
  • Des lignes verticales marquent le début et la fin de chaque session. Chaque session a sa propre couleur.

Comment un trader peut l'utiliser

  • Le POC de la session précédente comme support ou résistance, et comme « aimant » pour le prix : observez la réaction du prix lorsqu'il revient sur le niveau.
  • Mode POC « nu » (naked POC) : les niveaux que le prix n'a pas encore revisités restent prolongés ; après le premier contact, la ligne s'arrête.
  • Le VAH et le VAL comme bornes de la « juste valeur » : acceptation à l'intérieur de la zone, rejet à l'extérieur, sorties de la Value Area.
  • Le profil de delta montre à quels prix les acheteurs ou les vendeurs ont dominé ; comparez le delta au niveau du POC avec les lignes voisines.
  • Contexte des sessions : la fourchette asiatique, la position des POC de Londres et de New York par rapport à elle, le chevauchement Londres/New York.
  • Confluence : lorsque les POC de sessions et de jours différents sont proches, ils forment une zone plus significative.
  • Les alertes vous préviennent lorsque le prix revient sur les niveaux prolongés.
  • Fonctionne sur tout symbole et toute unité de temps (les profils sont construits à partir du M1) ; M5–H1 est le choix le plus courant.

Panneau et boutons

  • Faites glisser le panneau par son en-tête et réduisez-le avec le bouton « - ». Les points de couleur de l'en-tête indiquent les sessions activées.
  • Les boutons ASIA, LONDON, NY, SYDNEY et CUSTOM activent et désactivent les sessions directement sur le graphique.
  • Les boutons POC, PROFILE, LINES et VA LINES activent ou désactivent des calques : niveaux POC, profils, lignes verticales de session et VAH/VAL prolongés.
  • Chaque session a une carte : nom, date, horaires en heure du serveur, état (Completed ou Developing), volume, delta, POC, VAH et VAL. La dernière ligne indique la source de données.
  • La position du panneau, son état réduit et l'état des boutons sont mémorisés séparément pour chaque graphique.

Prérequis

L'historique M1 de la période nécessaire doit être chargé. Activez le décalage du graphique (Chart shift) et laissez de l'espace libre à droite pour les clusters de profils.

Paramètres

1. Sessions

  • « Show Asian session » — active la session asiatique (le bouton ASIA du panneau fait la même chose).
  • « Asian session hours (GMT, HH:MM-HH:MM) » — début et fin de la session asiatique en GMT, 00:00-09:00 par défaut. Les sessions qui passent minuit sont prises en charge.
  • « Show London session » / « London session hours (GMT, HH:MM-HH:MM) » — la session de Londres, 07:00-16:00 par défaut.
  • « Show New York session » / « New York session hours (GMT, HH:MM-HH:MM) » — la session de New York, 12:00-21:00 par défaut.
  • « Show Sydney session » / « Sydney session hours (GMT, HH:MM-HH:MM) » — la session de Sydney, désactivée par défaut, horaires 21:00-06:00.
  • « Show custom session (broker day by default) » / « Custom session hours (SERVER time, HH:MM-HH:MM) » — votre propre session en heure du serveur ; la valeur par défaut 00:00-24:00 correspond à la journée complète du courtier.
  • « Auto-detect broker GMT offset » — le décalage du serveur par rapport au GMT est détecté automatiquement, y compris les changements d'heure d'été du courtier.
  • « Manual broker GMT offset, hours (if auto is off) » — décalage fixe en heures lorsque la détection automatique est désactivée.
  • « Skip sessions starting on Saturday/Sunday » — ignore les sessions qui commencent le week-end. Astuce : les horaires de Londres et de New York sont définis en GMT ; lorsque ces places passent à l'heure d'été, décalez les horaires d'une heure.

2. Data

  • « Data source » — « M1 bars (tick volume, fast) » : calcul rapide à partir des bougies d'une minute ; « Real ticks (precise, slower) » : calcul précis à partir des ticks, mais plus lent.
  • « Refresh interval (seconds) » — fréquence à laquelle la session en cours est recalculée et redessinée. Une nouvelle bougie déclenche immédiatement un recalcul.

3. Volume and delta profiles

  • « Show volume profile » — affiche le profil de volume.
  • « Show delta profile » — affiche le profil de delta.
  • « Volume profile side (delta is opposite) » — de quel côté du séparateur le volume est dessiné ; le delta est placé du côté opposé.
  • « Target price rows per session (10-70) » — niveau de détail du profil. S'il y a trop d'objets, les lignes sont fusionnées uniquement à l'affichage ; le POC et la Value Area restent exacts.
  • « Profile placement » — « Shared divider at right » : les derniers profils de toutes les sessions sont placés côte à côte à droite de la dernière bougie ; « Session edges » : le profil est dessiné dans l'intervalle de temps de la session.
  • « Previous sessions: edge » — à quel bord de la session (gauche ou droit) les profils précédents sont dessinés.
  • « Profiles to display » — « Latest session of each type only » : seulement la session la plus récente de chaque type ; « Latest + previous sessions » : plus les sessions antérieures.
  • « Previous sessions with full profiles (1-10) » — combien de sessions précédentes de chaque type sont affichées avec un profil complet.
  • « Profile width (% of session, edges mode) » — largeur maximale de chaque moitié du profil en pourcentage de la durée de la session.
  • « Shared divider: width per side (bars) » — largeur de chaque moitié du profil en bougies en mode séparateur partagé.
  • « Shared divider: gap after last bar (bars) » — distance entre la dernière bougie et le cluster ; augmentez-la si les profils gênent le prix.
  • « Show value area high / low lines » — lignes pointillées VAH et VAL sur chaque profil.
  • « Value area (%) » — part du volume contenue dans la Value Area, 70 par défaut.
  • « Show volume / delta numbers in rows » — nombres de volume et de delta dans les lignes.
  • « Drawing budget (max histogram boxes) » — limite du nombre d'objets d'histogramme pour garder le terminal fluide.

4. POC

  • « Show POC » — affiche le POC.
  • « POC display » — « Zone » : une zone remplie sur la ligne du POC ; « Line » : une ligne.
  • « Zone width basis » — « POC row » : la zone correspond à la ligne du POC ; « Custom points » : une zone de largeur définie autour du centre.
  • « Custom zone total width (points) » — largeur totale de la zone en points pour le mode « Custom points ».
  • « Extend developing session POC right » — prolonge vers la droite le POC d'une session encore en formation.
  • « Zone transparency (0-100) » — transparence du remplissage de la zone.
  • « Zone border width » — épaisseur de la bordure de la zone.
  • « Show POC center line inside zone » — une ligne en tirets au centre de la zone.
  • « POC line across the whole chart (extended POCs) » — la ligne du POC va du début de l'historique jusqu'au cluster, avec une étiquette au-dessus, à gauche.
  • « POC line width » — épaisseur de la ligne du POC.

5. Previous sessions levels

  • « Extend previous sessions' POC right » — prolonge vers la droite les POC des sessions terminées.
  • « Previous sessions to extend per session type (1-30) » — combien des dernières sessions terminées de chaque type sont prolongées.
  • « Allow incomplete sessions in history » — permet de prolonger les niveaux des sessions aux données incomplètes (marqués d'un astérisque *).
  • « Show dated level labels » — étiquettes de niveau avec le nom de la session et la date.
  • « Naked POC mode: stop extension at first revisit » — la ligne s'arrête au moment où le prix revient pour la première fois sur le POC.
  • « Also extend previous VAH / VAL right » — prolonge aussi le VAH et le VAL des sessions précédentes.
  • « Extension length to the right (bars) » — longueur du prolongement vers la droite en bougies lorsque le cluster ne limite pas les lignes.
  • « Stop extended lines before the profile cluster (shared divider mode) » — les lignes s'arrêtent avant le cluster de profils afin qu'il reste lisible.

6. Colors

  • « Asian session color », « London session color », « New York session color », « Sydney session color », « Custom session color » — couleurs des sessions : POC, lignes, étiquettes et cartes du panneau.
  • « Volume » — couleur de l'histogramme de volume.
  • « Volume inside value area » — couleur du volume à l'intérieur de la Value Area.
  • « Positive delta » / « Negative delta » — couleurs du delta positif et négatif.
  • « Value area lines » — couleur des lignes VAH et VAL.
  • « Profile transparency (0-100) » — transparence des histogrammes.
  • « Show profile titles » — titres au-dessus des profils (nom de la session et date) et en dessous (VOL et DELTA).

7. Alerts

  • « Alert when price touches extended POC / VAH / VAL » — active les alertes lorsque le prix touche des niveaux prolongés (VAH et VAL si leur prolongement est activé).
  • « Popup alert » — fenêtre contextuelle.
  • « Push notification » — notification push vers l'application mobile.
  • « Sound alert » — signal sonore.
  • « Touch tolerance (points) » — tolérance de contact en points.

8. Panel

  • « Show interactive panel (drag header, buttons) » — affiche le panneau avec ses boutons.
  • « Panel start X (drag header to move) » / « Panel start Y (drag header to move) » — position initiale du panneau ; vous pouvez ensuite le déplacer à la souris.

9. Session lines

  • « Show vertical lines at session start / end » — lignes verticales au début et à la fin des sessions.
  • « Session lines style » — style de ces lignes.
Produits recommandés
La Master Edition est un outil d'analyse de qualité professionnelle conçu pour visualiser la structure du marché à travers le prisme du volume et du flux monétaire. Contrairement aux indicateurs de volume standard, cet outil affiche un Profil de Volume Quotidien directement sur votre graphique, vous permettant de voir exactement où la découverte des prix a eu lieu et où est positionné "l'argent intelligent". Cette Master Edition est conçue pour la clarté et la rapidité, dotée d'un système unique
Value Chart Candlesticks
Flavio Javier Jarabeck
4.57 (14)
The idea of a Value Chart indicator was presented in the very good book I read back in 2020 , " Dynamic Trading Indicators: Winning with Value Charts and Price Action Profile ", from the authors Mark Helweg and David Stendahl. The idea is simple and the result is pure genius: Present candlestick Price analysis in a detrended way! HOW TO READ THIS INDICATOR Look for Overbought and Oversold levels. Of course, you will need to test the settings a lot to find the "correct" one for your approach. It
FREE
Simple QM Pattern MT5
Suvashish Halder
3.75 (4)
Simple QM Pattern   is a powerful and intuitive trading indicator designed to simplify the identification of the Quasimodo (QM) trading pattern. The QM pattern is widely recognized among traders for effectively signaling potential   reversals   by highlighting key market structures and price action formations. This indicator helps traders easily visualize the QM pattern directly on their charts, making it straightforward even for those who are new to pattern trading. Simple QM Pattern includes d
FREE
Volume Profile FREE — Multi-Session Heatmap (POC · VAH · VAL) See where trading activity actually occurs—not just where price moves. This indicator builds a clear, color-coded Volume Profile Heatmap directly on your chart and highlights the market's most important price levels: the Point of Control (POC) and the Value Area (VAH/VAL) , where price is most likely to react.
FREE
Fixed Volume Profile
Carlos Pascual Perez Maturano
This indicator, titled "Fixed Volume Profile.mq5", is a custom tool for MetaTrader 5 (MQL5) designed to calculate and display a Volume Profile over a user-defined fixed time range. The Volume Profile shows the distribution of trading volume at different price levels during a specific period, helping to identify areas of high activity (such as Points of Control or POCs) and volume-based support/resistance areas. Main Functionality: Interactive Range: The indicator creates two vertical lines on
FREE
The   Visual Volatility Clustering   indicator clusters the market based on volatility. The indicator does not redraw and gives accurate data, does not use closing prices. Uses the opening prices or the highs or lows of the previous completed bar. Therefore, all information will be clear and unambiguous. The essence of the indicator is to divide the price market into certain areas according to a similar type of volatility. This can be done in any way. In this example, the indicator is configure
Haven Volume Profile
Maksim Tarutin
4.64 (14)
Haven Volume Profile est un indicateur multifonctionnel pour l'analyse du profil de volume qui aide à identifier les niveaux de prix clés basés sur la répartition du volume de négociation. Il a été conçu pour les traders professionnels qui souhaitent mieux comprendre le marché et identifier les points d'entrée et de sortie importants pour leurs transactions. Autres produits ->  ICI Fonctionnalités principales : Calcul du Point of Control (POC) - le niveau d'activité commerciale maximal, ce qui a
FREE
Blahtech VWAP MT5
Blahtech Limited
5 (1)
Blahtech VWAP - Volume Weighted Average Price (VWAP) is the ratio of price to total volume. It provides an average price over a specified time interval.  Links [  Install  |  Update  |  Documentation   ] Feature Highlights Configurable VWAP Line Sessions, intervals, anchored or continuous Previous day settlement line Standard Deviation bands Alerts at bar close or real time Automatic Broker or Tick volumes Significantly reduced CPU usage Input Parameters Expert Advisor Mode  - Reserved for iCu
FREE
Ospe POC Volume Profile
Nur Azureen Binti Ab Aziz
A volume-at-price heatmap with POC, value area, estimated buy/sell pressure, confirmed signals and alerts. POC Volume Profile Heatmap is a MetaTrader 5 indicator that organizes historical volume across price levels. It identifies the Point of Control, displays the selected value area, and estimates buying and selling pressure at the POC. The indicator is intended for traders who use volume-at-price structure to study acceptance, rejection and interaction around high-activity price levels. It c
FREE
The Horizontal Ray Tool is a lightweight, professional charting utility designed to streamline support and resistance mapping on MetaTrader 5. It brings rapid, one-click horizontal level placement directly to your live chart, eliminating the workspace clutter associated with infinite horizontal lines or manually drawn trendlines. Key Features: Interactive On-Screen Button: Spawns a clean, responsive "DRAW RAY" button docked directly on your chart canvas. A single click drops an independent hor
FREE
Smart SMC FVG
Ekkasawat Pitichalermroch
SMC + Volume Profile + FVG: Indicator Guide Overview SMC + Volume Profile + FVG is an all-in-one indicator for MetaTrader 5. It combines three popular price-action tools on a single chart: Smart Money Concepts (SMC): market structure (swings, BOS, CHoCH) and Order Blocks Fair Value Gaps (FVG): price imbalances left behind by fast moves Volume Profile: where the most trading happened, shown as POC, Value Area High and Value Area Low Everything is drawn automatically. You can turn each part on or
Enhanced Volume Profile: The Ultimate Order Flow & Liquidity Analysis Tool Overview Enhanced Volume Profile is an indicator for MetaTrader 5 that displays the traded volume at specific price levels over a defined period. It separates the total volume into buy and sell components, presenting them as a side-by-side histogram on the chart. This allows users to observe the volume distribution and the proportion of buy and sell volumes at each price level. Graphics Rendering The indicator uses the
FREE
Session Profiles
Basharat Umar Khan
Short Description Draws rolling Time-Price-Opportunity (TPO) and footprint volume profiles for the Asia, London, and New York sessions with POC/VAH/VAL levels, delta volume bias, order flow overlays, liquidity heatmaps, developing rolling lines, Naked POC (NPOC) tracking, Initial Balance breakouts, multi-session confluence zones, and automatic broker GMT-offset detection. Full Description Plots separate market-profile and volume-profile style histograms for the three major trading sessions (Asi
FREE
Blahtech Supply Demand MT5
Blahtech Limited
4.57 (14)
Was: $299  Now: $99  Supply Demand uses previous price action to identify potential imbalances between buyers and sellers. The key is to identify the better odds zones, not just the untouched ones. Blahtech Supply Demand indicator delivers functionality previously unavailable on any trading platform. This 4-in-1 indicator not only highlights the higher probability zones using a multi-criteria strength engine, but also combines it with multi-timeframe trend analysis, previously confirmed swings a
Volume-to-Price Movement Oscillator (VP Oscillator) for MT5 The VP Oscillator highlights the balance (or imbalance) between trading volume and price movement, helping traders spot hidden accumulation, distribution, or weakening trends. How It Works: Calculates each bar’s price range (High–Low) and tick volume. Normalizes both values over a set period (default: 14). Plots the absolute difference between them ×100 — showing how closely price action aligns with trading activity. Interpretation: Hig
FREE
BoxProfile MT5
Evgeny Shevtsov
4.6 (10)
The indicator displays volume profiles based on the nesting principle. Profiles periods are pre-set so that each subsequent profile has a length twice as long as the length of the previous profile. In addition to profiles, the indicator displays volume clusters sorted by color, depending on the volume they contain. Indicator operation features The indicator works on typical timeframes from M5 to MN, but for calculations uses historical data from smaller timeframes: M1 - for timeframes from M5
FREE
(Special New Year promotion - free price!) The indicator displays the actual 'Scale in points per bar' (identical to the manual setting in the Terminal, see screenshot) in the upper right corner of the chart. The displayed value changes INSTANTLY whenever the chart scale is changed! (This is very convenient when planning screenshots). In Settings: Change language (Russian/English), font size of the displayed text, text label offset coefficient from the graph corner, equally in X and Y directi
FREE
Advanced Volume Profile
Henry Armando Baltazar
Advanced Volume Profile Liquidity Analysis via Custom Area Selection The Advanced Manual Volume Profile is a precision tool for MetaTrader 5 designed to deconstruct market structure through price-level volume analysis. Unlike static profiles, this indicator exclusively processes the price and time range defined by the user via a rectangle object, offering a surgical view of the market auction. Elite Technical Specifications Dynamic Algorithm: Real-time calculation (400ms refresh rate) based on t
FREE
VP hidden
Emr Aljnaby
4.33 (12)
The indicator works to convert normal volume into levels and determine financial liquidity control points. It is very similar in function to Fixed Volume Profile. But it is considered more accurate and easier to use than the one found on Trading View because it calculates the full trading volumes in each candle and in all the brokers present in MetaTrade, unlike what is found in Trading View, as it only measures the broker’s displayed prices. To follow us on social media platforms: telegram
FREE
Mirror Chart MT5
Andrej Hermann
5 (1)
The Mirror Chart MT5 is a overlay indicator specifically designed to project a second financial instrument directly onto the main chart window. This tool is invaluable for traders who rely on correlation analysis, as it visualizes the price movements of two different instruments in real time. Unlike traditional overlays, this indicator utilizes intelligent, dynamic centering and scaling logic. It continuously analyzes the visible price range in the current window for both symbols and calculates
FREE
The indicator highlights the points that a professional trader sees in ordinary indicators. VisualVol visually displays different volatility indicators on a single scale and a common align. Highlights the excess of volume indicators in color. At the same time, Tick and Real Volume, Actual range, ATR, candle size and return (open-close difference) can be displayed. Thanks to VisualVol, you will see the market periods and the right time for different trading operations. This version is intended f
FREE
ApeX Trade Manager MT5  →     ApeX Journal MT5  →     ApeX Indicator SMC MT5  →     ApeX Indicator ICT Concepts MT5  →     ApeX Indicator Volume Profile MT5  →    ApeX Indicator ICT Macros MT5  → One profile per session tells you about the session. One profile per swing tells you about the trade you are in. ApeX Volume Profile builds a profile for every pivot the market makes. 1. The profile Point of Control — The price where the most volume traded in that leg, optionally extended right or bo
Aggression Volume
Flavio Javier Jarabeck
4.29 (17)
Aggression Volume Indicator is the kind of indicator that is rarely found in the MQL5 community because it is not based on the standard Volume data provided by the Metatrader 5 platform. It requires the scrutiny of all traffic Ticks requested on the platform... That said, Aggression Volume indicator requests all Tick Data from your Broker and processes it to build a very special version of a Volume Indicator, where Buyers and Sellers aggressions are plotted in a form of Histogram. Additionally,
FREE
Daily & Composite Volume Profile   This is a professional-grade market profile tool designed for MetaTrader 5. It utilizes a   Dual-Profile System   to visualize supply, demand, and liquidity concentrations. Key Features Left Side: Daily Session Profiles Automatically identifies the start and end of every trading day. Generates a unique Volume Profile for each individual day. Allows you to see how value migrated from yesterday to today (e.g., Is today's volume higher or lower than yesterday?).
BoxInside MT5
Evgeny Shevtsov
5 (4)
This indicator calculates the volume profile and places labels that correspond to the VAH, VAL and POC levels, for each candle individually. Indicator operation features The indicator works on the timeframes from M3 to MN, but it uses the history data of smaller periods: M1 - for periods from M3 to H1, M5 - for periods from H2 to H12, M30 - for the D1 period, H4 - for the W1 period, D1 - for the MN period. The color and location of the VAL, VAH and POC labels on the current candle are considere
FREE
Here   our more valuable tools SMC Trend Trading   ,  Easy SMC Trading  ,  Institutional SMC Architect Volume Analysis Tools  ,  Volume flow Profile  ,  Market volume profile  , FVG with Volume  , Liquidity Heatmap Profile  ,  Volume Spread Analysis A professional spike pattern indicator built for synthetic traders who scalp and swing Crash 500/300/1000 with precision.  This indicator: Detects powerful 3-candle spike formations (Spike → Pullback → Spike) Automatically draws a clean box a
FREE
Volume Profile Multiple — Profils de Volume Multiples avec Buffers pour le Trading Algorithmique Fatigué de redessiner le Volume Profile bloc par bloc, en devant tout recalculer à chaque changement de timeframe ? Volume Profile Multiple trace automatiquement plusieurs profils de volume consécutifs sur le graphique, révélant où l'intérêt institutionnel s'est réellement concentré dans chaque section du marché — et pas seulement sur la dernière plage visible. Ce que l'indicateur fait pour vous L'in
Here   our more valuable tools SMC Trend Trading   ,  Easy SMC Trading  ,  Institutional SMC Architect Volume Analysis Tools  ,  Volume flow Profile  ,  Market volume profile  , FVG with Volume  , Liquidity Heatmap Profile  ,  Volume Spread Analysis The    Liquidity Heatmap   is a sophisticated institutional trading tool designed to reveal where over-leveraged traders are trapped. By calculating estimated liquidation levels based on volume spikes and leverage, this indicator draws a dynamic "h
TradeVision Pro
Ian Nganga Comba
TradeVisonPro Forex Analyzer Pro Tableau de bord d’analyse et de suivi des comptes de trading MT5 TradeVisonPro Forex Analyzer Pro est une solution d’analyse du trading et de suivi des comptes conçue pour les utilisateurs de MetaTrader 5. Le produit organise les données de trading MT5 dans un tableau de bord web structuré, permettant aux traders de consulter les informations du compte, de surveiller les positions ouvertes, d’analyser l’historique des transactions, de suivre les stratégies, de te
FREE
Deviation Trend Profile Overview Deviation Trend Profile is a MetaTrader 5 chart indicator that combines three visual layers in a single chart window: a moving average with momentum-based coloring, deviation bands calculated from volatility, and a horizontal distribution profile drawn to the right of the current price. The indicator is an analytical tool. It does not open, modify or close trades, and it is not a complete trading system. It is designed to help the user observe trend direction, mo
FREE
Les acheteurs de ce produit ont également acheté
Trend Sniper X
Sarvarbek Abduvoxobov
4.9 (41)
Trend Sniper X est un indicateur de suivi de tendance multi-unités de temps pour MetaTrader 5 qui aide les traders à identifier la direction de la tendance et les points d'inversion potentiels avec clarté et précision. pour MT4: https://www.mql5.com/en/market/product/193245 Informations sur le prix : Le prix actuel est un prix promotionnel et est susceptible de changer lors des prochaines mises à jour et nouvelles fonctionnalités. Offre bonus : Pour obtenir GRATUITEMENT l'Auto-Trade Assistant E
Smart Trend Trading System — MetaTrader 5 Après votre achat, envoyez-moi un message sur MQL5 pour recevoir GRATUITEMENT Smart Universal Expert Advisor, ainsi que le cours en ligne, le manuel PDF et l’accès au groupe privé. STTS réunit la direction de la tendance, les signaux d’entrée et de sortie, les zones de retournement et les niveaux de prix importants directement sur votre graphique. Suivez le système manuellement ou connectez un EA compatible distinct pour une exécution automatique selon l
La légende est de retour : Entry Points Pro 10. La relance de l'indicateur légendaire qui s'est maintenu 3 ans dans le Top-3 du MQL5 Market. Des centaines d'avis enthousiastes (589 sur les deux versions), des milliers de traders l'utilisent chaque jour, 31 000+ téléchargements de la démo   MT4+MT5 . J'ai lu chacun de vos avis publiés en cinq ans — et au lieu de promettre, j'ai intégré les réponses directement dans la version 10. Par un auteur présent sur les marchés depuis 1999, qui tient à l'ho
Gann Made Easy   est un système de trading Forex professionnel et facile à utiliser qui est basé sur les meilleurs principes de trading en utilisant la théorie de mr. WD Gann. L'indicateur fournit des signaux d'ACHAT et de VENTE précis, y compris les niveaux Stop Loss et Take Profit. Vous pouvez échanger même en déplacement en utilisant les notifications PUSH. VEUILLEZ ME CONTACTER APRÈS L'ACHAT POUR RECEVOIR GRATUITEMENT DES INSTRUCTIONS DE TRADING ET D'EXCELLENTS INDICATEURS SUPPLÉMENTAIRES! V
Neuro Poseidon MT5
Daria Rezueva
4.75 (52)
Neuro Poseidon is a new indicator by Daria Rezueva. It combines precise trading signals with adaptive TP/SL levels - creating best possible trades as a result! Message me and get  Neuro Poseidon Assistant  as a gift to automize your trading process! What makes it stand out? 1. Proven profitability on all assets and timeframes 2. Only confirmed BUY and SELL signals present on the chart 3. Adaptive TP & SL levels generated by the software for each trade 4. Easy to understand - suitable for al
Auto Optimized SpeedAngle est un système de vectorisation du momentum de niveau institutionnel qui élimine l'ajustement de courbe ( curve-fitting ) grâce à une optimisation continue par avancement ( Walk-Forward Optimization , WFO). Plutôt que de s'appuyer sur des entrées statiques qui se dégradent lorsque les régimes de marché changent, l'indicateur recalibre dynamiquement ses paramètres en utilisant une validation hors échantillon ( Out-of-Sample , OOS), garantissant ainsi que les signaux affi
Bonjour à tous les traders ! De nombreux investisseurs individuels utilisent des scripts web lents. Une approche systématique est essentielle pour un trading rentable. L'indicateur Astro AI n'est pas un simple affichage sur un graphique. Il s'agit d'un réseau neuronal sophistiqué composé de deux agents fonctionnant directement dans le terminal. Détails techniques du système : 1. Agent 1 : Analyste (Réseau neuronal graphique – GNN) Le marché n'est pas constitué de barres de prix individuelle
Adaptive Price Action Engine Achetez un indicateur, obtenez l'EA gratuitement Analyse auto-optimisée des tendances et des figures de chandeliers Multi-Timeframe Les marchés évoluent constamment, et tous les modèles de Price Action n’ont pas la même valeur dans toutes les conditions de marché. Adaptive Price Action Engine a été conçu pour s’adapter aux changements du marché en combinant structure de tendance, analyse Multi-Timeframe, figures de chandeliers et optimisation statistique au sein d’un
M1 Sniper MT5
Oleg Rodin
5 (7)
M1 SNIPER   est un système d'indicateurs de trading facile à utiliser. Il s'agit d'un indicateur à flèche conçu pour l'unité de temps M1. Cet indicateur peut être utilisé seul pour le scalping sur l'unité de temps M1 ou intégré à votre système de trading existant. Bien que conçu spécifiquement pour le trading sur l'unité de temps M1, ce système peut également être utilisé avec d'autres unités de temps. Initialement, j'avais conçu cette méthode pour le trading du XAUUSD et du BTCUSD. Cependant, j
Divergence Bomber
Ihor Otkydach
4.89 (94)
Chaque acheteur de cet indicateur reçoit également gratuitement : L’outil exclusif « Bomber Utility », qui accompagne automatiquement chaque opération de trading, fixe les niveaux de Stop Loss et de Take Profit, et clôture les positions selon les règles de la stratégie Des fichiers de configuration (set files) pour adapter l’indicateur à différents actifs Des set files pour configurer le Bomber Utility selon différents modes : « Risque Minimum », « Risque Équilibré » et « Stratégie d’Attente »
Unix Scalper
Issam Kassas
4 (4)
Unix Scalper — MetaTrader 5 Après votre achat, envoyez-moi un message sur MQL5 pour recevoir GRATUITEMENT Smart Universal Expert Advisor, ainsi que le cours en ligne, le manuel PDF et l’accès au groupe privé. Repérez la configuration. Consultez le plan. Choisissez comment intervenir. UNIX Scalper réunit l’analyse du marché, les décisions BUY/SELL/WAIT et les niveaux Entry, Stop Loss, TP1 et TP2 dans un panneau organisé. VISUALISEZ LE SIGNAL ET LE PLAN • Des décisions claires : BUY, SELL ou WAIT.
Scalper Vault   est un système de scalpage professionnel qui vous fournit tout ce dont vous avez besoin pour un scalpage réussi. Cet indicateur est un système de trading complet qui peut être utilisé par les traders de forex et d'options binaires. Le délai recommandé est M5. Le système vous fournit des signaux fléchés précis dans le sens de la tendance. Il vous fournit également des signaux supérieurs et inférieurs et des niveaux de marché Gann. Les indicateurs fournissent tous les types d'alert
RelicusRoad Pro MT5
Relicus LLC
4.96 (25)
Arrêtez de deviner vos trades. Sachez quand entrer, où sortir et dans quel sens va le marché, le tout sur un seul graphique. RelicusRoad Pro réunit près de vingt outils dans un seul indicateur, et vous activez ceux qui correspondent à votre façon de trader. Entrées claires. Sorties claires. Un plan sur chaque graphique. Ça vous dit quelque chose ? Vous achetez, et le prix se retourne contre vous une minute plus tard. Vous clôturez trop tôt, puis vous regardez le mouvement continuer sans vous. Ci
Présentation       Quantum Breakout PRO   , l'indicateur révolutionnaire MQL5 qui transforme la façon dont vous négociez les zones d'évasion ! Développé par une équipe de traders expérimentés avec une expérience commerciale de plus de 13 ans,       Évasion quantique PRO       est conçu pour propulser votre parcours commercial vers de nouveaux sommets grâce à sa stratégie de zone de discussion innovante et dynamique. Quantum Breakout Indicator vous donnera des flèches de signalisation sur les z
Quant Direction MT5
Georgios Kalomoiropoulos
Quant Direction est un outil d'analyse de marché 3D. Il fournit une analyse de marché parfaitement objective, basée sur un algorithme, en calculant des écarts précis en pourcentage sur différents paramètres. Développé à l'aide d'outils de modélisation avancés basés sur l'IA et soumis à des tests rigoureux, cet algorithme analyse le marché avec une précision inégalée. Vous pouvez analyser n'importe quelle paire de devises ou instrument financier sur la plateforme. Que vous pratiquiez le trading à
Volatility Master for MetaTrader is a real-time dashboard tool that scans up to  50 symbols  to identify high-volatility , trending markets instantly. With bullish/bearish signals, customizable alerts, and a user-friendly interface, it helps you avoid range-bound conditions and focus on high-probability trades. Clarity leads to confidence. Trade confidently and protect your capital effectively with this powerful dashboard. We don't offer free or bonus indicators in exchange of reviews from you.
Quantum TrendPulse
Bogdan Ion Puscasu
5 (26)
Présentation de   Quantum TrendPulse   , l'outil de trading ultime qui combine la puissance de   SuperTrend   ,   RSI   et   Stochastic   dans un seul indicateur complet pour maximiser votre potentiel de trading. Conçu pour les traders qui recherchent précision et efficacité, cet indicateur vous aide à identifier les tendances du marché, les changements de dynamique et les points d'entrée et de sortie optimaux en toute confiance. Caractéristiques principales : Intégration SuperTrend :   suivez f
Reversal Master for MT5 Reversal Master for MT5 is a non‑repainting reversal indicator for MetaTrader 5. It helps you detect potential market reversal points and shows the maximum favourable price movement after each historical signal, so you can better understand how price behaved after similar situations in the past. The MT5 version keeps the familiar reversal‑signal logic of the original Reversal Master for MT4, but adds improved visualisation, historical statistics and a points summary panel
Atomic Analyst MT5
Issam Kassas
4.48 (61)
Atomic Analyst — MetaTrader 5 Après votre achat, envoyez-moi un message sur MQL5 pour recevoir GRATUITEMENT Smart Universal Expert Advisor, ainsi que le cours en ligne, le manuel PDF et l’accès au groupe privé. Atomic Analyst réunit l’action des prix, la direction de la tendance, les signaux d’entrée et de sortie, le Stop Loss et plusieurs niveaux de Take Profit directement sur votre graphique. REPÉREZ LE SIGNAL. COMPRENEZ LA CONFIGURATION. Atomic Analyst présente son analyse sous forme d’inform
Power Candles MT5
Daniel Stein
4.58 (12)
Power Candles V3 - Indicateur de force à optimisation automatique Power Candles V3 transforme la force des devises et des instruments en un plan de trading exploitable sur chaque graphique auquel il est associé. Au lieu de se contenter de colorer les bougies, il effectue une optimisation automatique en temps réel en arrière-plan et vous fournit les meilleurs niveaux de Stop Loss, Take Profit et seuils de signal pour le symbole que vous avez sous les yeux. Un simple clic suffit pour l'adopter en
Mahra Pro Indicator MT5
Mahra Said Mohammed Al Kaabi
Mahra Pro Indicator MT5 Overview Mahra Pro is a MetaTrader 5 chart indicator designed to support structured analysis of XAUUSD (Gold). It combines trend, momentum, volatility and price-structure conditions to identify potential buy and sell setups and display them directly on the chart. The indicator does not open, modify or close trades. All trading decisions and order execution remain under the user's control. Main features • Buy and sell signal arrows on the chart. • Fast and slow EMA lines w
M1 Quantum MT5
Hamed Dehgani
4.2 (10)
Signaux de Trading en Direct avec M1 Quantum : Signal   (L’opération est exécutée automatiquement par le Quantum Trade Assistant , inclus gratuitement avec ce produit.) Dernières nouvelles : La version 1.64 a été publiée. Toutes les transactions disposent désormais d’un Stop Loss placé derrière les zones de support/résistance correspondantes. La fonction Smart Close a également été améliorée afin d’augmenter les performances de l’EA dans cette version. Depuis le 9 août, le signal en direct fonc
Quantum Direction est un indicateur professionnel de suivi de tendance conçu pour identifier la direction du marché, détecter les changements de tendance à leurs débuts et fournir des signaux d'entrée et de sortie filtrés. Cet indicateur inclut gratuitement Quantum Trade Assistant , un outil professionnel de gestion des transactions disponible sur le MQL5 Market. Il peut se connecter directement à Quantum Direction et ouvrir automatiquement des positions lorsqu’un signal valide apparaît, ou ferm
Advanced Supply Demand MT5
Bernhard Schweigert
4.53 (15)
La meilleure solution pour tout commerçant débutant ou expert ! Cet indicateur est un outil de trading unique, de haute qualité et abordable car nous avons intégré un certain nombre de fonctionnalités propriétaires et une nouvelle formule. Avec cette mise à jour, vous pourrez afficher des zones à double horaire. Vous pourrez non seulement afficher un TF plus élevé, mais afficher les deux, le graphique TF, PLUS le TF supérieur : AFFICHAGE DES ZONES NICHÉES. Tous les traders Supply Demand vont ado
Smart Market Structure Toolkit
Garry James Goodchild
5 (1)
Smart Market Structure Pro by G-Labs — ICT and Smart Money Concepts toolkit with built-in multi-symbol scanner for MetaTrader 5. Break of structure, change of character, order blocks, fair value gaps, liquidity sweeps, premium and discount zones, ICT sessions, confluence scoring, AI trade ideas, and a traffic-light scanner across up to 30 pairs and four timeframes from one chart. Map SMC and ICT on the active chart while the built-in scanner monitors your full watchlist. Each cell shows BUY, S
CRT Pro is a complete Candle Range Theory toolkit for MetaTrader 5. It finds the CRT model on up to three timeframes and adds the tools needed to read it: higher-timeframe candles, structure shifts, fair value gaps, liquidity sweeps, a bias table and SSMT divergence. Every module can be switched on or off. 1. CRT Model A CRT model is built from two candles of the chosen CRT timeframe. C1 is the range candle. C2 is the sweep candle: it takes the high or the low of C1 and closes back inside the
Currency Strength Wizard   est un indicateur très puissant qui vous offre une solution tout-en-un pour un trading réussi. L'indicateur calcule la puissance de telle ou telle paire de devises en utilisant les données de toutes les devises sur plusieurs périodes. Ces données sont représentées sous la forme d'un indice de devise facile à utiliser et de lignes électriques de devise que vous pouvez utiliser pour voir la puissance de telle ou telle devise. Tout ce dont vous avez besoin est d'attacher
By the time you've clicked through forty charts looking for a first red day at a monthly high, the setup you wanted has already closed. Market Maker Reversal Scanner reads your Market Watch, finds a fixed set of reversal and exhaustion patterns, scores each one on a transparent 10-point scale, and puts the results in a single sortable panel on one chart. You stop hunting. You start choosing. New in v12.1: a DAYS / SESSIONS switch. Sessions mode runs the same scanner on closed H4 candles and tags
ICT Pro
Robby Suhendrawan
Ultimate AIO ICT Concept Indicator pour MT5 : Maîtrisez les Smart Money Concepts Automatiquement Êtes-vous fatigué de passer des heures à analyser manuellement vos graphiques chaque jour ? L'indicateur AIO ICT Concept est votre solution tout-en-un complète pour maîtriser les Smart Money Concepts. Conçu pour éliminer les conjectures et la fatigue émotionnelle de l'analyse technique manuelle, cet outil algorithmique puissant cartographie automatiquement les éléments critiques de l'action des prix
The Oracle Pro
Ottaviano De Cicco
5 (1)
The Oracle Pro: Synthetic Multi-Timeframe Bias Engine for MT5 ️ Summer Launch Offer — Get The Oracle Pro for USD 199 (early buyers). Price rises with traction; final price USD 399. The Oracle Pro is a premium multi-timeframe bias engine for MetaTrader 5, built for demanding and professional traders. It answers one question with discipline: what is the directional bias on each timeframe right now, how strong is it, and how much do the timeframes agree? Everything is computed on closed bars only
Plus de l'auteur
L'indicateur calcule les zones d'arrêt / d'inversion de tendance les plus probables, les zones de mouvement de tendance confiantes. Le calcul considère : le taux de variation des prix ; l'angle de déviation relative de la carte ; l'amplitude moyenne des mouvements de prix ; le prix sortant de sa « zone de confort » ; les valeurs de l'indicateur ATR. L'indicateur peut générer une alerte lorsque le prix entre dans une zone d'arrêt/d'inversion. Paramètres Dessiner toute la longueur ? - tracer l
Buy and sell zones
Evgeniy Zhdan
5 (2)
Indicator for determining flat and trend. If the price is below any of the two histograms and two lines (red and blue), this is a sell zone. When purchasing this version of the indicator, MT5 version for one real and one demo account - as a gift (to receive, write me a private message)! If the price is above any of the two histograms and two lines (red and blue), this is a buy zone. MT5 version:  https://www.mql5.com/en/market/product/70409 If the price is between two lines or in the zone of
SuperTrend
Evgeniy Zhdan
2.5 (2)
The Supertrend Expert Advisor The Supertrend Expert Advisor with averaging elements. It has been developed during three months until I finally got good results. It is not a scalper. The minimum balance to start trading - 100 $. Is automatically adjusted to the 4 and 5-digit prices. Has an efficient risk management system. The lot and limit on the maximum lot is automatically calculated based on the settings specified in the EA. As a result, you have a complete automated trading system. Download
Stardust
Evgeniy Zhdan
StarDust searches for divergences in the values of several indicators considering them as signs of flat and enters the market if a relatively steady trend is detected. The Expert Advisor trades "basic" symbols with a low spread. The best results are achieved on М15. The EA automatically adjusts to 4 and 5-digit quote flows. Settings Comment_to_orders – comment to a placed order. The field can be left blank if no comment is required. MM – enable money management with automatic setting of a worki
Top Floor
Evgeniy Zhdan
The EA catches the price when it moves against the trend in an effort to open an order in an opposite direction (direction of the main trend). Screenshots illustrate examples of entries and the strategy gist. The EA uses stop losses depending on values of ATR. Settings: Lot_ - if Risk_ = 0, the EA will trade this lot; Risk_ - risk per one trade. Stop loss is taken into account; koeff_ATR - coefficient multiplied by the ATR value to calculate stop loss (the bigger the value, the bigger stop loss
FastBoom
Evgeniy Zhdan
The FastBoom EA finds the most probable points of price pullback/reverse and places an order. It places averaging orders if the price moves further against take profit. Settings of the EA: Lots - initial lot; LotExponent - multiplier for following orders (Martingale). 1 - no multiplier. TakeProfit - take profit in points; Stochastic Settings InpKPeriod - K Period of Stochastic InpDPeriod - D Period of Stochastic InpSlowing - Stochastic Slowing LevHigh - level for sell positions of Stochastic L
The Expert Advisor calculates the double/triple divergence of volumes, and starts trading. It uses a unique formula of lot calculation, which greatly improves stability of trading. Recommended TF - 1h. Currency pair - EURUSD , but the EA can be used on any trading instruments which are not subject to high volatility. Settings mode - trading direction can be set manually; close - order close level (details on the screenshot); Step between orders - step between orders in points; Maximum orders -
OrderOnLine
Evgeniy Zhdan
The Expert Advisor opens orders from the horizontal line, the a trader can set on any level by dragging using the mouse or by changing the line properties. For example, when a horizontal line is above the current price, the EA will open a Buy order once the horizontal line is reached. And vice versa: If the line is below the current price, the EA will open a sell order once the line is crossed. A buy crossover of the line is: opening of the current candlestick below the horizontal line; the curr
SellerATR
Evgeniy Zhdan
5 (1)
The Expert Advisor only sells. Recommended currency pairs : EURUSD; GBPUSD; USDCHF; USDJPY; USDCAD; AUDUSD; EURGBP; EURAUD; EURCHF; EURJPY; GBPCHF; CADJPY; GBPJPY; AUDNZD; AUDCAD; AUDCHF; AUDJPY; CHFJPY; EURNZD; EURCAD; CADCHF; NZDJPY; NZDUSD. Timeframe: H1. Percent% manages closing both loss-making and profitable deals based on the account overall status. Using the EA on 23 symbols mentioned above allows the robot to cope with the drawdown in case of a long trend. While positions on some pairs
Illusion
Evgeniy Zhdan
3 (2)
The Illusion EA uses the probability theory - after a series of consecutive virtual losses - i.e. right during a flat the EA already starts trading in the trend. In addition, the EA considers the ratio of bullish/bearish candles on the higher timeframes to determine the greatest probability of the price movement direction. Only 1 order can be opened at a time. In case of a loss the following order will be placed with an increased lot (the multiplication coefficient is set in the parameters). The
The indicator plots a trend line and determines the levels for opening trades, in case the price goes "too far" away from the trend level. More detailed information is available in the screenshots. Settings Away from the trend line - distance from the trend line to the trades level; Arrow Signal for deals - enable displaying an arrow when the price reaches the trades level; Size of Arrow - size of the arrow; Alert Signal for deals - enable generating alerts when the price reaches the trades lev
Turbina
Evgeniy Zhdan
5 (4)
The axiom of the Forex market is that any trend will be broken. The Expert Advisor determines trend direction (the pink line), and calculates levels for opening opposite orders depending on the settings. The value of Away from the trend line for Deal will be different for each pair and timeframe, depending on the volatility of the trading instrument. Next orders can be opened with an increased lot (a static lot is used by default). See the screenshots to understand the idea of the Expert Advisor
Odysseus
Evgeniy Zhdan
The Expert Advisor determines the moments of strong movements and opens a position in the direction of the most probable price movement. The strategy always uses stop loss and take profit. Several independent orders can be in the market (the maximum number is set in parameters). The goal of the EA's underlying trading system is the quantitative excess of the number of profitable deals over the number of losing ones. Recommended: EURUSD 5m; GBPUSD 5m; USDJPY 5m. The Expert Advisor is able to work
Vise
Evgeniy Zhdan
Vise is a trend indicator. The upper and lower lines follow the price showing the prevailing price direction. Frequent breakthroughs of the upper line indicate a bullish trend, while frequent breakthroughs of the lower line indicate a bearish one. Parameters Points for UpLine - initial number of points for the upper line; Points for DownLine - initial number of points for the lower line. During the breakthrough of the upper level (line), this level shifts upwards by Points for UpLine. If the up
Twinkle
Evgeniy Zhdan
Twinkle is a trend-based scalper using stop loss and take profit invisible to the broker. The EA does not look for trend reversals. The EA catches strong market movements and opens orders in the direction of the trend. Your broker will not see the order closing levels. The EA closes orders independently when reaching the take profit or stop loss levels specified in the settings. Recommended trading symbols: EURUSD M5, GBPUSD M5. ECN accounts with 5 digits quotes are recommended. Expert Advisor
Shine
Evgeniy Zhdan
4.75 (4)
This Expert Advisor implements elements of the Martingale system. Orders are opened at a specified distance from the moving average. The Parabolic SAR indicator and certain technical details are used to ensure the most accurate entries. The EA is highly customizable. It is recommended for simultaneous use on 4 currency pairs: EURUSD M15; GBPUSD M15; USDJPY M15; USDCAD M15. Despite good stability, it is advisable to disable the EA operation during the days rich in news releases. Configurations P
LuckyCase
Evgeniy Zhdan
LuckyCase is an Expert Advisor with martingale elements. The EA strategy is based on a significant "deviation" of the price from SAR inadicator and the Bands levels breakthrough point. The money management system is an essential part of the EA. It starts working after a trade is opened. Trades are closed after accumulating specified points of market orders, by deposit % or after an opposite side of the channel is broken through. The default EA settings are meant for: EURUSD M15; USDJPY M15. The
Elize
Evgeniy Zhdan
The Elize Expert Advisor has been designed to work with the EURCHF currency pair. It considers the peculiarities of this trading instrument, its behavior and dependence on the behavior of other currencies. In particular, when the currencies of the European countries (EURUSD, GBPUSD, EURNOK, EURCHF) move in the same direction, the EA starts its operation and opens a deal in the trend direction of the European currencies. In the event of price rollbacks, the EA uses a unique method for making the
AllTrendLines
Evgeniy Zhdan
4 (1)
Brief Description of the All Trend Lines Indicator The indicator analyzes the wave structure of the market. What it displays on the chart: First. Wave pivots (semaphores) • Red markers – wave highs • Yellow markers – wave lows • Yellow-green markers – additional local extremes Second. Trend lines • Purple/blue lines – trends based on highs (resistance/support) • Beige/green lines – trends based on lows • Lines are built automatically by connecting wave pivots of the same type Third. Main trend
FastTraffic
Evgeniy Zhdan
The Expert Advisor has been specifically developed for trading gold (Spot Gold). The strategy is based on Fibo levels calculated from the previous (first) candle High/Low and the width of the current and lower timeframes channel. If important Fibo levels of different orders are located in a single price channel (within a spread), the EA defines this channel as the target for price movement and starts operation. Martingale and averaging are not used. Each order is independent and is accompanied b
Jazz
Evgeniy Zhdan
The algorithm of this Expert Advisor determines the significant price levels, where the trend often turns into a flat or reverses. Stochastic Oscillator serves as an additional filter of overbought/oversold zones. The EA sets stop loss and take profit after opening an order. The underlying trailing strategy applies a trailing stop. The EA is recommended for simultaneously use on three trading instruments: EURUSD M5, GBPUSD M5, EURCHF M5. Settings: Comment to order - comment to orders. MaxRisk -
Panther
Evgeniy Zhdan
The Expert Advisor looks for technical analysis patterns formed on the higher (hourly) timeframe to start working on the 5-minute chart. Technical analysis patterns used: double top/double bottom, head/shoulders, flag, expanding/narrowing triangles. The Relative Vigor Index technical indicator is used as the filter for opening deals. It is based on the idea that on the bull market the closing price is, as a rule, higher, than the opening price. It is the other way round on the bear market. This
Spook
Evgeniy Zhdan
The Expert Advisor calculates the divergence on the current and higher timeframes. In case the divergences coincide, the EA starts its operation. Deals have strict take profit and stop loss levels. Each deal is managed by trailing stop. The strategy involves the use of a tight stop-loss. Therefore, losing deals and/or series of losing deals are not uncommon. This EA is not suitable for those who have difficulties coping with losing deals. The EA is recommended for simultaneous use on the followi
Grand
Evgeniy Zhdan
The Expert Advisor has been developed specifically for the features of the CHFJPY currency pair. The EA's algorithm determines the direction of the current trend and starts operation. In case of a price reversal within the current trend, the EA adds additional orders. If trend changes, the EA starts to work in the direction contrary to the initial grid of orders. If there were no conditions for closing orders and the trend direction changed again, the EA continues to work with the "first" grid o
Intensive
Evgeniy Zhdan
The Expert Advisor algorithm determines on daily charts those candlestick patterns, which set the intraday trading direction. The trading EA determines how long the price is moving in overbought/oversold zones and starts working in the direction of the expected trend movement. Each position is accompanied with a tight stop loss and take profit. Only one active position can be open in the market. The EA was developed and tested using 99% quality quotes. The Expert Advisor has a built-in news filt
Slender
Evgeniy Zhdan
The strategy of this Expert Advisor is based on a hedging system, which implies placing opposite orders. The EA algorithm determines trend beginning and opens a position in the trend direction. In case of a wrong entry, the EA tries to neutralize the drawdown through opposite (hedging) orders at a preset interval (Coefficient of counter orders). Orders are closed when one of the two values ​​is reached - profit in percent or profit in points. The EA does not use lot increase. The EA wast tested
Dreamer
Evgeniy Zhdan
Советник работает по принципу хеджирования с периодическими "перекосами" в сторону трендовых направлений. Направления тренда советник определяет на основании стандартного индикатора Parabolic Stop and Reverse system (SAR). Уникальная стратегия установки балансирующих позиций позволяет избегать больших просадок даже при самых не благоприятных рыночных условиях. Параметры по умолчанию рекомендуется использовать на торговом инструменте: GBPJPY 15m. Разработка и оптимизация параметров производились
Snoot
Evgeniy Zhdan
5 (1)
This Expert Advisor works using a grid in the direction of a trend movement with the step between opened positions defined in the settings. The positions are closed by the total take profit. The Parabolic SAR standard indicator is used to filter order opening, which comes in the MetaTrader 4 package. The EA has been developed and tested using 99,9% quality of quotes. Operation of the EA in real time can be viewed in the signals . The best trading results have been achieved on CHFJPY M15. Settin
Solipsism
Evgeniy Zhdan
The Expert Advisor builds channels based on the data obtained using ATR and MA indicators according to the equations: Upper channel border = MA + ATR * (FIBO); Lower channel border = MA - ATR * (FIBO), where FIBO has the following values: Style of Trade - Aggressive = 1.61852; Style of Trade - Average = 3.26704; Style of Trade - Calm = 4.85556. Trades are opened inside the channel with the intervals defined in the settings. Long and short positions are opened independently. Positions are closed
The trading statistics indicator notifies the trader of the aggregate income of the trading account for different time intervals. The indicator has wide display settings on the graph. There is a choice of one of the two display languages on the chart- English and Russian. Settings Indicator language (ENG, RUS) - Select the language to display on the chart; To control the magic (-1: any magic) - Entering the Magic for control (-1: any Magic); Angle of indicator tie - Selecting the angle of the c
Filtrer:
Aucun avis
Répondre à l'avis