Realized Volatility Cone
- Göstergeler
- Sürüm: 1.0
- Etkinleştirmeler: 5

# Realized Volatility Cone - Historical volatility percentiles
*Category: Volatility | Difficulty: intermediate | Window: separate window below the chart | Markets: Universal (Forex, indices, commodities, crypto, stocks) | Suggested timeframes: M30, H1, H4, D1*
## Short description
> Draws realized volatility together with the percentiles of its own historical distribution. It tells whether the current level is high or low for that specific instrument.
### Overview
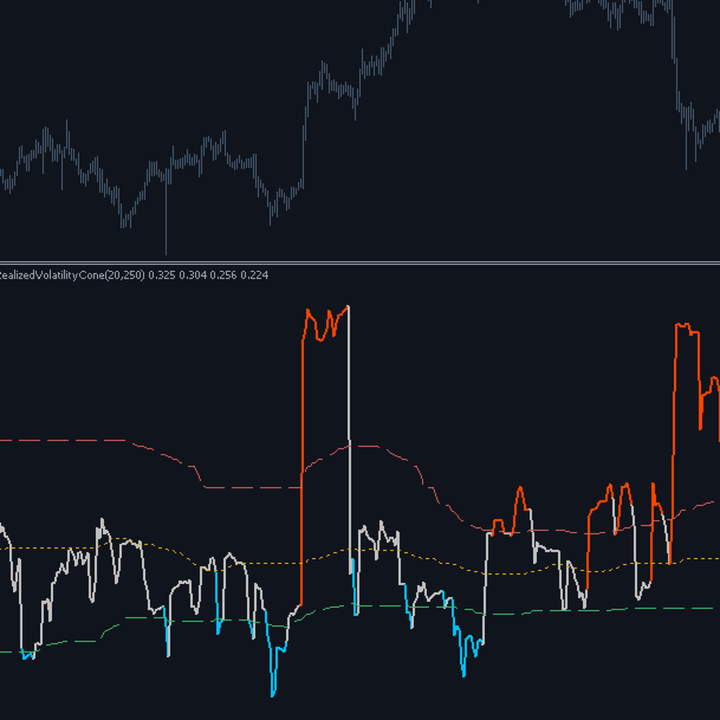
Knowing that realized volatility reads 0.42 per cent per bar is meaningless until you know whether that is a lot or a little for that instrument. The volatility cone solves this in the most direct way possible: alongside the current value it draws the percentiles of its own historical distribution, computed over the last few hundred bars. When the current line breaks the upper percentile we are in a regime that occurred in only twenty per cent of past cases; when it falls below the lower one we are in historical compression, the condition that in practice precedes expansions. The median provides the normality reference and the distance between the two outer bands tells how variable that market volatility is.
### How the calculation works
1. For each bar the logarithmic return versus the previous close is computed, with a check for invalid prices.
2. Realized volatility is the standard deviation of those returns over the InpRvPeriod window, expressed as a percentage.
3. The last InpHistory observations of that same quantity are copied into a working array and sorted.
4. The requested percentiles are read directly by position in the sorted array, without interpolation.
5. The working array is sized once at initialisation, not on every bar.
6. The current line is coloured according to its position relative to the two outer bands.
### How to use it
- Use the line position relative to the bands as a regime classification, not its absolute value.
- Compression below the lower percentile is the context in which to prepare for a breakout, not to expect movement.
- Above the upper percentile it pays to cut position size: the same stop in points represents a far greater risk.
- Outer bands close together indicate an instrument with stable volatility, suited to systems with fixed parameters.
- Comparing the position within the cone across instruments helps pick where volatility offers the best conditions.
### Who it is for and on which timeframes
It suits traders sizing positions by volatility and those running breakout strategies, which need to recognise compressions. It works from M30 to D1; on lower timeframes the historical window would cover only a few days and the percentiles would be unrepresentative. It requires deep history: with default values at least two hundred and seventy bars are needed before the first useful value. No statistical background is required, just the notion of a percentile.
### Practical example of reading a signal
On EURUSD H4 realized volatility slips below the lower percentile and the line turns blue. It will stay there for eleven sessions: the market barely moves, continuation strategies produce nothing and range traders earn little but steadily. Then within two bars the line crosses the median and breaks the upper percentile, turning orange. From that point the same stop settings become too tight and position size must be cut at least in half to keep the same currency risk. The cone flagged first the compression and then the expansion, without ever needing to know which way price would go.
## Input parameters
| Parameter | Default | Description |
|---|---|---|
| `InpRvPeriod` | 20 | Bars over which realized volatility is measured. Short windows react quickly but produce a very jumpy line. |
| `InpHistory` | 250 | History over which the reference distribution is built. The longer it is the more stable the percentiles, but the slower they adapt to a structural change of the market. |
| `InpUpperPct` | 80.0 | Upper percentile bounding the expansion regime. Raising it to 90 flags only genuinely exceptional volatility. |
| `InpLowerPct` | 20.0 | Lower percentile bounding the compression regime. If the two percentiles are inverted by mistake, the indicator reorders them automatically. |
## Advantages / strengths
- It turns a scale-free number into an immediately readable classification of the volatility regime.
- The reference is the instrument own history, so it works with no calibration on any market.
- The cone width is informative in itself: it tells how prone that market is to regime changes.
- No repaint, with the sorting array sized only once to contain the computational cost.
## Limitations and warnings
- Sorting a wide window on every bar makes the first pass noticeably slower than an ordinary volatility indicator.
- After a structural market change the percentiles stay anchored to the old regime for the whole length of the historical window.
- It gives no directional information: it says how much the market will move, never which way.
- It requires many bars before the first useful value, which makes it impractical on charts with limited history.
**No repaint:** values printed on a closed bar are never modified afterwards.
**Disclaimer.** This product is a technical analysis tool, not an automated trading system, and it offers no profit guarantee whatsoever. Financial markets carry the risk of total loss of the invested capital. Past performance is not indicative of future results. Every signal must be confirmed with your own analysis, a money management plan and prior testing on a demo account. The author is not responsible for trading decisions taken on the basis of this indicator.
## Suggested tags / keywords for MQL5
`volatility`, `percentile`, `realized volatility`, `regime`, `compression`, `position sizing`, `no repaint`, `statistics`