Directional Efficiency
- Göstergeler
- Sürüm: 1.0
- Etkinleştirmeler: 5

# Directional Efficiency - Net path versus gross path
*Category: Trend | Difficulty: intermediate | Window: separate window below the chart | Markets: Universal (Forex, indices, commodities, crypto, stocks) | Suggested timeframes: M15, M30, H1, H4, D1*
## Short description
> Signed ratio between the net distance travelled by price and the gross path actually covered. It separates straight trends from disorderly advances that burn capital.
### Overview
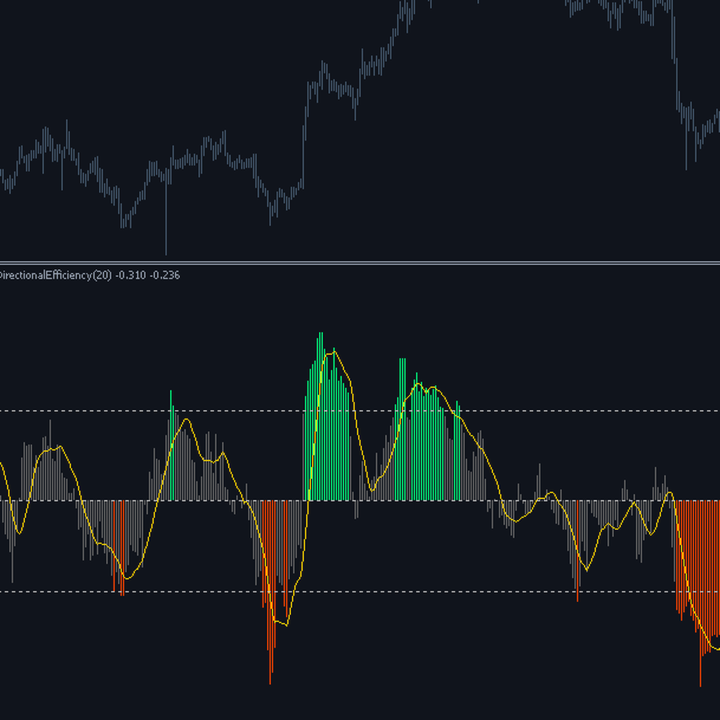
Two markets can rise by the same amount over twenty bars and yet be operationally opposite. In the first, price rises almost in a straight line and a reasonable stop is never touched. In the second, price rises while swinging constantly, covering four times the useful distance: the same stop is hit three times before the target is reached. Directional Efficiency measures exactly that difference. It divides the net distance between today price and the price N bars ago by the sum of all absolute bar by bar changes, keeping the sign of the move. A value of +0.90 describes an almost straight advance, +0.20 a laboured one, values near zero a market moving a lot while going nowhere.
### How the calculation works
1. For each bar the gross path is measured, that is the absolute change of the applied price versus the previous bar.
2. With InpUseTrueRange enabled the gross path becomes the True Range, thereby including gaps and the intra-bar excursion.
3. The net path is simply the difference between the current price and the price InpPeriod bars earlier, with its own sign.
4. Efficiency is the ratio of the two. Since the gross path is always at least as large as the net one, the result naturally stays between -1 and +1.
5. With True Range the ratio can exceed one when gaps occur: it is therefore clamped to keep the scale readable.
6. The histogram is coloured beyond the InpCleanLevel threshold and accompanied by a signal average.
### How to use it
- Use it to decide whether a move is worth chasing: below the efficiency threshold the trend exists but costs too much in stops.
- Size the stop by efficiency: low efficiency means more room is needed, hence a smaller position for the same risk.
- A high value beginning to fall while price keeps rising indicates the move is becoming disorderly: a fatigue warning.
- Comparing efficiency across several instruments in the same session helps choose where to trade: always prefer the more efficient market.
- Enable True Range on markets with frequent gaps, such as cash equities and indices, where ignoring them would distort the measure.
### Who it is for and on which timeframes
It is useful to anyone choosing between instruments or deciding how much to risk on a single trade, hence to discretionary traders and to portfolio-of-systems managers alike. It works well from M15 to D1. On lower timeframes the gross path is dominated by spread and microstructure moves, and efficiency tends to stay low by construction, which makes the measure less discriminating. No statistical background is needed: the ratio between distance covered and useful distance is intuitive.
### Practical example of reading a signal
A trader compares two candidates for the day. On EURUSD H1 efficiency reads +0.15: price rose forty pips while covering over two hundred, and indeed the chart is a sequence of rebounds. On XAUUSD H1 efficiency reads +0.72: price rose almost linearly. For the same directional expectation the second trade needs a far tighter stop to be protected and has a much lower chance of being closed by noise. The choice falls on XAUUSD, while on EURUSD one may switch to range logic instead of trend logic.
## Input parameters
| Parameter | Default | Description |
|---|---|---|
| `InpPeriod` | 20 | Number of bars the ratio is measured over. Short windows make efficiency very variable, long windows flatten it towards average values. |
| `InpSignalPeriod` | 9 | Period of the signal average overlaid on the histogram. |
| `InpCleanLevel` | 0.40 | Symmetric threshold beyond which the move is deemed orderly and the histogram is coloured. On very noisy instruments lowering it to 0.30 is advisable. |
| `InpUseTrueRange` | false | With true the gross path includes gaps and intra-bar excursion. Recommended on equities, cash indices and markets with trading interruptions. |
| `InpAppliedPrice` | PRICE_CLOSE | Price on which net and gross paths are measured. |
## Advantages / strengths
- It measures a market dimension, the quality of the move, that no momentum oscillator captures.
- Fixed scale between -1 and +1 on any instrument and timeframe: values are immediately comparable with no calibration.
- It has a direct use in risk sizing, not just in analysis.
- Light computation, no repaint, no external dependency.
## Limitations and warnings
- It does not tell when to enter: it only says whether the type of move favours a directional strategy.
- On very low timeframes the spread inflates the gross path and systematically pushes efficiency towards zero.
- A high value can also be produced by a single violent burst followed by stillness: efficiency does not distinguish a continuous move from one concentrated in a single bar.
- The value depends sensitively on InpPeriod: changing the window can produce very different readings on the same chart.
**No repaint:** values printed on a closed bar are never modified afterwards.
**Disclaimer.** This product is a technical analysis tool, not an automated trading system, and it offers no profit guarantee whatsoever. Financial markets carry the risk of total loss of the invested capital. Past performance is not indicative of future results. Every signal must be confirmed with your own analysis, a money management plan and prior testing on a demo account. The author is not responsible for trading decisions taken on the basis of this indicator.
## Suggested tags / keywords for MQL5
`efficiency`, `trend quality`, `noise`, `risk sizing`, `trend filter`, `oscillator`, `no repaint`, `market selection`