Volume Divergence Tracker
- Göstergeler
- Sürüm: 1.0
- Etkinleştirmeler: 5

# Volume Divergence Tracker - Price to volume correlation
*Category: Volume | Difficulty: intermediate | Window: separate window below the chart | Markets: Universal (Forex, indices, commodities, crypto, stocks) | Suggested timeframes: M15, M30, H1, H4, D1*
## Short description
> Measures the rolling correlation between the size of price moves and the change in volume. It recognises when movement loses the support of participation.
### Overview
In a healthy market price and volume move together: price advances when participation arrives and slows when it withdraws. It is a relationship so obvious it is taken for granted, and precisely for that reason its breakdown often goes unnoticed. Volume Divergence Tracker measures it explicitly with the linear correlation coefficient between the size of price moves and the change in volume, computed over a rolling window. When the correlation collapses to zero or turns negative the link has broken: price keeps moving but volume no longer accompanies it, or volume rises without price progressing. Both situations describe a move that has lost its support, and the correlation recognises them before they become visible on the price chart.
### How the calculation works
1. The first series is the absolute close change: what matters is how much price moved, not in which direction.
2. The second series is the change in volume versus the previous bar, not volume itself.
3. On each window the means of both series are computed, then the covariance and variances relative to those means.
4. The correlation coefficient is the covariance divided by the root of the product of the two variances.
5. A zero denominator means one of the series is constant: in that case there is no correlation to measure and the value stays at zero.
6. The result is clamped between minus one and plus one to correct small overshoots caused by rounding.
### How to use it
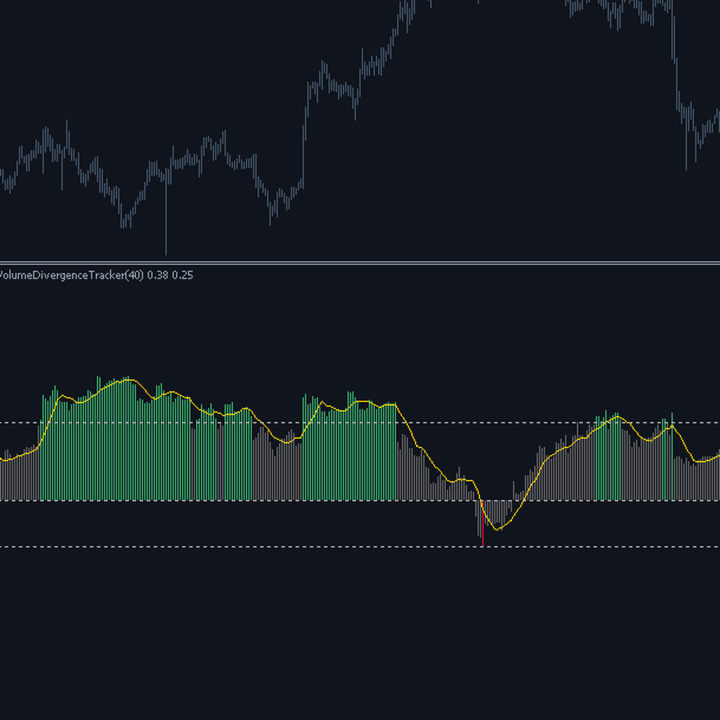
- Correlation in the green zone means movement is supported: the context in which breakouts work.
- A drop in correlation during a trend is an early warning: the move continues but is no longer accompanied by participation.
- Negative correlation describes an anomalous situation, where volume rises precisely as price stalls: often absorption.
- Use it as a context quality filter rather than a signal: it says whether to trust the move, not where it will go.
- Short windows make the correlation very unstable: below twenty bars the coefficient is dominated by chance.
### Who it is for and on which timeframes
It suits traders who want to assess the quality of a move before trading it, and system builders whose logic must switch off when context deteriorates. It works from M15 to D1. It does not require knowing how a correlation is computed, but understanding that a value near zero means absence of a link, not a negative link, avoids the most common reading error. It works on any instrument, with the usual caveat that on forex tick volume is an approximation.
### Practical example of reading a signal
On NASDAQ100 H1 the market has been rising for two weeks and the correlation sits steadily above 0.5, in the green zone: every price advance is accompanied by rising volume, the move is supported. Then the correlation falls to 0.1 over three days while price keeps making new highs. The link has broken: price rises but volume no longer follows. This is not a sell signal, but it is the end of the favourable context: the trader stops adding to the position and tightens the stop. Over the following sessions the correlation turns negative and price begins to fall.
## Input parameters
| Parameter | Default | Description |
|---|---|---|
| `InpWindow` | 40 | Window over which the correlation is computed. Below twenty bars the coefficient becomes chance dominated and meaningless. |
| `InpSignalPeriod` | 9 | Period of the signal average overlaid on the histogram. |
| `InpHealthyLevel` | 0.35 | Correlation beyond which the price to volume link is deemed healthy. |
| `InpBrokenLevel` | -0.20 | Correlation below which the link is deemed inverted. If the thresholds are inconsistent, the indicator separates them automatically. |
| `InpUseRealVolume` | false | With true, real volume is used when available; with false, or in its absence, tick volume. |
## Advantages / strengths
- It explicitly measures a relationship everyone takes for granted and whose breakdown almost always goes unnoticed.
- The correlation coefficient has a fixed, interpretable scale, independent of instrument and timeframe.
- It provides an early warning: the link breaks before price shows weakness.
- It explicitly handles the constant series case, where correlation is undefined.
## Limitations and warnings
- Correlation measures the linear link: non-linear relationships between price and volume escape it entirely.
- On short windows the coefficient is very unstable and can change sign through pure sampling variability.
- It does not distinguish price direction, by construction: it uses the absolute change.
- On forex tick volume introduces noise that systematically lowers the measured correlation.
**No repaint:** values printed on a closed bar are never modified afterwards.
**Disclaimer.** This product is a technical analysis tool, not an automated trading system, and it offers no profit guarantee whatsoever. Financial markets carry the risk of total loss of the invested capital. Past performance is not indicative of future results. Every signal must be confirmed with your own analysis, a money management plan and prior testing on a demo account. The author is not responsible for trading decisions taken on the basis of this indicator.
## Suggested tags / keywords for MQL5
`volume`, `correlation`, `divergence`, `confirmation`, `trend quality`, `statistics`, `no repaint`, `early warning`