Two Period RSI Alerts
- Göstergeler
-
Libertas LLC
 Libertas LLC is a software company by enterprising math nerds. We make high quality and complex mathematical tools in a user-friendly and easy to use package for retail investors.
 - Sürüm: 1.2
- Güncellendi: 1 Aralık 2021
- Etkinleştirmeler: 20
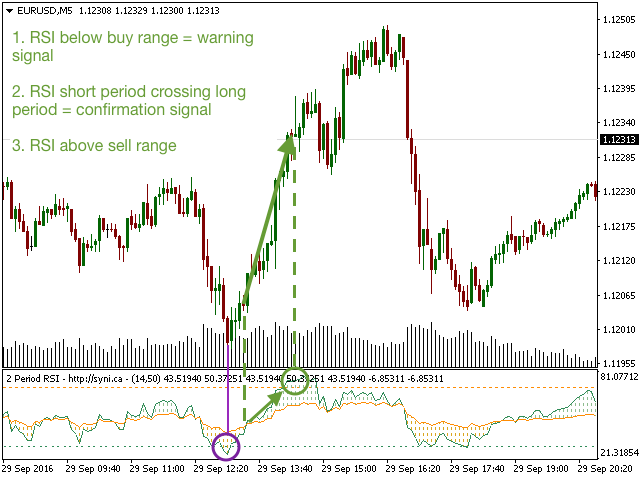
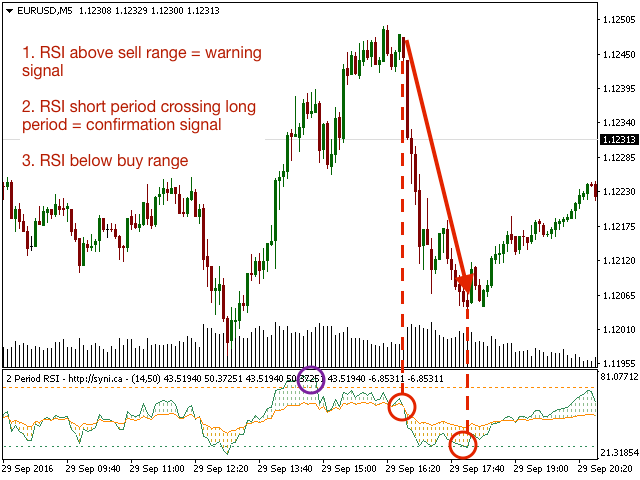
Two Period RSI + Alerts compares long-term and short-term RSI lines, and plots a fill between them for improved visualization. Fill is colored differently according to an uptrend (short period RSI above long period RSI) or a downtrend (short period RSI below long period RSI). Short-term RSI crossing long-term RSI adds a more robust trend confirmation signal than using single period RSI alone.
This is a tool to help visualize and confirm RSI trends. We hope you enjoy!
Alerts
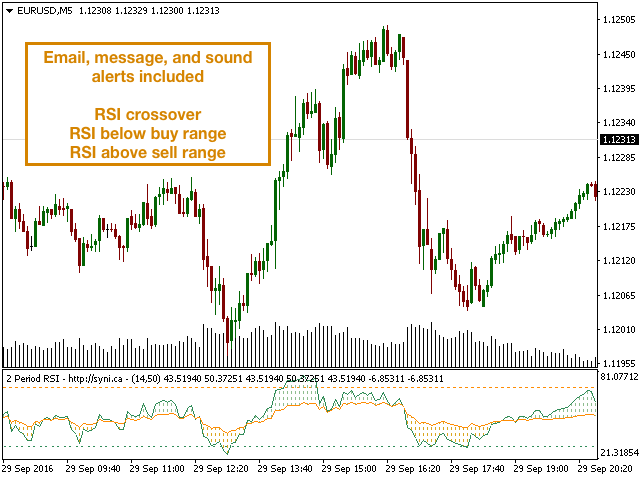
Email, message, and sound alerts can be turned on/off for the following events. Please note that email recipient and SMTP information should be specified in MetaTrader 4/options before using email alerts.
- Short period RSI crossing long period RSI
- RSI is below user-selectable buy threshold (Default=30)
- RSI is above user-selectable sell threshold (Default=70)
Parameters
- Short period (Default=14): number of bars used to calculate short period RSI
- Long period (Default=50): number of bars used to calculate long period RSI
- Turn on/off all alerts: True = alerts are allowed, false = all alerts are paused
- Alert when RSI short crosses RSI long: if true, alerts when RSI short crosses RSI long
- Alert when RSI crosses buy threshold: if true, alert when short period RSI is below "Alert buy threshold"
- Alert buy threshold (Default=30): value for "buy" threshold alerts
- Alert when RSI crosses sell threshold: if true, alert when short period RSI is above "Alert sell threshold"
- Alert sell threshold (Default=70): value for "sell" threshold alerts
- Turn on alerts message: message box alert
- Turn on alerts sound: sound alert
- Turn on alerts email: email alert


Thanks