Fibonacci Regression Volume Map
- Göstergeler
- Sürüm: 1.0
- Etkinleştirmeler: 5

Fibonacci Regression Volume Map
See structure, value and directional pressure in one chart.
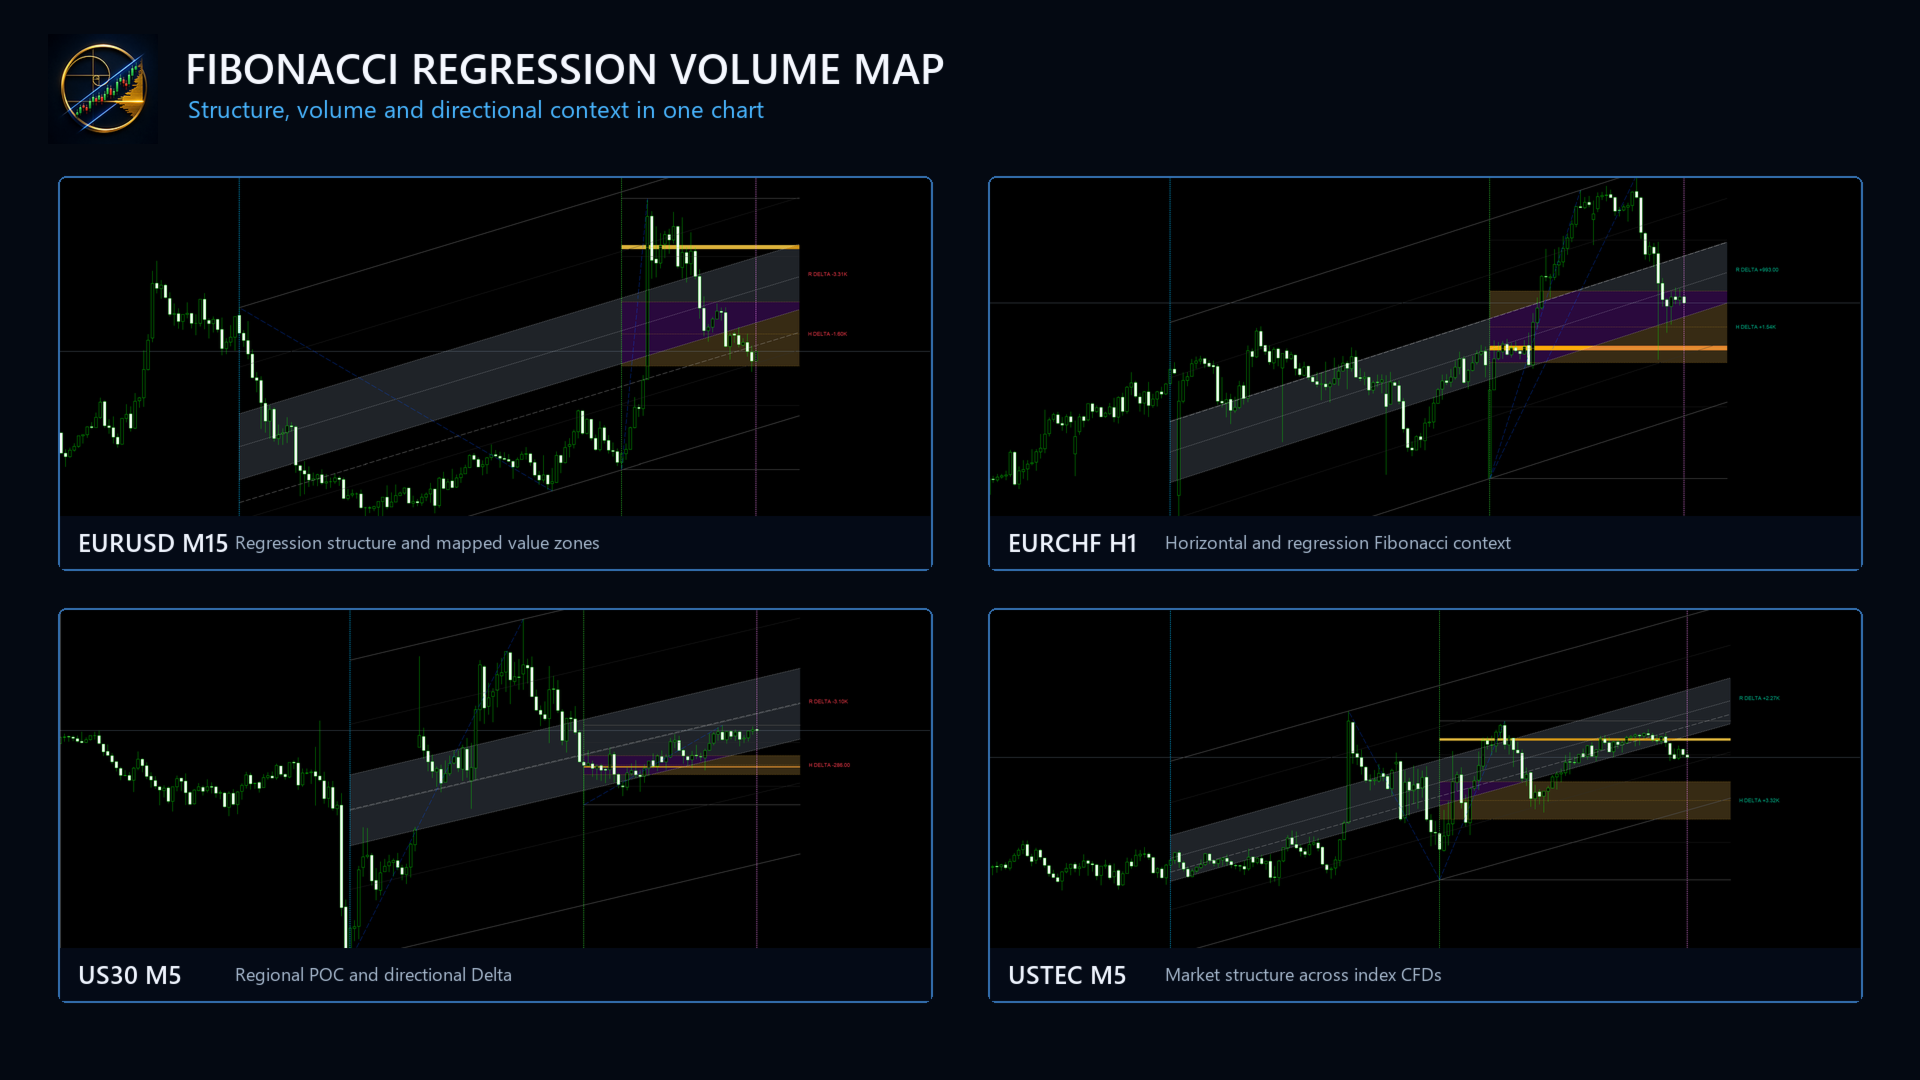
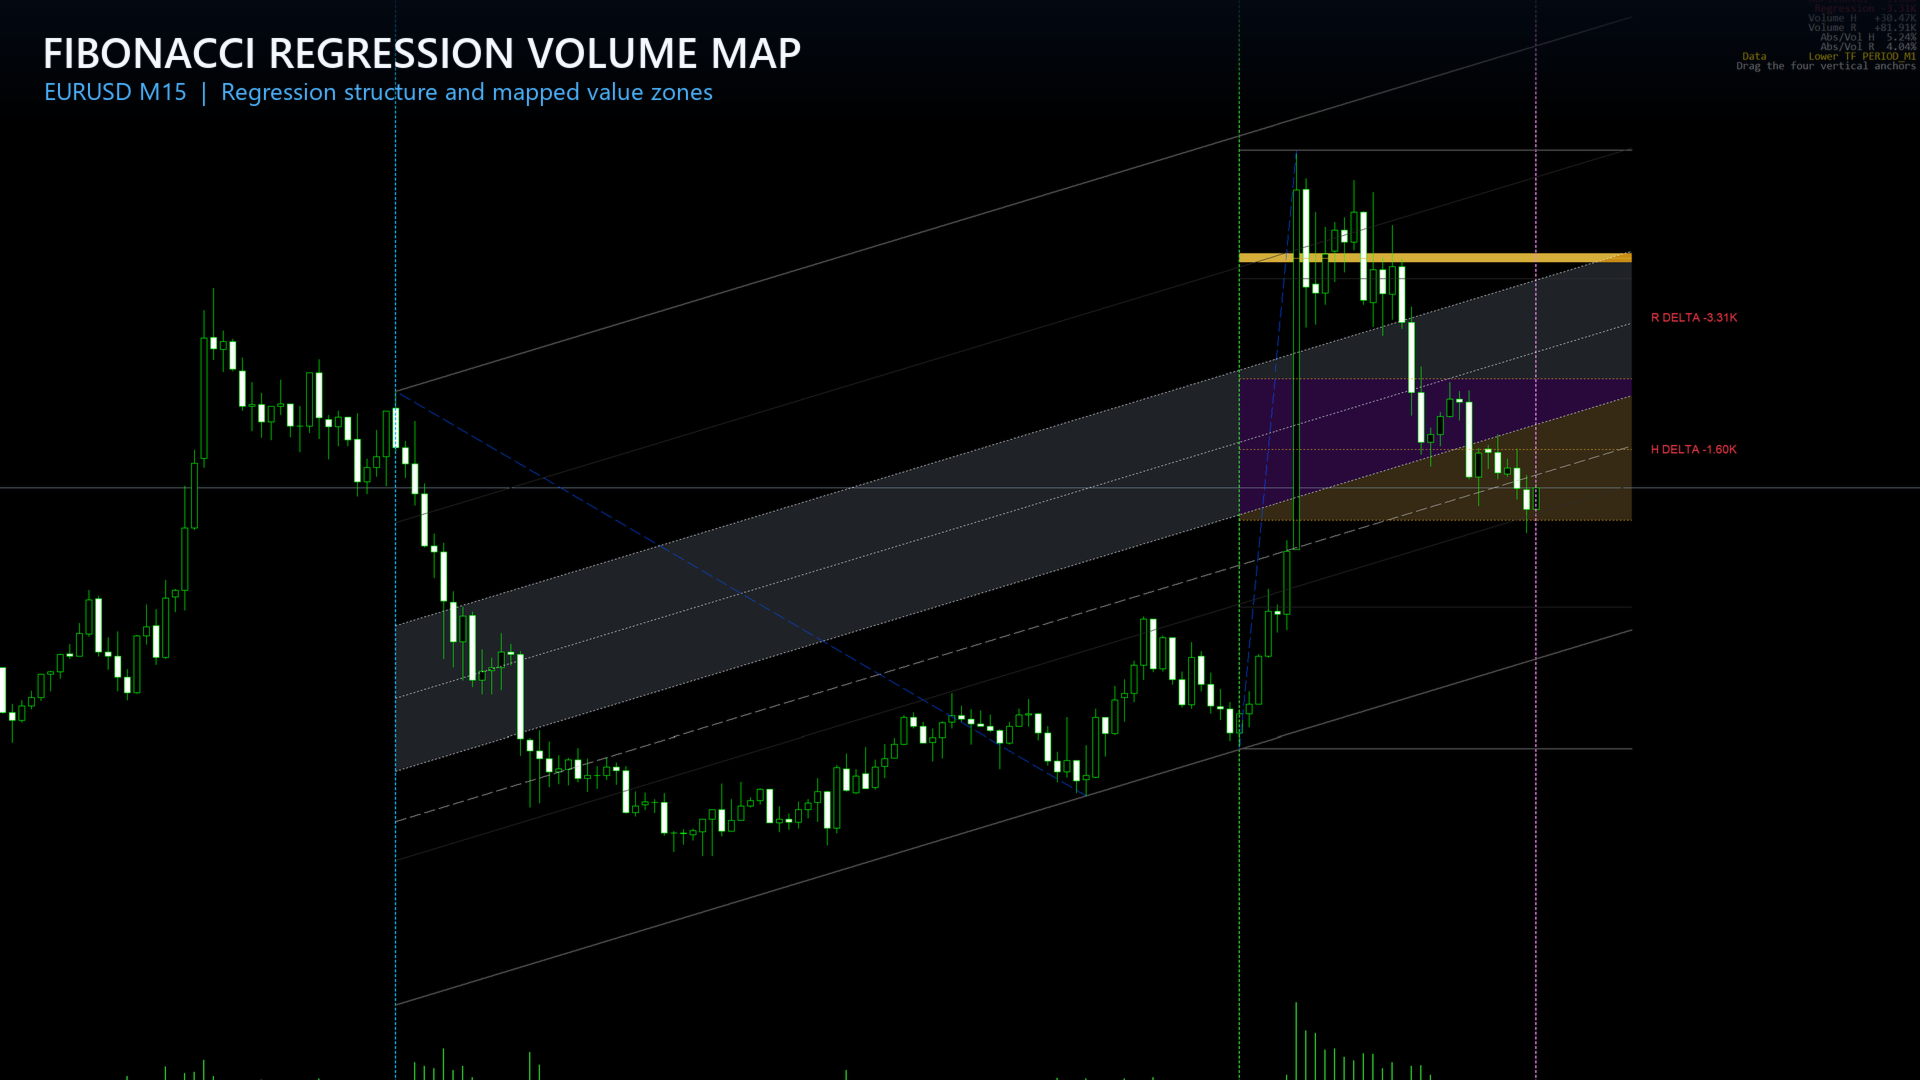
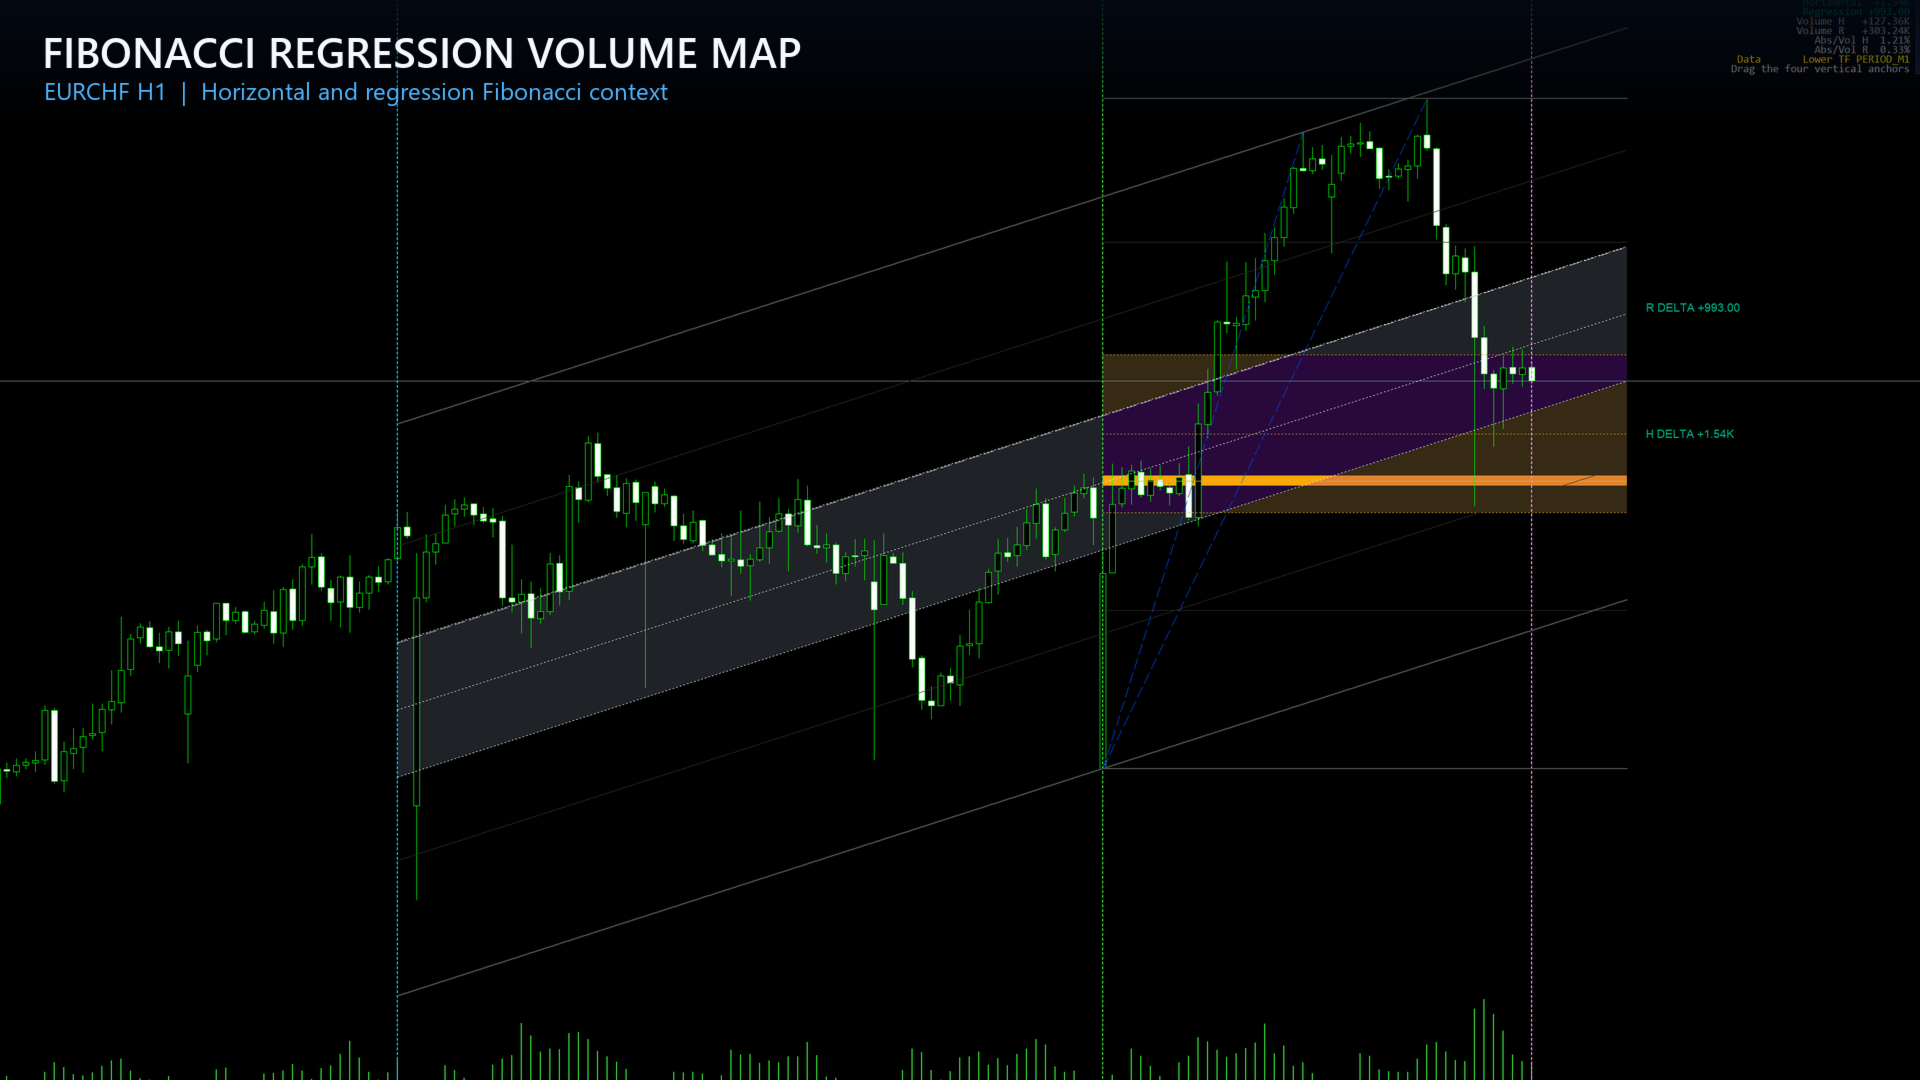
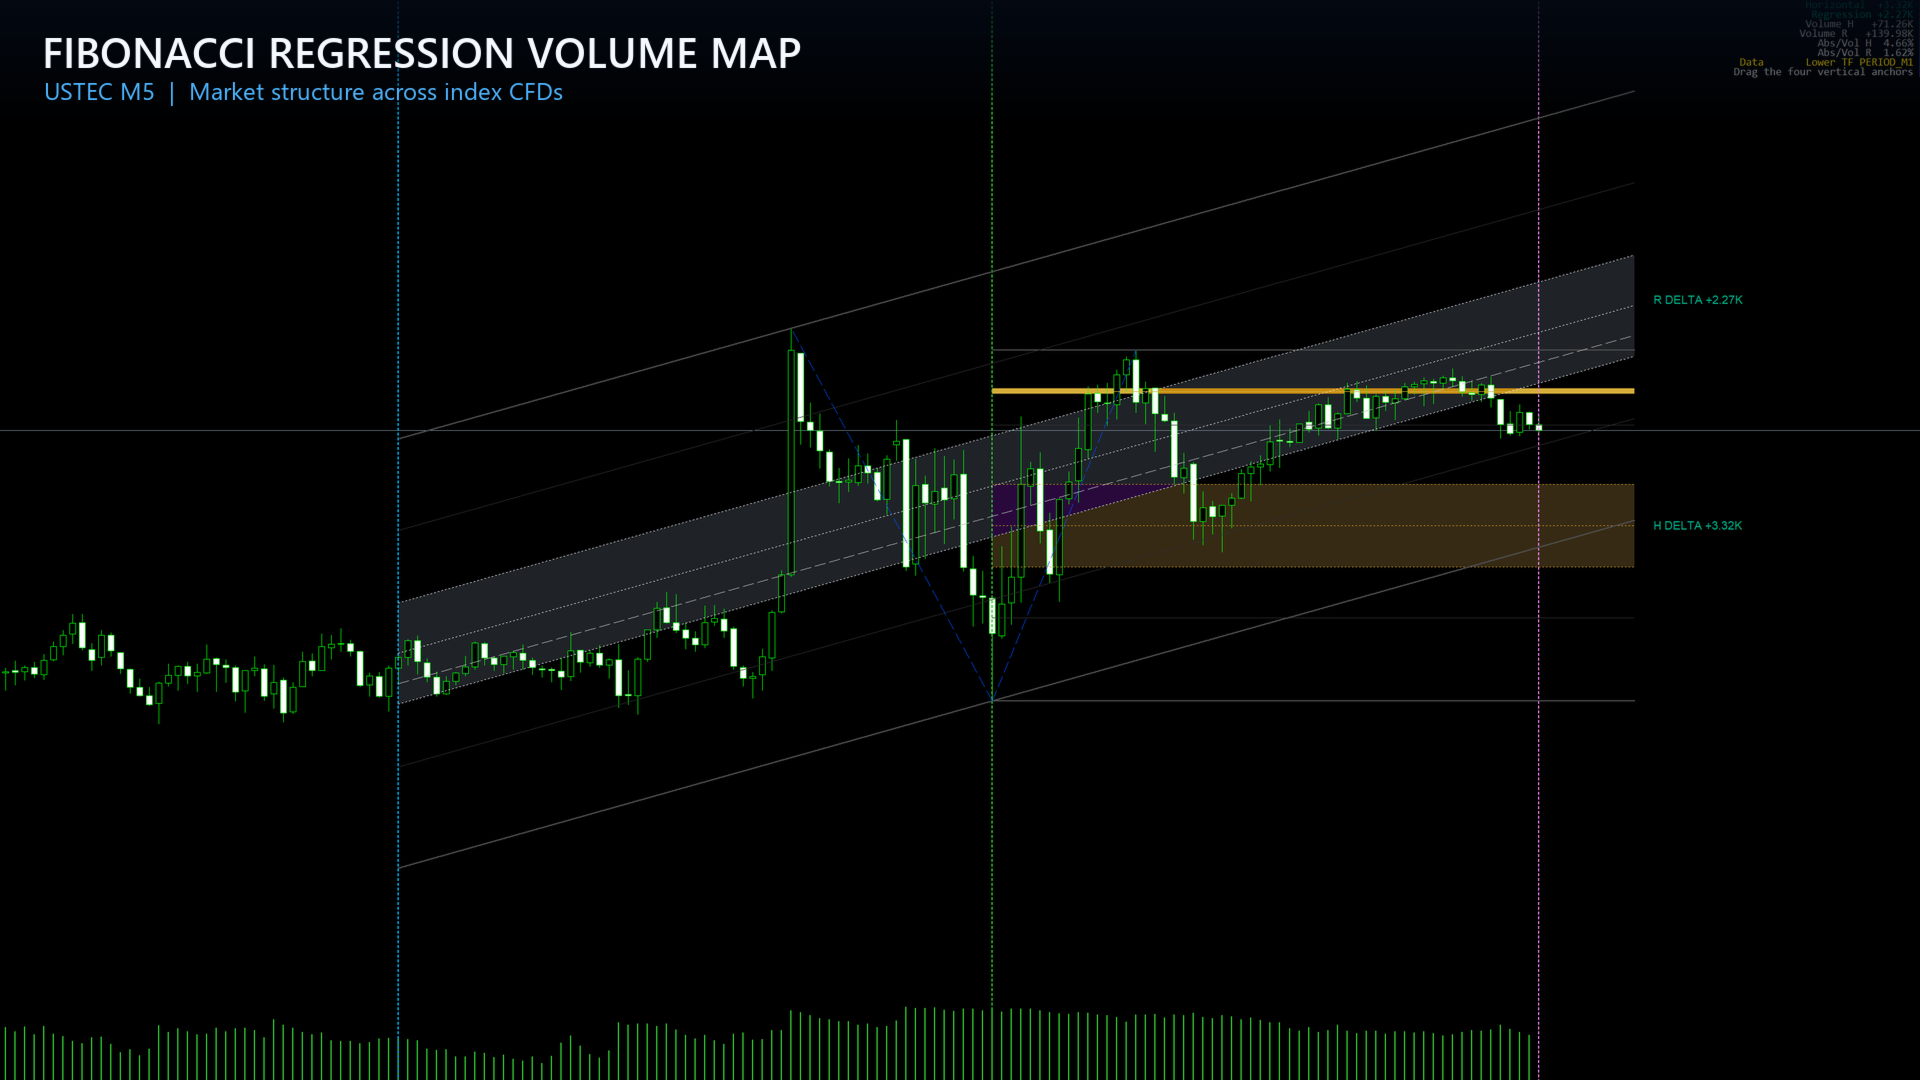
Fibonacci Regression Volume Map transforms any selected market range into a structured analytical workspace. It combines horizontal Fibonacci levels, a regression-based inclined Fibonacci channel, Golden Zones, regional Point of Control and directional volume context in a single MetaTrader 5 indicator.
Instead of analyzing isolated levels, you can observe how price structure, value concentration and directional participation interact inside the same region.
Four analytical layers
Horizontal Fibonacci map
The indicator detects the high and low of the selected horizontal region and projects the standard Fibonacci levels. Direction can be selected manually or determined automatically from the order of the extremes.
Regression Fibonacci structure
A least-squares regression line is calculated from Close, HLC3 or OHLC4 data. Parallel Fibonacci levels are then distributed across the channel height, allowing the structure to follow the slope of the selected movement.
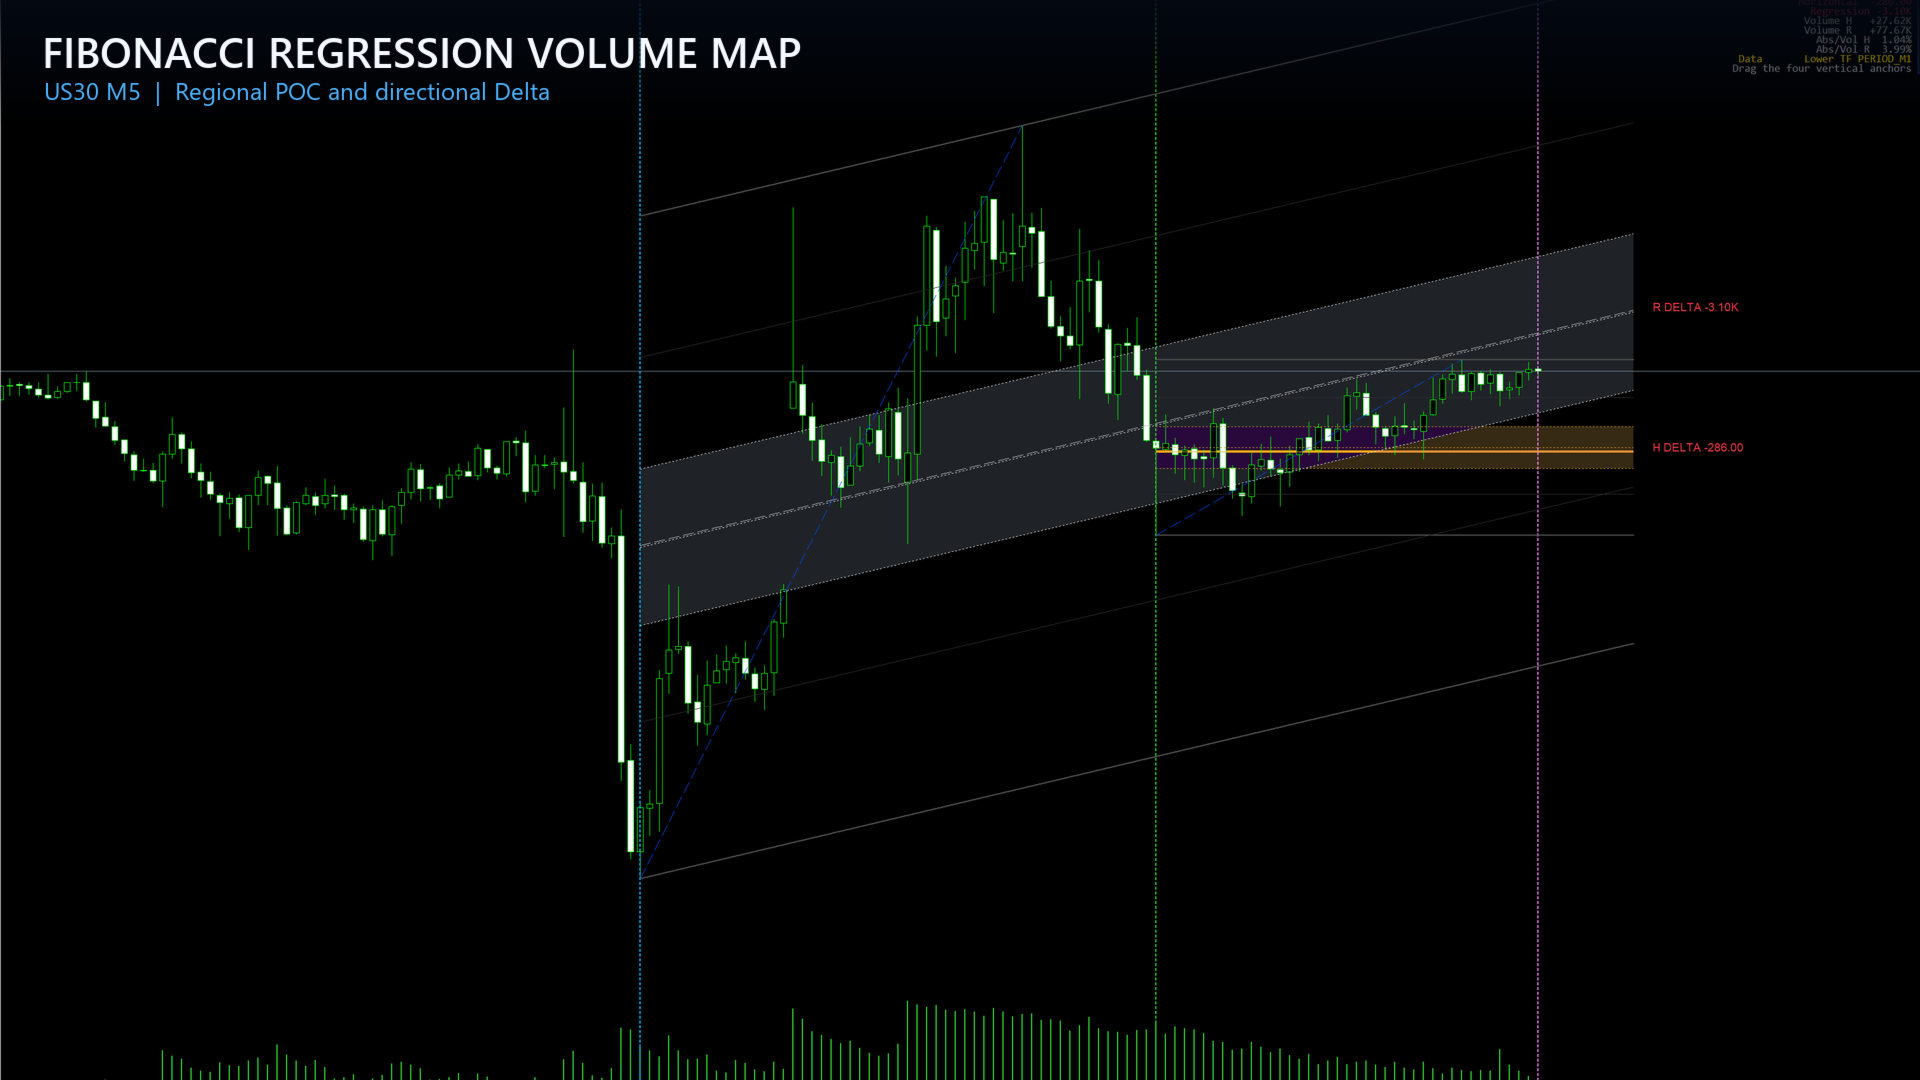
Regional Point of Control
The selected price range is divided into configurable rows. The row with the highest accumulated volume is highlighted as the regional POC. Multiple allocation methods are available for lower-timeframe or chart-timeframe data.
Directional volume context
Lower-timeframe volume is classified according to candle direction. The indicator displays horizontal and regression Delta values, total regional volume and the absolute Delta-to-volume ratio.
Main features
- Horizontal and regression-based Fibonacci maps
- Standard levels: 0, 0.236, 0.382, 0.500, 0.618, 0.786 and 1.000
- Draggable custom range anchors
- Rolling lookback range modes
- Automatic, bullish or bearish Fibonacci orientation
- Multiple Golden Zone presets and manual boundaries
- Regression based on Close, HLC3 or OHLC4
- Regional POC calculated from configurable price rows
- Lower-timeframe and chart-timeframe POC modes
- Directional Delta for horizontal and regression regions
- Total volume and absolute Delta-to-volume readings
- Customizable colors, line widths and labels
- Clean professional presentation designed for dark charts
A practical analysis process
- Select a meaningful region such as an impulse, consolidation, session or swing.
- Read the horizontal Fibonacci map and regional POC.
- Compare price with the inclined regression structure.
- Look for overlap between Fibonacci levels, Golden Zones, POC and channel boundaries.
- Use directional volume as additional context.
- Apply your own entry trigger, invalidation level and risk plan.
Range selection
Custom mode displays four colored vertical anchors. Two anchors define the horizontal region and two define the regression region. Drag the anchors directly on the chart to update the analysis.
Lookback mode automatically recalculates the region from the latest configurable number of chart bars. The regression structure can also reuse the horizontal range.
POC calculation modes
- Lower timeframe price range: distributes each lower-timeframe bar volume across the price rows touched by that bar.
- Lower timeframe HLC3: assigns each bar volume to its HLC3 price row.
- Lower timeframe Close: assigns each bar volume to its closing-price row.
- Lower timeframe OHLC4: assigns each bar volume to its OHLC4 price row.
- Current chart price range: uses chart-timeframe bars and their touched price rows.
Data transparency
The indicator uses real volume when the broker supplies it. Otherwise, it uses tick volume. Directional Delta is an estimate based on candle direction and is not exchange bid/ask order flow. Values may differ between brokers because price history, tick history and available volume data are not identical.
Designed for
- Trend pullback analysis
- Mean-reversion context
- Breakout and retest mapping
- Swing and session analysis
- Fibonacci confluence workflows
- Regional support and resistance analysis
- Traders who want several analytical perspectives without loading multiple unrelated indicators
Installation and first use
- Install the indicator through the MetaTrader 5 Market.
- Open the Navigator and attach Fibonacci Regression Volume Map to a chart.
- Keep the default parameters for the first analysis.
- Drag the four colored anchors to the desired regions.
- Allow MetaTrader 5 to download the selected lower-timeframe history.
- Adjust visibility and colors according to your chart template.
Important information
This product is an analytical indicator. It does not open, manage or close trades. No analytical level or volume reading guarantees a future market reaction. Trading involves risk, and the user remains responsible for testing, position sizing and every trading decision.