Fibonacci Regression Volume Map

Fibonacci Regression Volume Map

See structure, value and directional pressure in one chart.

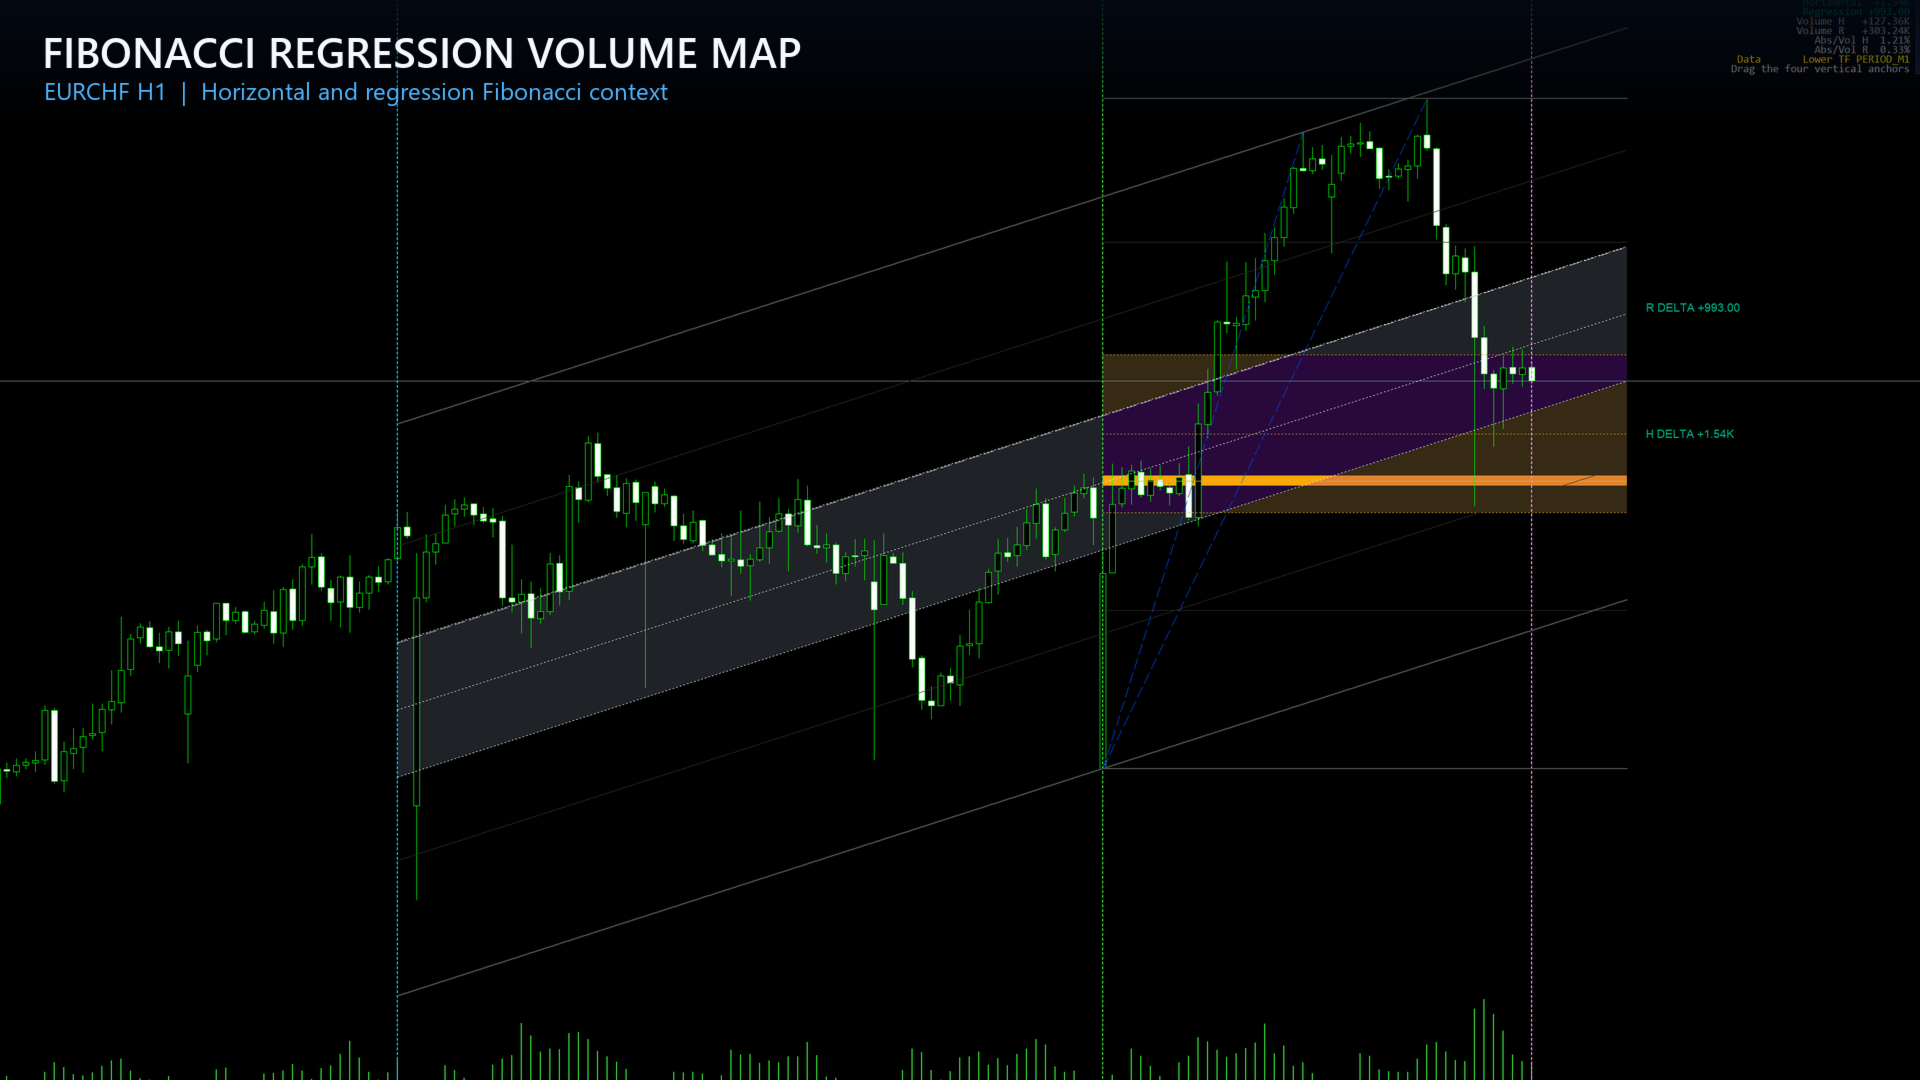
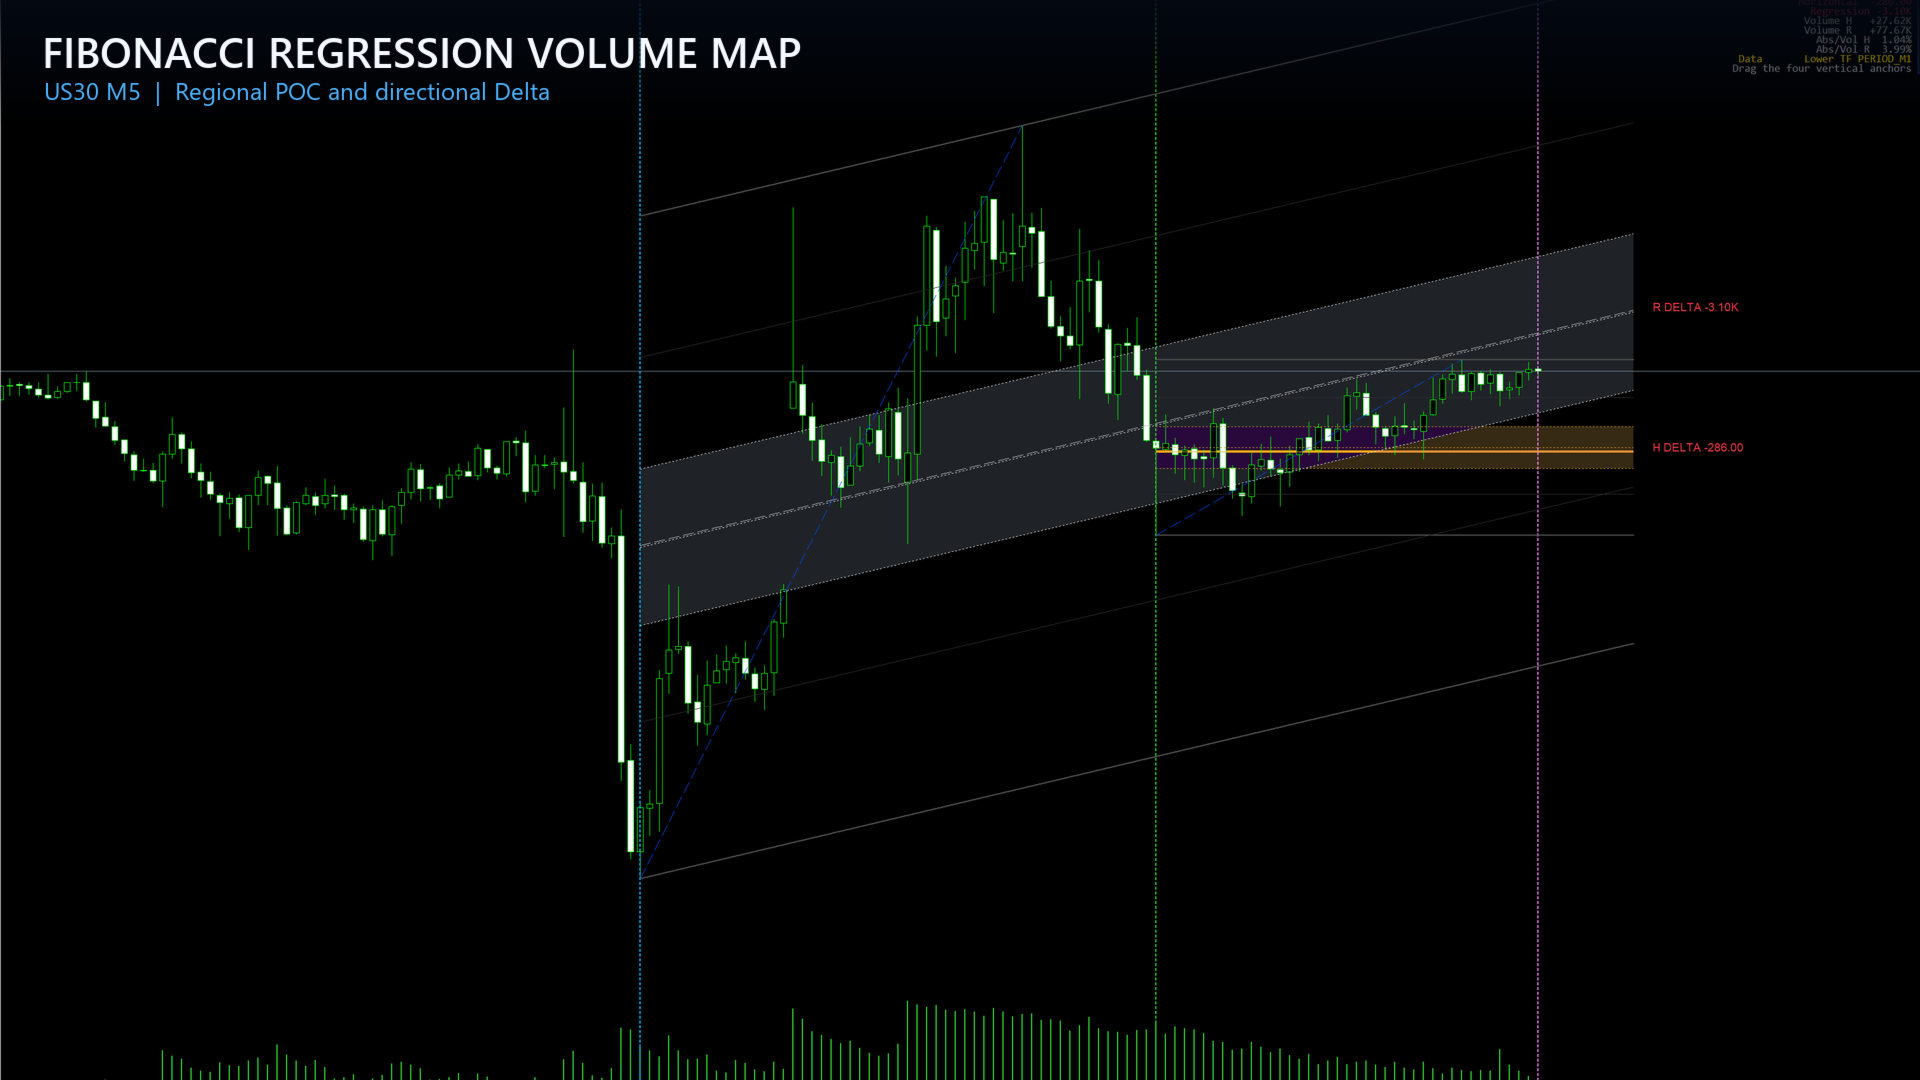
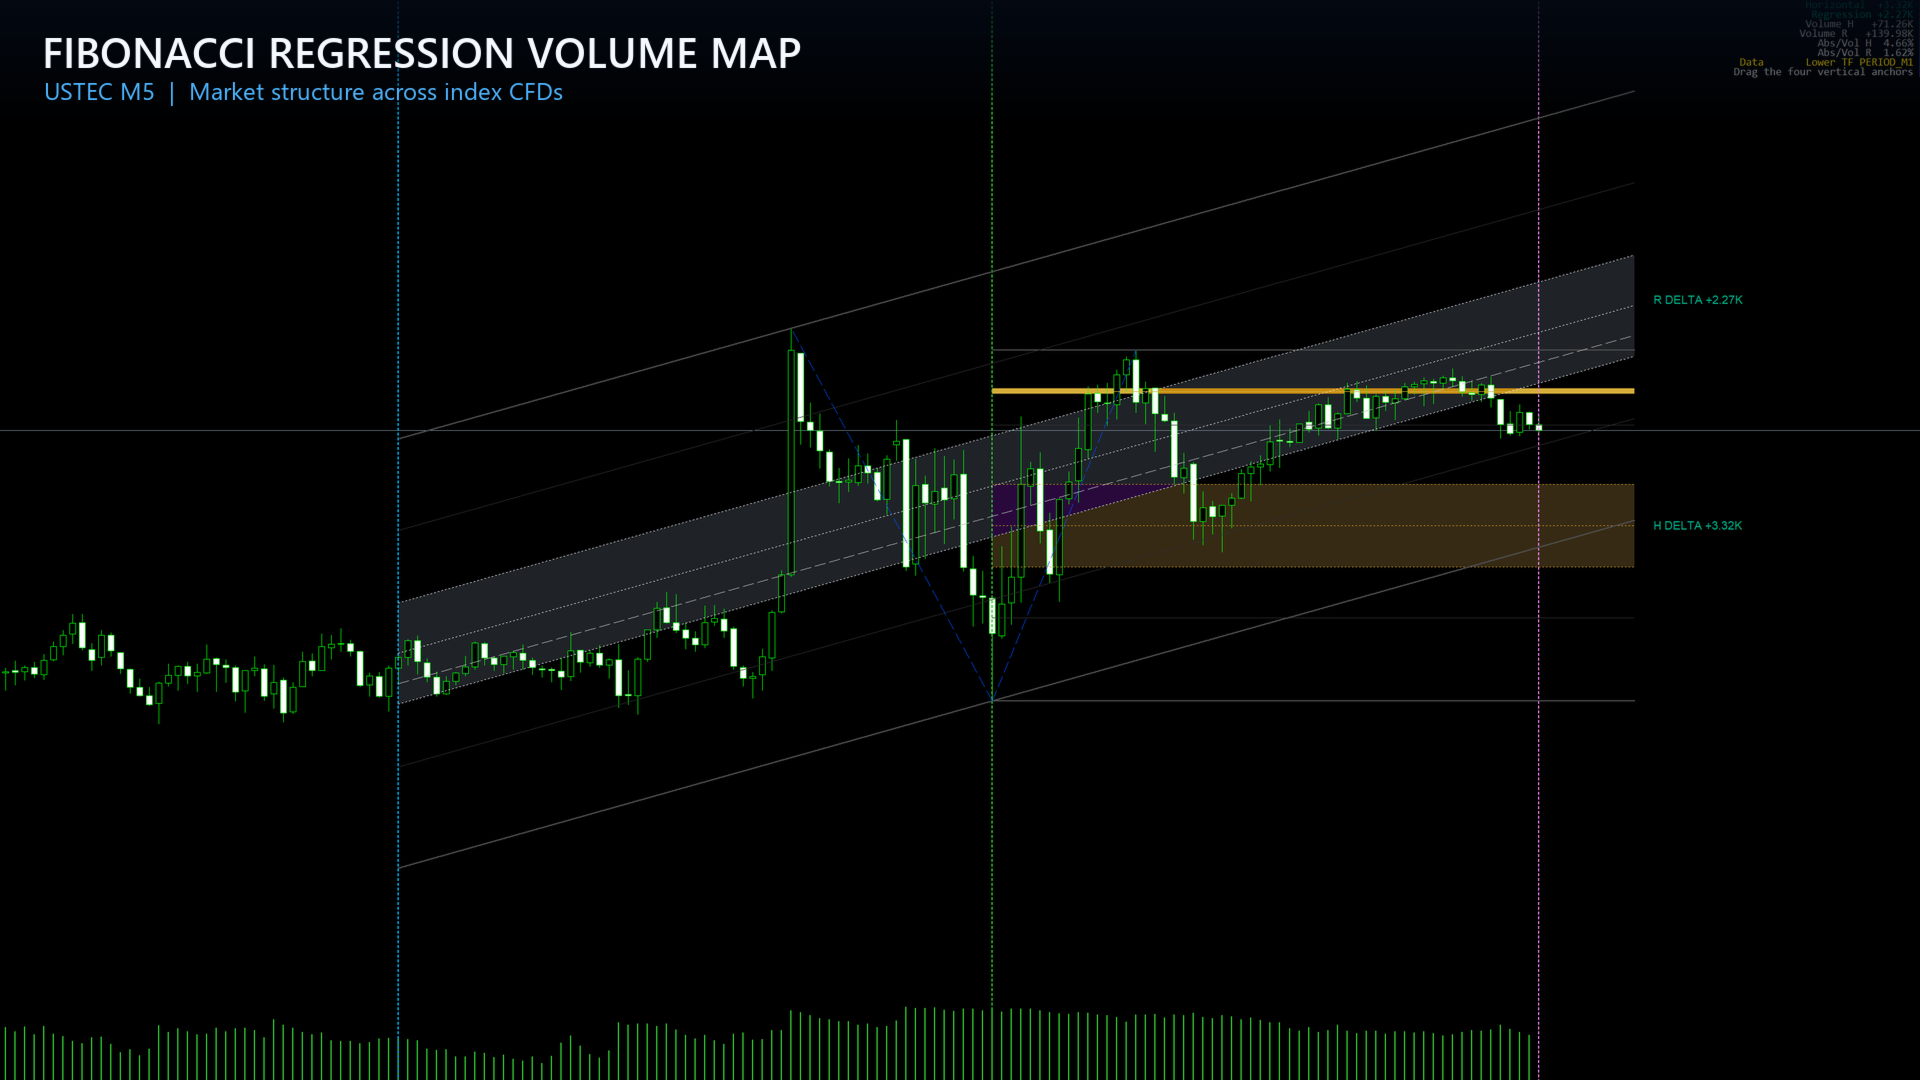
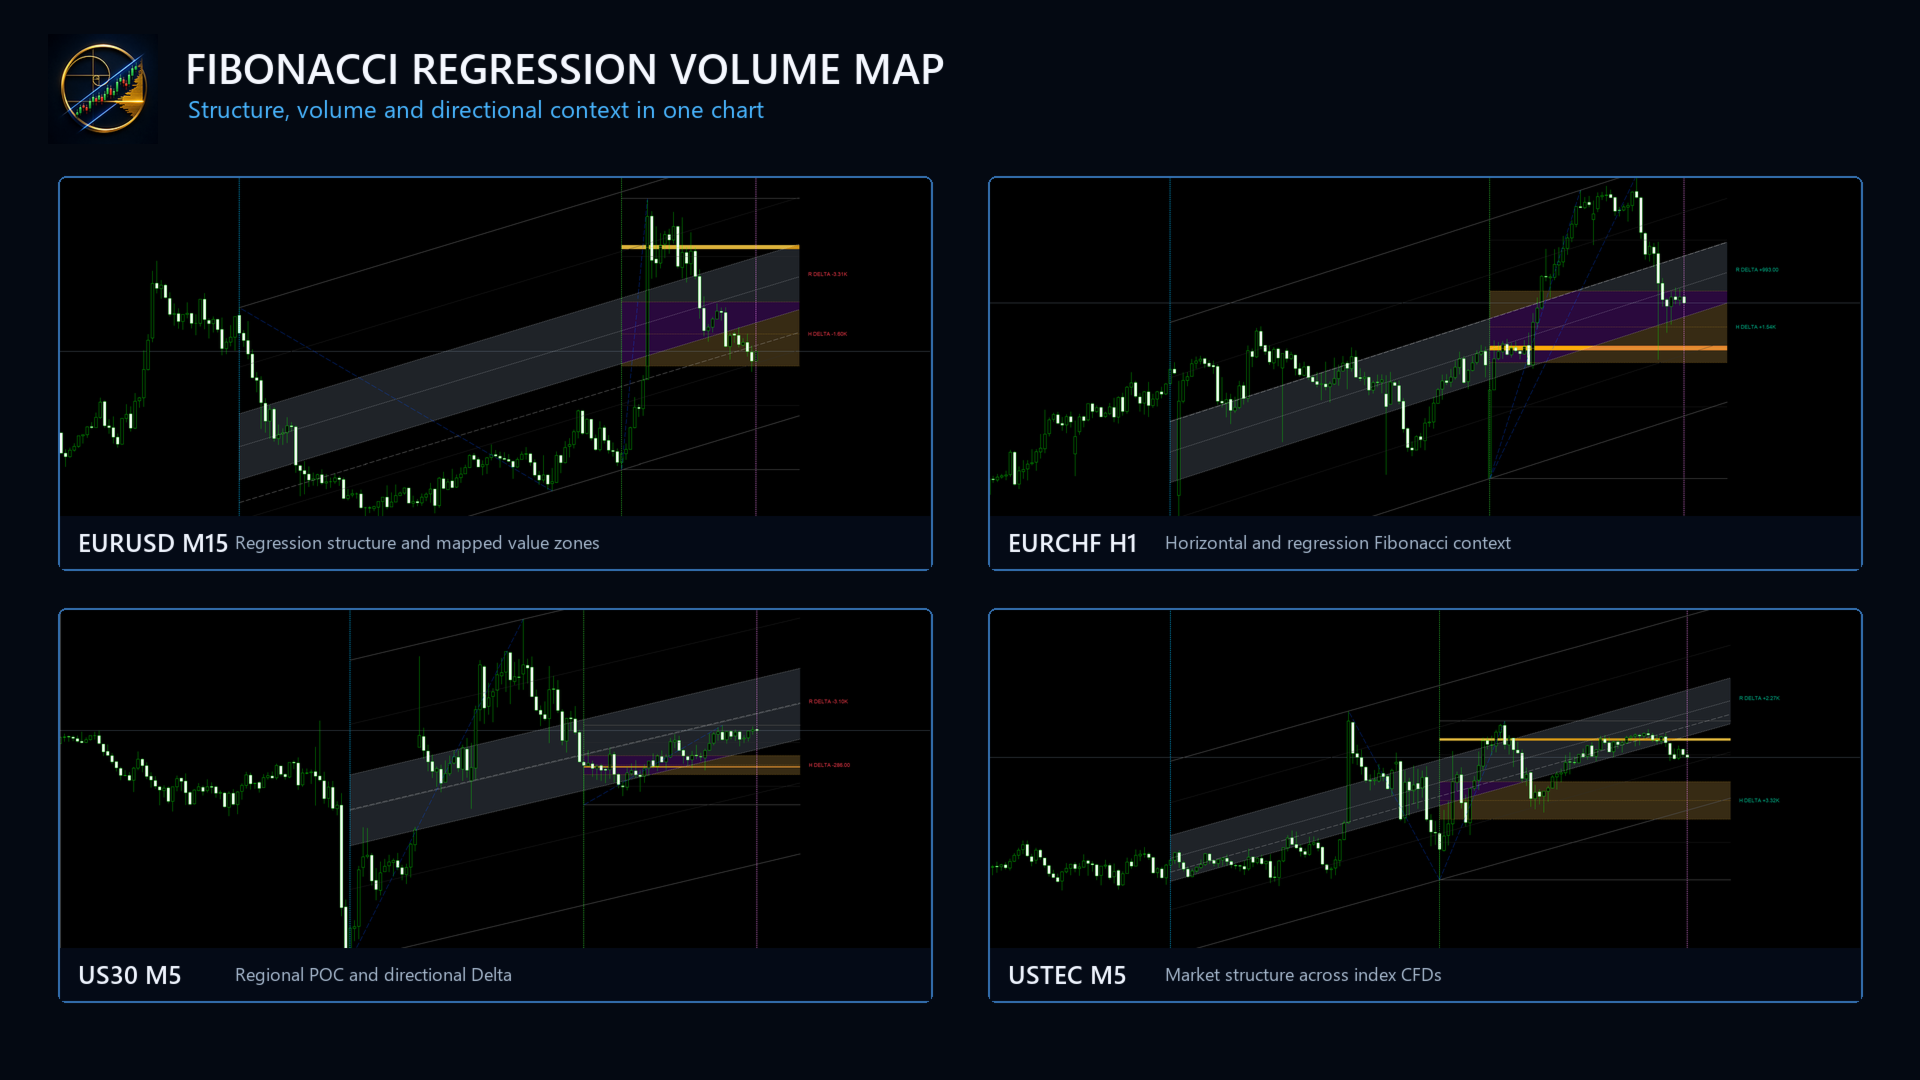
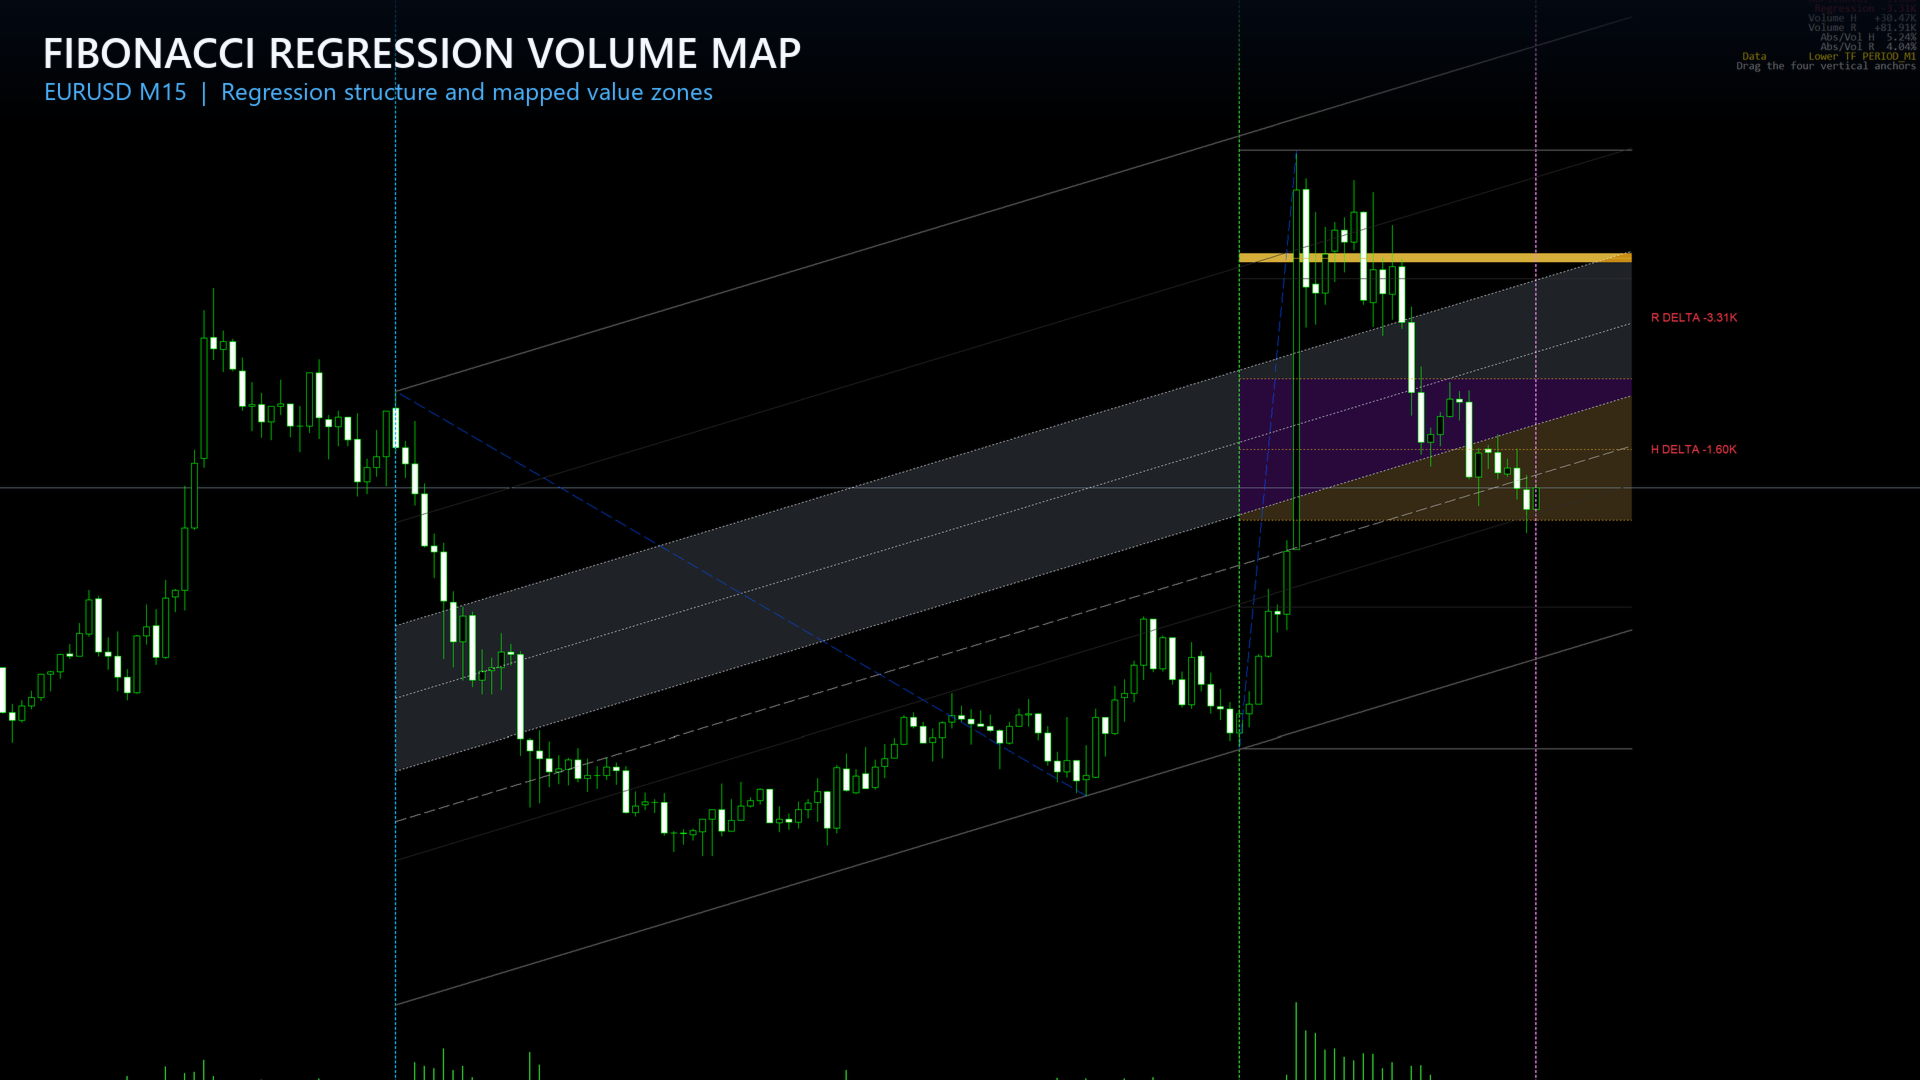
Fibonacci Regression Volume Map transforms any selected market range into a structured analytical workspace. It combines horizontal Fibonacci levels, a regression-based inclined Fibonacci channel, Golden Zones, regional Point of Control and directional volume context in a single MetaTrader 5 indicator.

Instead of analyzing isolated levels, you can observe how price structure, value concentration and directional participation interact inside the same region.

Four analytical layers

Horizontal Fibonacci map

The indicator detects the high and low of the selected horizontal region and projects the standard Fibonacci levels. Direction can be selected manually or determined automatically from the order of the extremes.

Regression Fibonacci structure

A least-squares regression line is calculated from Close, HLC3 or OHLC4 data. Parallel Fibonacci levels are then distributed across the channel height, allowing the structure to follow the slope of the selected movement.

Regional Point of Control

The selected price range is divided into configurable rows. The row with the highest accumulated volume is highlighted as the regional POC. Multiple allocation methods are available for lower-timeframe or chart-timeframe data.

Directional volume context

Lower-timeframe volume is classified according to candle direction. The indicator displays horizontal and regression Delta values, total regional volume and the absolute Delta-to-volume ratio.

Main features

  • Horizontal and regression-based Fibonacci maps
  • Standard levels: 0, 0.236, 0.382, 0.500, 0.618, 0.786 and 1.000
  • Draggable custom range anchors
  • Rolling lookback range modes
  • Automatic, bullish or bearish Fibonacci orientation
  • Multiple Golden Zone presets and manual boundaries
  • Regression based on Close, HLC3 or OHLC4
  • Regional POC calculated from configurable price rows
  • Lower-timeframe and chart-timeframe POC modes
  • Directional Delta for horizontal and regression regions
  • Total volume and absolute Delta-to-volume readings
  • Customizable colors, line widths and labels
  • Clean professional presentation designed for dark charts

A practical analysis process

  1. Select a meaningful region such as an impulse, consolidation, session or swing.
  2. Read the horizontal Fibonacci map and regional POC.
  3. Compare price with the inclined regression structure.
  4. Look for overlap between Fibonacci levels, Golden Zones, POC and channel boundaries.
  5. Use directional volume as additional context.
  6. Apply your own entry trigger, invalidation level and risk plan.

Range selection

Custom mode displays four colored vertical anchors. Two anchors define the horizontal region and two define the regression region. Drag the anchors directly on the chart to update the analysis.

Lookback mode automatically recalculates the region from the latest configurable number of chart bars. The regression structure can also reuse the horizontal range.

POC calculation modes

  • Lower timeframe price range: distributes each lower-timeframe bar volume across the price rows touched by that bar.
  • Lower timeframe HLC3: assigns each bar volume to its HLC3 price row.
  • Lower timeframe Close: assigns each bar volume to its closing-price row.
  • Lower timeframe OHLC4: assigns each bar volume to its OHLC4 price row.
  • Current chart price range: uses chart-timeframe bars and their touched price rows.

Data transparency

The indicator uses real volume when the broker supplies it. Otherwise, it uses tick volume. Directional Delta is an estimate based on candle direction and is not exchange bid/ask order flow. Values may differ between brokers because price history, tick history and available volume data are not identical.

Designed for

  • Trend pullback analysis
  • Mean-reversion context
  • Breakout and retest mapping
  • Swing and session analysis
  • Fibonacci confluence workflows
  • Regional support and resistance analysis
  • Traders who want several analytical perspectives without loading multiple unrelated indicators

Installation and first use

  1. Install the indicator through the MetaTrader 5 Market.
  2. Open the Navigator and attach Fibonacci Regression Volume Map to a chart.
  3. Keep the default parameters for the first analysis.
  4. Drag the four colored anchors to the desired regions.
  5. Allow MetaTrader 5 to download the selected lower-timeframe history.
  6. Adjust visibility and colors according to your chart template.

Important information

This product is an analytical indicator. It does not open, manage or close trades. No analytical level or volume reading guarantees a future market reaction. Trading involves risk, and the user remains responsible for testing, position sizing and every trading decision.
おすすめのプロダクト
トレンド指標, 市場フロー, モメンタム指標, プライスアクション, FXインジケーター, 売買シグナル, トレンド反転, ボラティリティ, テクニカル分析, MT5インジケーター, スキャルピング, 市場の強さ, 取引シグナル, アルゴリズム取引, 価格チャネル Quantum Pulse Force は、MetaTrader 5 向けに開発されたテクニカル指標であり、価格の動きの加速を分析し、トレンドおよびレンジ(横ばい)局面を識別し、複数の定量フィルターに基づいて重要な市場ポイントを強調します。 従来の方向のみを示す指標とは異なり、本指標は動きの強さとその変化を測定することに重点を置いており、リアルタイムで市場の挙動をより正確に把握することが可能です。 フローパーセンテージ(Flow Percentage) 本指標の中核は、2本の移動平均線の差のパーセンテージ変化です。 この計算により、移動平均間の距離が拡大しているか縮小しているかを判断し、動きの加速または減速を示します。 解釈: 正の値は上方向への加速を示す 負の値は下方向への加速を示す ゼロ付近の値は勢いの低下またはレンジ
Fair Value Gap Volume Profile Pro This indicator detects price imbalances (Fair Value Gaps) on the chart and displays the volume distribution inside each gap using data from a lower timeframe. It is designed for traders who use institutional price action concepts and want to understand where volume was concentrated during the formation of each gap. What is a Fair Value Gap A Fair Value Gap (FVG) is a three-candle price imbalance where a candle moves so strongly that it leaves a range untouched
プロフェッショナル・マルチタイムフレーム監視インジケーター 製品説明 Scanner 3 do Movimento は、MetaTrader 5 用に開発されたインジケーターで、11種類のタイムフレームを同時に監視し、特定の3本ローソク足反転パターンを自動検出します。 このインジケーターを使用することで、複数のチャートを手動で切り替える必要がなくなります。すべての情報がMT5画面上の1つのパネルに表示されます。 動作原理 ローソク足パターン インジケーターは、3本連続したローソク足で構成されるパターンを検出します。 BUY(買い)シグナル ローソク足 色 条件 1本目(最も古い) 赤 反転の基準 2本目(中央) 緑 1本目より安値が低い 3本目(最新) 緑 2本目より高値が高い SELL(売り)シグナル ローソク足 色 条件 1本目(最も古い) 緑 反転の基準 2本目(中央) 赤 1本目より高値が高い 3本目(最新) 赤 2本目より安値が低い 実際の動作 インジケーターは以下のすべてのタイムフレームを同時に分析します: (M1、M2、M3
Heiken Ashi Stacked Pro is a chart overlay indicator that combines smooth Heiken Ashi visual trend candles, a real-time bar completion timer, and an on-hover crosshair HUD for instant price and wick-to-body ratio diagnostics. Marketplace Description Overview Heiken Ashi Stacked Pro upgrades standard Heiken Ashi candle visuals with an interactive HUD. Designed for trend followers and price action traders, it filters out market noise using colored candles while supplying precise candle metric read
The Exclusivissimo FAB4 (Fabulous Four) Indicator is an institutional-grade chart analysis tool designed for MetaTrader 5. Built for professional traders who demand precision, this indicator automatically maps the most critical liquidity zones and momentum shifts in the market, keeping your chart clean and your entries surgical. Whether you are trading Forex, Indices, or Stocks, the FAB4 Indicator provides a complete institutional roadmap right on your screen, highlighting true market intent wit
重要なお知らせ – ライセンスとアクティベーションが必要です ======================================================== アクティベーション手順: ご購入完了後、直ちに当社までご連絡いただき、ライセンスキー、パスワード、またはアクティベーション詳細をお受け取りください。これらがないとソフトウェアは動作しません。スムーズなアクティベーションプロセスを保証し、ご質問にお答えいたします。 --- Volume Delta Profile V2 Enhanced ================================ プロフェッショナルな出来高・デルタ分析ツール -------------------------------------------- 概要 ---- **Volume Delta Profile** は、従来の出来高プロファイル分析と高度なデルタおよびインバランス検出を組み合わせたプロフェッショナルグレードの分析ツールです。この総合的なインジケーターは、トレーダーに市場ダイナミクスの詳細なビュ
Description The indicator uses market profile theory to show the most relevant trading zones, on a daily basis. The zones to be shown are LVN (low volume nodes) and POC (point of control). An LVN zone is one which represents price areas with the least time or volume throughout the day. Typically, these areas indicate a supply or demand initiative, and in the future, they can turn into important breakout or retracement zones. A POC zone is one which represents price areas with the most time or vo
Delta + CVD & CVD Candles Order-flow indicator combining Delta (Ask–Bid), Cumulative Volume Delta (CVD), and a unique CVD-based synthetic candle system. Shows buy/sell pressure, volume aggressiveness, and momentum shifts with optional Delta histogram, CVD line, and CVD+Delta combined candles. Useful for scalping, intraday trading, divergence detection, and understanding buyer/seller dominance. Overview The Delta + CVD & CVD Candles Indicator combines multiple order-flow tools into one clean
Overview Heiken Ashi CE Filtered MT5 is a technical indicator for the MetaTrader 5 platform. It integrates smoothed candlestick charting with a dynamic exit strategy and a customizable trend filter to deliver clear buy and sell signals. The indicator is designed to improve trend detection and signal reliability by reducing market noise. If you want to see more high-quality products or order the development/conversion of your own products, visit my partners' website: 4xDev Get 10% OFF on manual
Launch price: 30 USD - price will increase after the first purchases, so early buyers lock in this rate. Smart Volume Zone marks the trading candle with the highest tick volume within the last N trading days (configurable, default 10) and highlights it directly in the terminal's native Volumes panel, with no separate window and no third-party dependency. How it works: the indicator scans every M1 candle within each of the last N days, finds the single highest-volume candle per day, then compar
Features 3 types of waves: bullish, bearish and unknown. The unknown tower comes when prices move in opposite the direction of the current tower. Label that shows the percentage remaining for the next tower. Allows you set the type of volume that will be accumulated in the towers, either real or tick volumes. Thus, the indicator works in any market, for example: stocks, futures, forex, commodities, etc. Allows you to set the required score for the tower exchange. Allows you to set the font size
Before installing the HeatMap indicator make sure you are using a broker that gives you access to the Depth of market (DOM) !! This indicator creates a heatmap on your chart allowing you to see the buy or sell limit orders easily and in real time. You have the possibility to change the setting and the colors of the HeatMap in order to adapt to all markets and all charts. Here is an example of a setting you can use with the NASDAQ100 on the AMPGlobal broker :  https://www.youtube.com/watch?v=x0Y
There are no limits! Golden Limit is the ultimate indicator to get clear and easy readings of price movements on charts. It projects support and resistance ranges, calculated by statistical models involving Price Action and the Fibonacci sequence, revealing in advance the behavior of prices and the best places to trade and not to trade. It also has two moving averages to help choose the best entries. The Golden Limit method was created from a proven model. In summary: We use the names of precio
Tape Reading, flow monitoring. FabFlowInPrice   is a powerful indicator for those who like Tape Reading (Times & Trades). It presents the volumes traded at each price level, considering the purchase, sale and direct aggressions for each level. Excellent tool for market flow analysis. Thought of flow so monitor who is attacking the most, buyers, sellers or direct exchanges, thought FabFlowInPrice. The indicator displays information in 4 distinct and fixed periods, on any timeframe: @Day - All t
TrendOnCloseは、特定のローソク足サイクル内のトレンドとカウンター トレンドの統計分析に焦点を当てた、バイナリー市場投資家向けの高度 なインディケータです。 各サイクル は、ローソク足の終値によって定義され、次のサイクルが始まるまでの間、トレン ド方向(UP/DOWN - BULL/BEAR)を確立します。統計分析は2つの構成で行われます: ⦁ SUBSEQUENT CANDLEとしての統計目標: アルゴリズムは、サイクル内の後続のローソク足に焦点を当てます。 ⦁ INTERCYCLESとしての統計ゴール: アルゴリズムは、各サイクル間のすべてのローソク足を考慮する。 選択された統計目標に基づき、各ローソク足のトレンドがCYCLEローソク足のトレンドと比較され、同一方向の場合はTREND-Percent(TD)とTrend-Occurrences(N-TD)が増加し、トレンドが乖離している場合はCOUNTER-TREND(CTとN-CT)が増加します。さらに、このインジケータは、日足、週足、月足の統計的な合計を提供し、これらの期間中、各サイクル の「トレンド」または「
重要なお知らせ – ライセンスとアクティベーションが必要です アクティベーション手順: 購入が完了したら、すぐに弊社にご連絡いただき、ライセンスキー、パスワード、またはアクティベーションの詳細をお受け取りください。これらがなければ、ソフトウェアは動作しません。スムーズなアクティベーションプロセスを保証し、どんなご質問にもお答えするために私たちがサポートいたします。 多言語カスタマイズ トレーディング体験を向上させるため、ソフトウェアを複数の言語で完全にカスタマイズするサービスを提供しています。弊社のチームは以下の言語で翻訳をご用意できます: 中国語 | フランス語 | ポルトガル語 | スペイン語 | ロシア語 日本語 | ドイツ語 | 韓国語 | イタリア語 | トルコ語 ご希望の言語をお知らせいただければ、ユーザーフレンドリーな体験を保証するため、インジケーターをカスタマイズいたします。 ボリュームプロファイル – 高度な市場分析ツール ボリュームプロファイルは、トレーダーに市場のダイナミクスに
O Touch VWAP é um indicador que permite calcular uma Média Ponderada por Volume (VWAP) apenas apertando a tecla 'w' no seu teclado e após clicando no candle do qual deseja realizar o calculo, clicando abaixo do candle é calculada a VWAP baseado na minima dos preços com o volume, clicando sobre o corpo do candle é calculado uma VWAP sobre o preço medio com o volume e clicando acima do candle é calculado uma VWAP baseado na máxima dos preços com o volume, voce tambem tem a opção de remover a VWAP
Smart Market Structure Simple is a powerful indicator that helps traders identify market structure based on the Smart Money Concept (SMC) . This indicator automatically detects Break of Structure (BOS), Change of Character (CHoCH), Fair Value Gaps (FVG), Order Blocks (OB), Liquidity Zones (LQZ), and key swing points Higher High (HH), Higher Low (HL), Lower High (LH), Lower Low (LL) . Main Objective: Assist traders in tracking institutional flow ( Smart Money ) and finding high-probability trade
SmartFVG Mapper
Muhamad Syafiq Bin Khairuddin
Product Description Automate Your Smart Money Concepts (SMC) & ICT Trading. Manually drawing Fair Value Gaps (FVGs) and Order Blocks across multiple charts causes visual fatigue and missed entries. SmartFVG Mapper Pro is a surgical, institutional-grade indicator that automatically detects, draws, and manages true market imbalances. Built for precision scalpers and prop firm traders, this indicator doesn't just draw boxes blindly. It features a proprietary Mitigation Engine that instantly deletes
Master HMA
Leonel Alberto Jose Quintana
MetaTrader 5 用 Master HMA Master HMA は、MetaTrader 5 向けに開発されたテクニカルインジケーターで、複数の Hull Moving Average の計算を1つのビジュアル構造に統合し、価格の方向性、傾き、値動きの状態を分析するために設計されています。 このインジケーターは Fast、Main、Slow の3つの HMA 期間を使用します。これらのラインの関係を見ることで、値動きの構造変化を確認し、市場のさまざまな局面を追跡できます。 Main HMA は、システムが判定した状態に応じて異なる色で表示されます。また、Fast HMA と Slow HMA の関係によって形成されるクラウドを表示することもできます。 構造分析 Master HMA は、移動平均線の挙動に関するさまざまな特徴を分析します。これには、傾き、HMA 間の距離、収縮、拡大、加速、勢いの低下、クラウド幅の変化などが含まれます。 これらの情報を組み合わせることで、現在の値動きの構造を視覚的に把握できます。 Master Score このインジケーターには Master
Segmented Volume MT5
Eduardo Da Costa Custodio Santos
MT5セグメント化ボリュームインジケーターは、価格とボリュームの分析、VSA、VPA、ワイコフメソッド、スマートマネーシステムを使用して取引する人を容易にするために作成されました。 セグメント化されたボリュームは、任意の市場(暗号、CFD、外国為替、先物、株式など)で機能し、任意のチャート時間で機能します。 解釈がいかに簡単かをご覧ください。 #緑:市場平均よりもはるかに多いボリューム #濃いピンク:平均よりも大きいボリューム #青:正の通常の音量 #赤:マイナスの通常の音量 #ピンク:少量 #黄色:超少量 MT5セグメント化ボリュームインジケーターは、ティックボリュームまたはリアルボリュームで使用できます。 それはあなたの意思決定を容易にするスマートマネーの動きを読むのに役立ちます。
LT Support Resistance - サポート&レジスタンスを100%自動で識別 手動でサポートラインやレジスタンスラインを引く作業に、時間を取られて疲れていませんか?あるいは、重要なレベルをいつも見落としてしまい、悔しい思いをしていませんか?LT Support Resistanceは、そのような煩わしい作業をなくすために開発されました。複数のタイムフレーム(時間足)を同時に分析し、取引しているアセットの最も重要なゾーンを自動的に識別してチャート上に描画します。 == 重要レベルのスマート自動化 == 主観的で時間の Gann(ガン)かかる手動のライン引きとは異なり、このインジケーターは価格の履歴を分析し、重要な反転ポイントを特定して、価格が「実際に」意識しているサポート・レジスタンスラインを描画します。その結果、客観的で素早い、データに基づいた分析が可能になります。 == 主な特徴 == 100% 自動検出: 手動による分析なしでサポート/レジスタンスを識別 マルチタイムフレーム (MTF): M5(5分足)チャート上に、H1、H4、D1、W1のレベルを同時に表示可能 ス
Warlock Signal Liquidity Reaper Dashboard v1.2 は、 MetaTrader 5 専用のプロフェッショナルなマルチタイムフレーム信号インジケーターです。当社の Gold Liquidity Reaper Pro EA シリーズと同じ機関投資家の手法に基づいて設計されており、週足のマクロトレンドから5分足の精密なエントリーまで、市場の全体像を一目で把握することができます。 一言で言うと 6つのタイムフレームを同時に読み取り、それぞれを 強気(BULLISH) 、 弱気(BEARISH) 、または 中立(NEUTRAL) としてスコアリングします。十分な一致が見られた場合、エントリー価格、ストップロス、テイクプロフィットを含む完全な ICT トレードセットアップをチャート上に直接生成します。 6タイムフレーム・バイアスパネル パネルの上部には、各主要タイムフレームの方向性のバイアスがリアルタイムで表示されます。 W1 — 週足(最高マクロバイアス): 機関投資家の方向性を示します。価格が週足EMA200の上にあるか下にあるかで、市場が構造的な強
️ Candle Timer Advanced Suite for MetaTrader 5 Gain the ultimate edge in precision timing with the Candle Timer Advanced Suite. This is not just a simple countdown; it is a professional-grade analytical tool designed to keep you perfectly synchronized with the market, ensuring you never miss a critical entry or exit due to server lag or misinterpretation. Built specifically for MetaTrader 5, this suite offers unparalleled flexibility, allowing you to visualize time exactly how you need it, acr
This indicator allows you to enjoy the two most popular products for analyzing request volumes and market deals at a favorable price: Actual Depth of Market Chart Actual Tick Footprint Volume Chart This product combines the power of both indicators and is provided as a single file. The functionality of Actual COMBO Depth of Market AND Tick Volume Chart is fully identical to the original indicators. You will enjoy the power of these two products combined into the single super-indicator! Below is
CVD SmoothFlow Pro
Thalles Nascimento De Carvalho
CVD SmoothFlow Pro - すべての資産に対応した無制限のボリューム分析! CVD SmoothFlow Pro は、精密で無制限のボリューム分析を求めるトレーダーに最適なソリューションです。Cumulative Volume Delta(CVD)の計算と高度なノイズフィルタリングを使用することで、プロ版はあらゆる金融資産の取引に必要な柔軟性と精度を提供します。 CVD SmoothFlow Pro が提供するもの: クリアな分析 :ノイズをフィルタリングし、すべての金融資産における重要なボリュームの動きを際立たせます。 ️ 正確な計算 :買いと売りの差を監視し、外為、インデックス、暗号通貨などの資産におけるボリュームの詳細な動きを提供します。 直感的なインターフェース :データの表示が明確で、分析がわかりやすく効率的です。 トレンドの特定 :市場のトレンドを自信を持って特定し、情報に基づいた意思決定をサポートします。 実用的な用途: リアルタイムで任意の資産における買い手と売り手のバランスを監視します。 ボリュームに基づいてトレンドの反転
SMART ATR GRID PRO++ – Adaptive Grid Intelligence Suite is a next-generation, institutional-grade grid trading indicator engineered for traders who demand precision, adaptability, and comprehensive market structure analysis. By seamlessly integrating   Adaptive Volatility Grid System ,   KAMA Candle Trend Filtering ,   Multi-Factor Trend Detection (ADX + EMA20/50) ,   Dynamic Heatmap Zone Engine , and   Real-Time Market Regime Classification , this indicator delivers a complete decision-making
Indicator Name: Fibaction – price action candle Detector Description: Fibo Signal Boxes is a powerful Smart Money Concept (SMC)-inspired indicator that auto-detects price action candles. bullish hammers and shooting stars, then draws precise Fibonacci entry zones and multiple take-profit levels directly on the chart. as for the SL personally i use 40 pips rules  Key Features: Detects bullish hammer and shooting star reversal candles. Automatically draws Fibonacci entry and TP boxes. as
Automatic Support & Resistance zones for MetaTrader 5 — confirmed by real price action, not just the nearest line. Tenet Support & Resistance Pro scans D1, H4, H1, M15, M5 and M1 price history and plots the key support and resistance levels for you. Instead of simply highlighting whichever line sits closest to price, it checks how many times price has actually tested a level in recent candles before confirming it as the current trading zone — so you're not reacting to a level the market never re
Launch price: 30 USD - price will increase after the first purchases, so early buyers lock in this rate. Multi Anchor VWAP lets you place a Volume Weighted Average Price line starting from any candle you choose, instead of only resetting automatically at the start of a session, day, week or month. How it works: press the H or L button, then click the candle you want to anchor to, or use the Up and Down arrow keys to move to it and confirm with Enter. The VWAP line starts exactly at that candle
このプロダクトを購入した人は以下も購入しています
Trend Sniper X
Sarvarbek Abduvoxobov
4.9 (41)
Trend Sniper X は、トレードの方向性と潜在的な反転ポイントを明確かつ正確に特定するのに役立つ、MetaTrader 5 用のマルチタイムフレーム・トレンドフォロー指標です。 MT4用: https://www.mql5.com/en/market/product/193245 価格情報: 現在の価格はプロモーション価格であり、今後のアップデートや新機能のリリースに伴い変更される場合があります。 ボーナス特典: このインジケーター用の無料自動売買アシスタントEAを入手するには、購入後に an 著者(開発者)へメッセージをお送りください。 Code2Profit チャンネル マルチタイムフレーム分析で相場をマスターしよう! Trend Sniper X で勝率を最大化する方法:重要なルールとセッションのコツ 技術仕様 プラットフォーム MetaTrader 5 インジケータータイプ マルチタイムフレーム・トレンドインジケーター 操作タイムフレーム あらゆるチャートタイムフレームに対応。個別に選択可能な上位タイムフレーム (M1–MN1) を搭載 主要銘柄 FX、ゴールド (X
Smart Trend Trading System — MetaTrader 5 ご購入後、MQL5で私にメッセージをお送りいただくと、Smart Universal Expert Advisorを無料で受け取れるほか、オンライン講座、PDFマニュアル、非公開グループへのアクセスもご利用いただけます。 STTSは、トレンドの方向、エントリー・決済シグナル、反転ゾーン、重要な価格水準をチャート上にまとめて表示します。システムを参考に手動で取引することも、別の対応EAを接続し、ご自身で選んだ設定に基づいて自動売買することもできます。 ひとつのシステム、4つのトレードアプローチ STTSのトレードアプローチは、大きく4つのカテゴリーに分かれています。 • スキャルピング — 短期的なシグナルや相場の動きを捉えます。 • トレンドトレード — 方向性を評価し、トレンド内の機会を探します。 • 反転トレード — 反転の可能性があるゾーンや方向の変化を見つけます。 • 出来高トレード — 出来高に基づく情報を使い、市場の活発さを評価します。 エントリー・決済の矢印、トレンド情報、サポート・
SuperScalp Pro
Van Minh Nguyen
4.56 (36)
SuperScalp Pro - Professional Multi-Layer Confluence Scalping System SuperScalp Proは、クラシックなSupertrendに複数のインテリジェントな確認フィルターを追加した、高度なスキャルピングインジケーターです。より高い確率が期待できるBuy/Sellの取引機会を特定し、ダマシのシグナルを大幅に減らすことをサポートします。 明確なBuyとSellの矢印がチャート上に直接表示され、ATRに基づくStop LossとTake Profitのレベルがリアルタイムで自動計算されます。 購入後、設定方法や推奨設定についてのサポートが必要な場合は、私にご連絡ください。 SuperScalp Pro Auto Traderを使用して、シグナルを簡単に自動化できます: [Auto Trader] 推奨設定ファイルをダウンロード: [Set File] 完全なドキュメントは製品ブログでご覧いただけます: [User Guide] 最新情報を受け取るには公式チャンネルに参加してください: [Official Channel]
新たな王者が登場 - インジケーター + 注文管理表示(TP1 + TP2 + TP3)+ オプションのTelegramシグナル送信機能付き(無料) (完全なトレード&シグナルシステム) ゴールド向け最高のEA: Gold Slayer このインジケーターには、高度な戦略、カスタマイズ可能な注文管理システム、そしてエンベロープ拡張を組み合わせた平均回帰システムが搭載されています。さらに、RSIなど複数のインテリジェントな確認フィルターによって、高確率の反転エントリーをBUY・SELLシグナルとして検出します。 単にトレードを学ぶだけでなく、複数ポジションを効果的に管理し、過去に利益を出しているオープンポジションで損失トレードをカバーする方法も学べます。 M5向けに構築・最適化されており、流動性が高くシグナルの精度が安定しているBTCUSDとXAUUSDで優れたパフォーマンスを発揮します。 このインジケーターは、ATRを基に自動計算されたエントリー、ストップロス、テイクプロフィットレベルを備えた明確なLong・Shortシグナルを提供するため、リスク管理が最初から組み込まれています。 マ
SMC Intraday Formula
VividMind Digital Solutions
5 (26)
まず正直に言いましょう。 どんなインジケーターも、それ単体であなたを利益化させることはできません。もしそう言う人がいるなら、それは夢を売っているだけです。完璧な売買シグナル(矢印)を表示するインジケーターは、いくらでも“完璧に見せる”ことができます。正しい過去の区間を拡大して、勝ちトレードだけを切り取ればいいだけです。私たちはそれをしません。 SMC Intraday Formula はツールです。 市場構造を読み取り、最も高い確率の価格ゾーンを特定し、今この瞬間のスマートマネーの痕跡をシンプルな言葉で正確に示します。最終判断はあなたが行います。トレードを実行するのもあなたです。しかし今は「希望」ではなく「精度」でエントリーできます。 私たちはこのインジケーターを、ゴールド(XAUUSD)および主要FX通貨ペアで約3年間、日々のスキャルピングに使用してきました。M1、M5、M15、M30の主要ツールです。これは未来を予測しようとするのではなく、今まさに形成されている高確率セットアップを示し、その理由を説明します。 他のすべてのインジケーターと何が違うのか? ほとんどのトレーディングイ
伝説が帰ってきました:Entry Points Pro 10。 MQL5 Marketのトップ3に3年間入り続けた伝説的インジケーターの再始動です。 2つのバージョンで合計589件の高評価レビュー、毎日数千人のトレーダーが実際のトレードに使用し、デモのダウンロードは31,000件以上   MT4+MT5 。 私はこの5年間に寄せられたレビューをすべて読み、約束を並べる代わりに、その答えをバージョン10に組み込みました。1999年から相場に携わり、 誠実さ、自らの評判、そして顧客を大切にする 作者による製品です。 Entry Points Proのエントリーシグナルは、リペイント(再描画)を一切行いません。 そして今回初めて、これは作者の言葉ではなく検証可能な事実になりました。確定シグナルはローソク足の終値確定後にのみ表示され、自動テストで リペイントはゼロ と確認されています(EURUSD、XAUUSD、BTCUSDで2,486,568回の不変条件チェック、違反0件)。検証方法は公開されており、ストラテジーテスターでご自身で再現できます。 ご購入後は、必ずすぐにダイレクトメッセージでご
Neuro Poseidon is a new indicator by Daria Rezueva. It combines precise trading signals with adaptive TP/SL levels - creating best possible trades as a result! Message me and get  Neuro Poseidon Assistant  as a gift to automize your trading process! What makes it stand out? 1. Proven profitability on all assets and timeframes 2. Only confirmed BUY and SELL signals present on the chart 3. Adaptive TP & SL levels generated by the software for each trade 4. Easy to understand - suitable for al
あなたのトレード優位性を視界に入れよう! M5 Sniper は MeanFX による新しいインジケーターです。 正確なトレードシグナル と 適応型TP/SLレベル を組み合わせることで、結果として可能な限り最高の統計的トレードを実現します! 5回購入されるごとに価格が上昇し、次の価格は69$です 購入後に私にメッセージを送っていただければ、ヒント/ガイドとボーナスEAをお受け取りいただけます 何が他と違うのでしょうか? Gold XAUUSDにおける 実証済みの統計的パフォーマンス ( ほぼすべてのアセットで機能します 。一貫した結果が得られないまま何でも扱おうとするのではなく、1つの時間足をマスターすることに重点を置いています) 1日あたり1~8回のトレード を各シンボルで実行し、高い勝率と、すべての統計的優位性をこちら側に持つことができます チャート上には 確認済みの BUYおよびSELLシグナルのみを表示 適応型TPおよびSLレベル を各トレードごとにインジケーターが生成 平均Winrate 75%+ 平均 Signal Ratio 最低1.1+ アラーム と通知を 携帯電話
Adaptive Price Action Engine インジケーターを購入すると、EAが無料に マルチタイムフレーム対応・自己最適化トレンド&ローソク足パターン分析 市場環境は常に変化しており、すべてのPrice Actionパターンが、あらゆる市場環境で同じ価値を持つわけではありません。 Adaptive Price Action Engine は、変化する市場環境への適応を目的として、 トレンド構造、マルチタイムフレーム分析、ローソク足パターン、統計的最適化 を1つの分析フレームワークに統合しています。 2つのアダプティブモード Dual Alpha Trend Mode 低い時間足と高い時間足のAlpha Trendパラメータを自動的に探索し、直近の市場動向に合わせてトレンド判定を適応させます。 Candlestick + Alpha Mode Alpha Trendによる市場レジーム判定と、 22種類の強気・弱気ローソク足パターン を組み合わせます。すべてのパターンを同じように扱うのではなく、さまざまなパターンの組み合わせを統計的に評価し、選択された市場環境において過去
M1 SNIPER は使いやすいトレーディングインジケーターシステムです。M1時間足向けに設計された矢印インジケーターです。M1時間足でのスキャルピングのためのスタンドアロンシステムとして、また既存のトレーディングシステムの一部としても使用できます。このトレーディングシステムはM1時間足での取引に特化して設計されていますが、他の時間足でも使用できます。元々、この手法はXAUUSDとBTCUSDの取引用に設計しましたが、他の市場においても役立つと考えています。 インジケーターのシグナルは、トレンドの方向と逆方向に取引できます。インジケーターのシグナルを利用して両方向に取引するのに役立つ特別な取引テクニックをご紹介します。この手法は、特別な動的なサポートとレジスタンスの価格帯を利用することに基づいています。 ご購入後、M1 SNIPER矢印インジケーターをすぐにダウンロードできます。さらに、M1 SNIPERツールのすべてのユーザーに、以下のスクリーンショットに表示されているApollo Dynamic SRインジケーターを無料で提供しています。この2つのインジケーターを組み合わせることで
Gann Made Easy   は、ミスター・ギャンの理論を使用した取引の最良の原則に基づいた、プロフェッショナルで使いやすい外国為替取引システムです。 W・D・ガン。このインジケーターは、ストップロスとテイクプロフィットレベルを含む正確な買いと売りのシグナルを提供します。 PUSH通知を利用して外出先でも取引可能です。 ご購入後、取引方法の説明と優れた追加インジケーターを無料で入手するには、私にご連絡ください! おそらく、ギャンの取引手法についてはすでに何度も聞いたことがあるでしょう。通常、ギャンの理論は初心者のトレーダーだけでなく、すでにある程度の取引経験がある人にとっても非常に複雑なものです。なぜなら、ギャンの取引手法は理論的にはそれほど簡単に適用できるものではないからです。私はその知識を磨き、最良の原則を私の外国為替インジケーターに組み込むために数年を費やしました。 このインジケーターは非常に簡単に適用できます。必要なのは、それをチャートに添付し、簡単な取引推奨事項に従うだけです。このインジケーターは常に市場分析の仕事を行い、取引の機会を探します。適切なエントリーポイントを検
Auto Optimized SpeedAngle は、継続的なウォークフォワード最適化(WFO:Walk-Forward Optimization)によりカーブフィッティング(過剰最適化)を排除した、機関投資家レベルのモメンタムベクトルシステムです。市場レジームの変化時に効果が低下する静的な入力に依存せず、アウトオブサンプル(OOS)検証を用いてパラメーターを動的に再キャリブレーションすることで、表示されるシグナルが単なる過去の偶然ではなく、確実な統計的優位性に基づいていることを保証します。 主な機関投資家向けフレームワーク ウォークフォワード最適化エンジン: ルックバック期間やしきい値の数千に及ぶ組み合わせを継続的にスキャンし、データをインサンプルとアウトオブサンプルに厳格に分離します。未検証のデータ環境において数学的優位性が証明された場合にのみ、新しいパラメーター設定を採用します。 定量的目的関数: 単なる純利益の追求ではなく、機関投資家レベルの安定性指標をターゲットとします。システム品質ナンバー(SQN)、期待値(1トレードあたりの平均Rマルチプル)、またはネットRの最適化を選
ARIPoint
Temirlan Kdyrkhan
1 (4)
ARIPoint is a powerful trading companion designed to generate high-probability entry signals with dynamic TP/SL/DP levels based on volatility. Built-in performance tracking shows win/loss stats, PP1/PP2 hits, and success rates all updated live. Key Features: Buy/Sell signals with adaptive volatility bands Real-time TP/SL/DP levels based on ATR Built-in MA Filter with optional ATR/StdDev volatility Performance stats panel (Success, Profit/Loss, PP1/PP2) Alerts via popup, sound, push, or email Cu
「Scalper Vault」は、デイトレードで安定した成果を目指すトレーダーのために設計された、強力かつ充実した機能を備えたトレーディングシステムです。 この高精度なインジケーターは、それ単体で完結するトレーディングシステムとして機能し、FXやバイナリーオプションのトレーダーに、機関投資家レベルの分析を提供します。 ご購入後、ぜひご連絡ください。 トレードのヒントに加え、豪華なボーナスをプレゼントいたします! 「Scalper Vault」を活用すれば、勘に頼った判断や複雑な手動分析は不要です。使いやすいトレード手法に集中し、純粋に「エントリー・決済」という実行フェーズに専念できます。 高精度なトレンドフォロー・シグナル:中核となるアルゴリズムが市場構造を分析し、主要なトレンド方向に沿った高確率なシグナルを提示します。これにより、誤ったエントリーを大幅に削減できます。 精度の高い天井・底の検知:市場の勢いが尽きたポイントをスキャンし、反転の可能性が高いゾーンを特定します。 ギャン(Gann)理論に基づく売買ゾーン:数学的な「ギャン・レベル」を自動的にチャート上に描画します。機関投資
Tokyo Indicatorは、トレンドの方向性、潜在的な取引シグナル、および市場状況を視覚的に分かりやすく表示します。 色分けされた階段状のトレンドラインにより、強気局面(青色)と弱気局面(マゼンタ色)が明確に区別されます。トレンドの変化に合わせて表示される方向矢印は、売買の好機を強調します。 統合されたダッシュボードには、現在のシグナル、市場のバイアス(傾向)、モメンタム、ボラティリティ、シグナルの品質がひと目で分かるようにまとめられています。これにより、トレーダーはパネルを切り替えることなく、価格変動(プライスアクション)とインジケーターの数値を照らし合わせて分析を行うことができます。 すっきりとしたチャート表示と簡潔な市場概要により、Tokyo Indicatorはトレンド分析や取引判断における体系的なアプローチをサポートします。 あらゆる時間足や銘柄に対応しており、特に金(ゴールド)の取引に適しています。 トレンド スキャナーの強力なサポートを利用して、無料のインジケーターを入手し、プライバシーを守ります。あーみー!     設定 ShowHUD - チャート上のパネ
Entry In The Zone and SMC Multi Timeframe is a real-time market analysis tool based on Smart Money Concepts (SMC), designed to analyze market structure, price direction, and key trading zones. It supports both Single-Timeframe and Multi-Timeframe Analysis, providing a clearer view of overall market structure across multiple timeframes, with real-time BUY / SELL signals designed with a strict focus on No-Repaint principles. The signals are designed to help filter unclear setups and evaluate tradi
トレンドキャッチャーインジケーター トレンドキャッチャーインジケーターは、開発者独自の適応型トレンド分析指標を組み合わせることで、市場価格の動きを分析します。短期的なノイズを除去し、根底にあるモメンタムの強さ、ボラティリティの拡大、価格構造の挙動に焦点を当てることで、真の市場方向性を特定します。また、移動平均線、RSI、ボラティリティフィルターなどの平滑化およびトレンドフィルタリング機能を備えたカスタマイズ指標も使用します。 実際の運用状況のモニタリングやその他の製品については、こちらをご覧ください: https://www.mql5.com/en/users/mechanic/seller ご注意ください。私はTelegramでEAや設定を販売していません。詐欺です。すべての設定はブログで無料で公開しています。 重要!ご購入後すぐにご連絡ください。手順とボーナスをお送りします!
トレーダーの皆さん、こんにちは! 多くの個人トレーダーは、動作の遅いウェブスクリプトに頼っています。真の収益性を実現するには、体系化されたフレームワークが必要です。 Astro AIインジケーターは、一般的なチャートオーバーレイではありません。これは、ターミナル上で直接動作する2つのエージェントを含む、コンパイル済みのニューラルネットワークです。 システムの具体的な技術は以下のとおりです。 1. エージェント1:アナリスト(グラフィカルニューラルネットワーク - GNN) 市場は孤立した価格バーではなく、相互に連結されたデータネットワークです。 機能:エージェント1は、グラフィカルニューラルネットワークを使用して、これらの複雑で非線形な関係をマッピングします。 利点:一般的なインジケーターは過去の移動平均しか考慮しませんが、当社のGNNは市場の深い構造的関係をリアルタイムで処理し、個人トレーダーの取引量が大きな影響を与える前に、隠れた相関関係を明らかにします。 2. エージェント2:エグゼキューター(近接戦略最適化 - PPO) パターン認識は、戦いの半分に過ぎません
このインジケーターを購入された方には、以下の特典を 無料 で提供しています: 各トレードを自動で管理し、ストップロスとテイクプロフィットを設定し、戦略ルールに基づいてポジションを決済する補助ツール 「Bomber Utility」 様々な銘柄に合わせたインジケーターの設定ファイル(セットファイル) 「最小リスク」、「バランスリスク」、「待機戦略」 の3つのモードで使用できる Bomber Utility 用の設定ファイル このトレーディング戦略をすぐに導入・設定・開始できる ステップバイステップのビデオマニュアル ご注意: 上記の特典を受け取るには、MQL5のプライベートメッセージシステムを通じて販売者にご連絡ください。 オリジナルのカスタムインジケーター 「Divergence Bomber(ダイバージェンス・ボンバー)」 をご紹介します。これは、MACDのダイバージェンス(乖離)戦略に基づいた 「オールインワン」型のトレーディングシステム です。 このテクニカルインジケーターの主な目的は、価格とMACDインジケーターの間に発生するダイバージェンスを検出 し、将来の価格の動きを示
Unix Scalper — MetaTrader 5 ご購入後、MQL5で私にメッセージをお送りいただくと、Smart Universal Expert Advisorを無料で受け取れるほか、オンライン講座、PDFマニュアル、非公開グループへのアクセスもご利用いただけます。 セットアップを見つけ、取引プランを確認し、取引方法を選ぶ。 UNIX Scalperは、市場分析、BUY/SELL/WAITの判断、Entry、Stop Loss、TP1、TP2の水準を、見やすいパネルにまとめています。 シグナルと取引プランを確認 • 明確な判断:BUY、SELL、WAIT。 • 明示された水準:Entry、Stop Loss、TP1、TP2。 • 複数時間足の一覧:パネル上で各時間足のシグナルを比較。 • 判断を支える分析:トレンド、モメンタム、出来高、ボラティリティ、サポートとレジスタンス、市場の質。 • 選べるレイアウト:Minimized、Compact、Standard、Full。 シグナルと各水準を確認し、そのセットアップがご自身の取引ルールに合うか判断してください。 ゴール
PainX GainX Blue Spike Fusion AI Advanced Synthetic Index Spike Detection Indicator for MetaTrader 5 Discover potential spike setups with a clear, organized, and professional trading interface. PainX GainX Blue Spike Fusion AI is a specialized indicator designed for traders who monitor synthetic indices and want a structured way to observe potential price spike opportunities. The indicator combines signal monitoring, market-condition analysis, visual alerts, and event tracking in one convenient
Volatility Master for MetaTrader is a real-time dashboard tool that scans up to  50 symbols  to identify high-volatility , trending markets instantly. With bullish/bearish signals, customizable alerts, and a user-friendly interface, it helps you avoid range-bound conditions and focus on high-probability trades. Clarity leads to confidence. Trade confidently and protect your capital effectively with this powerful dashboard. We don't offer free or bonus indicators in exchange of reviews from you.
Quantum TrendPulse を ご紹介します。これは、   SuperTrend   、   RSI   、および Stochastic のパワーを 1 つの包括的なインジケーターに組み合わせて、取引の可能性を最大限に引き出す究極の取引ツールです。精度と効率を求めるトレーダー向けに設計されたこのインジケーターは、市場のトレンド、勢いの変化、最適なエントリー ポイントとエグジット ポイントを自信を持って特定するのに役立ちます。 主な特徴: SuperTrend 統合: 現在の市場動向に簡単に追従し、収益性の波に乗ることができます。 RSI精度: 買われすぎと売られすぎのレベルを検出し、市場の反転のタイミングに最適で、SuperTrendのフィルターとして使用されます。 確率的精度: 確率的振動を活用して、変動の激しい市場で隠れたチャンスを見つけます。SuperTrend のフィルターとして使用されます。 マルチタイムフレーム分析:   M5 から H1 または H4 まで、さまざまなタイムフレームで市場を常に把握します。 カスタマイズ可能なアラート: カスタム取引条件が満たされ
Atomic Analyst — MetaTrader 5 ご購入後、MQL5で私にメッセージをお送りいただくと、Smart Universal Expert Advisorを無料で受け取れるほか、オンライン講座、PDFマニュアル、非公開グループへのアクセスもご利用いただけます。 Atomic Analystは、プライスアクション、トレンドの方向、エントリー・決済シグナル、損切り水準、複数の利確水準をチャート上にまとめて表示します。 シグナルを確認し、取引の状況を理解する Atomic Analystは、分析結果をわかりやすい視覚情報として表示します。 • エントリーの候補を見つけるための買い・売りの矢印。 • 取引計画に役立つ損切り水準と複数の利確水準。 • 市場の方向性を評価するトレンド、強さ、モメンタムの指標。 • より広い市場背景を比較する複数時間足の分析。 • 変化する状況を追うための色分けされたローソク足とアラート。 シグナルと補助分析を併せて確認し、その取引機会がご自身のルールに合うかを判断してください。 短期の取引機会から、より大きな値動きまで Atomic A
FiboSniper Pro – Multi-Filter Fibonacci System with Auto SL/TP and Control Panel FiboSniper Proは、動的なFibonacci Envelopesと複数の確認フィルターを組み合わせ、選別されたBuyおよびSellシグナルを生成するテクニカルインジケーターです。FibonacciレベルはMoving AverageとATRを基に計算され、その後ADX、EMA、RSI、ATR、Volume、Time、Candle構造によってフィルタリングされます。インジケーターは、ATRに基づく自動Stop LossおよびTake Profitレベルをチャート上に直接表示し、さらに迅速な調整が可能なインタラクティブControl Panelを提供します。 購入後、推奨設定ファイルと詳細な使用方法については、私にご連絡ください。 Auto Trader Xを使用してFiboSniper Proのシグナルを自動化できます: [Auto Trader X] User GuideとSet Files: [Click her
Break and Retest Hunter is a powerful MetaTrader 5 indicator designed to automatically identify support and resistance levels, breakout structures, and potential retest opportunities in real time. Bonus Indicator: After purchasing Break and Retest Hunter , contact me to receive Trade Indicator Assistant EA completely free as a bonus utility. $65 for the next 10 copies . Next price is $120.  Combining adaptive market analysis, clear BUY/SELL signals, Fibonacci-based profit targets, and a premiu
ご紹介     Quantum Breakout PRO は 、ブレイクアウト ゾーンの取引方法を変革する画期的な MQL5 インジケーターです。 13年以上の取引経験を持つ経験豊富なトレーダーのチームによって開発されました。     クォンタム ブレイクアウト プロ   は、革新的でダイナミックなブレイクアウト ゾーン戦略により、あなたのトレーディングの旅を新たな高みに押し上げるように設計されています。 クォンタム ブレイクアウト インジケーターは、5 つの利益ターゲット ゾーンを備えたブレイクアウト ゾーン上のシグナル矢印と、ブレイクアウト ボックスに基づいたストップロスの提案を提供します。 初心者トレーダーにもプロのトレーダーにも適しています。 量子EAチャネル:       ここをクリック 重要!購入後、インストールマニュアルを受け取るためにプライベートメッセージを送ってください。 推奨事項: 時間枠: M15 通貨ペア: GBPJPY、EURJPY、USDJPY、NZDUSD、XAUUSD アカウントの種類: ECN、Raw、またはスプレッドが非常に低い R
FX Power: 通貨の強弱を分析して、より賢い取引を実現 概要 FX Power は主要通貨と金の実際の強弱をあらゆる市場状況で理解するための必須ツールです。強い通貨を買い、弱い通貨を売ることで、 FX Power は取引の意思決定を簡素化し、高い確率の取引機会を見出します。トレンドを追従する場合でも、極端なデルタ値を使用して反転を予測する場合でも、このツールはあなたの取引スタイルに完全に適応します。ただ取引するだけではなく、 FX Power で賢く取引をしましょう。 1. なぜ FX Power がトレーダーにとって非常に有益なのか 通貨と金のリアルタイム強弱分析 • FX Power は主要通貨と金の相対的な強弱を計算し、マーケットダイナミクスに関する明確な洞察を提供します。 • どの資産がリードしているか、または後れを取っているかを監視して、取引するペアを賢く選びましょう。 マルチタイムフレームの包括的なビュー • 短期、中期、長期のタイムフレームで通貨と金の強弱を追跡し、マーケットトレンドに基づいて取引戦略を調整できます。 • スキャルピングからスイングトレード
発見が困難で頻度が少ないため、分岐は最も信頼できる取引シナリオの1つです。このインジケーターは、お気に入りのオシレーターを使用して、通常の隠れた分岐点を自動的に見つけてスキャンします。 [ インストールガイド | 更新ガイド | トラブルシューティング | よくある質問 | すべての製品 ] 取引が簡単 通常の隠れた発散を見つけます 多くのよく知られている発振器をサポート ブレイクアウトに基づいて取引シグナルを実装します 適切なストップロスおよび利益レベルを表示します 設定可能なオシレーターパラメーター カスタマイズ可能な色とサイズ バー単位でサイズ別に分岐をフィルタリング パフォーマンス統計を実装します 電子メール/音声/視覚アラートを実装します 幅広い市場の見通しを提供するために、異なるオシレーターを使用して、干渉なしで同じチャートにインジケーターを何度もロードできます。このインジケーターは、次のオシレーターをサポートしています。 RSI CCI MACD オスマ 確率的 勢い 素晴らしい発振器 加速器発振器 ウィリアムズパーセントレンジ 相対活力指数 特に外国為替市場では、
Gartley Hunter Multi - An indicator for searching for harmonic patterns simultaneously on dozens of trading instruments and on all possible timeframes. Manual (Be sure to read before purchasing) | Version for MT4 Advantages 1. Patterns: Gartley, Butterfly, Shark, Crab. Bat, Alternate Bat, Deep Crab, Cypher 2. Simultaneous search for patterns on dozens of trading instruments and on all possible timeframes 3. Search for patterns of all possible sizes. From the smallest to the largest 4. All fou
フィルタ:
レビューなし
レビューに返信