Fibonacci Regression Volume Map

Fibonacci Regression Volume Map

See structure, value and directional pressure in one chart.

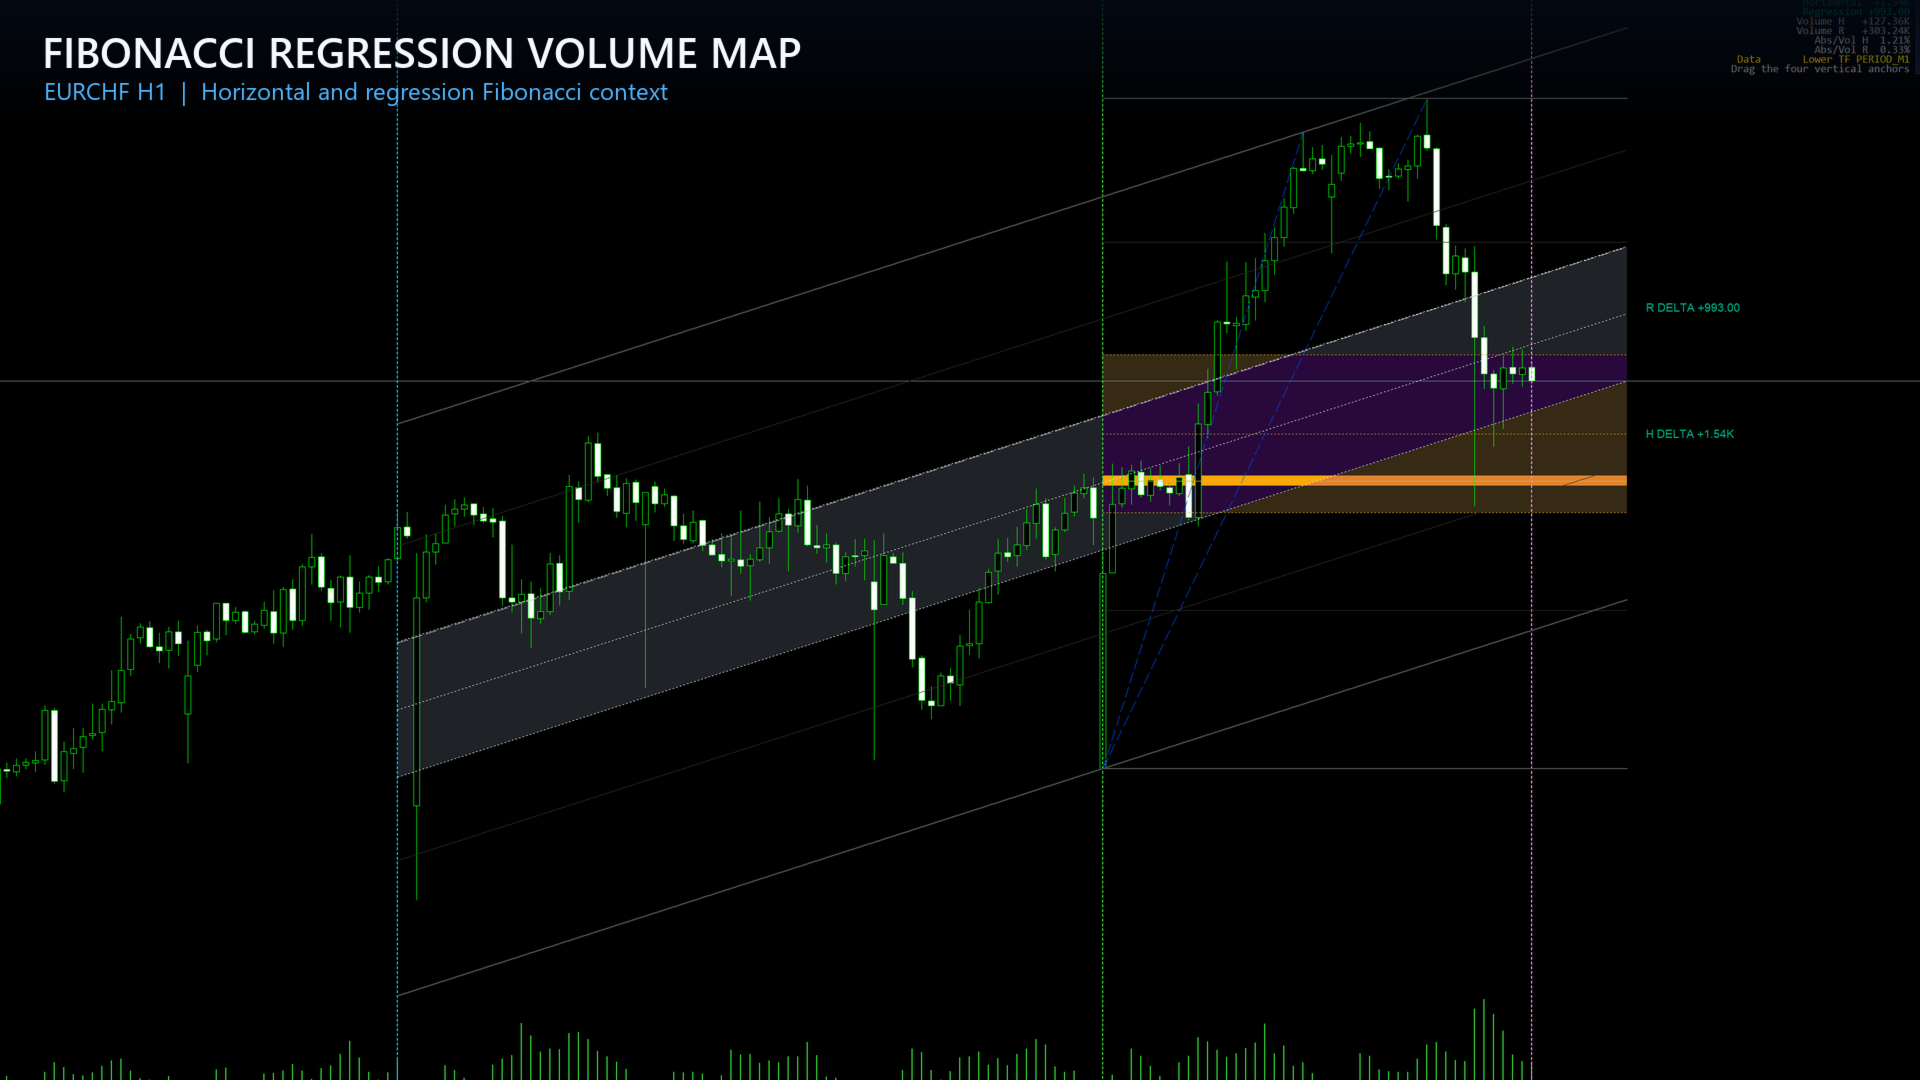
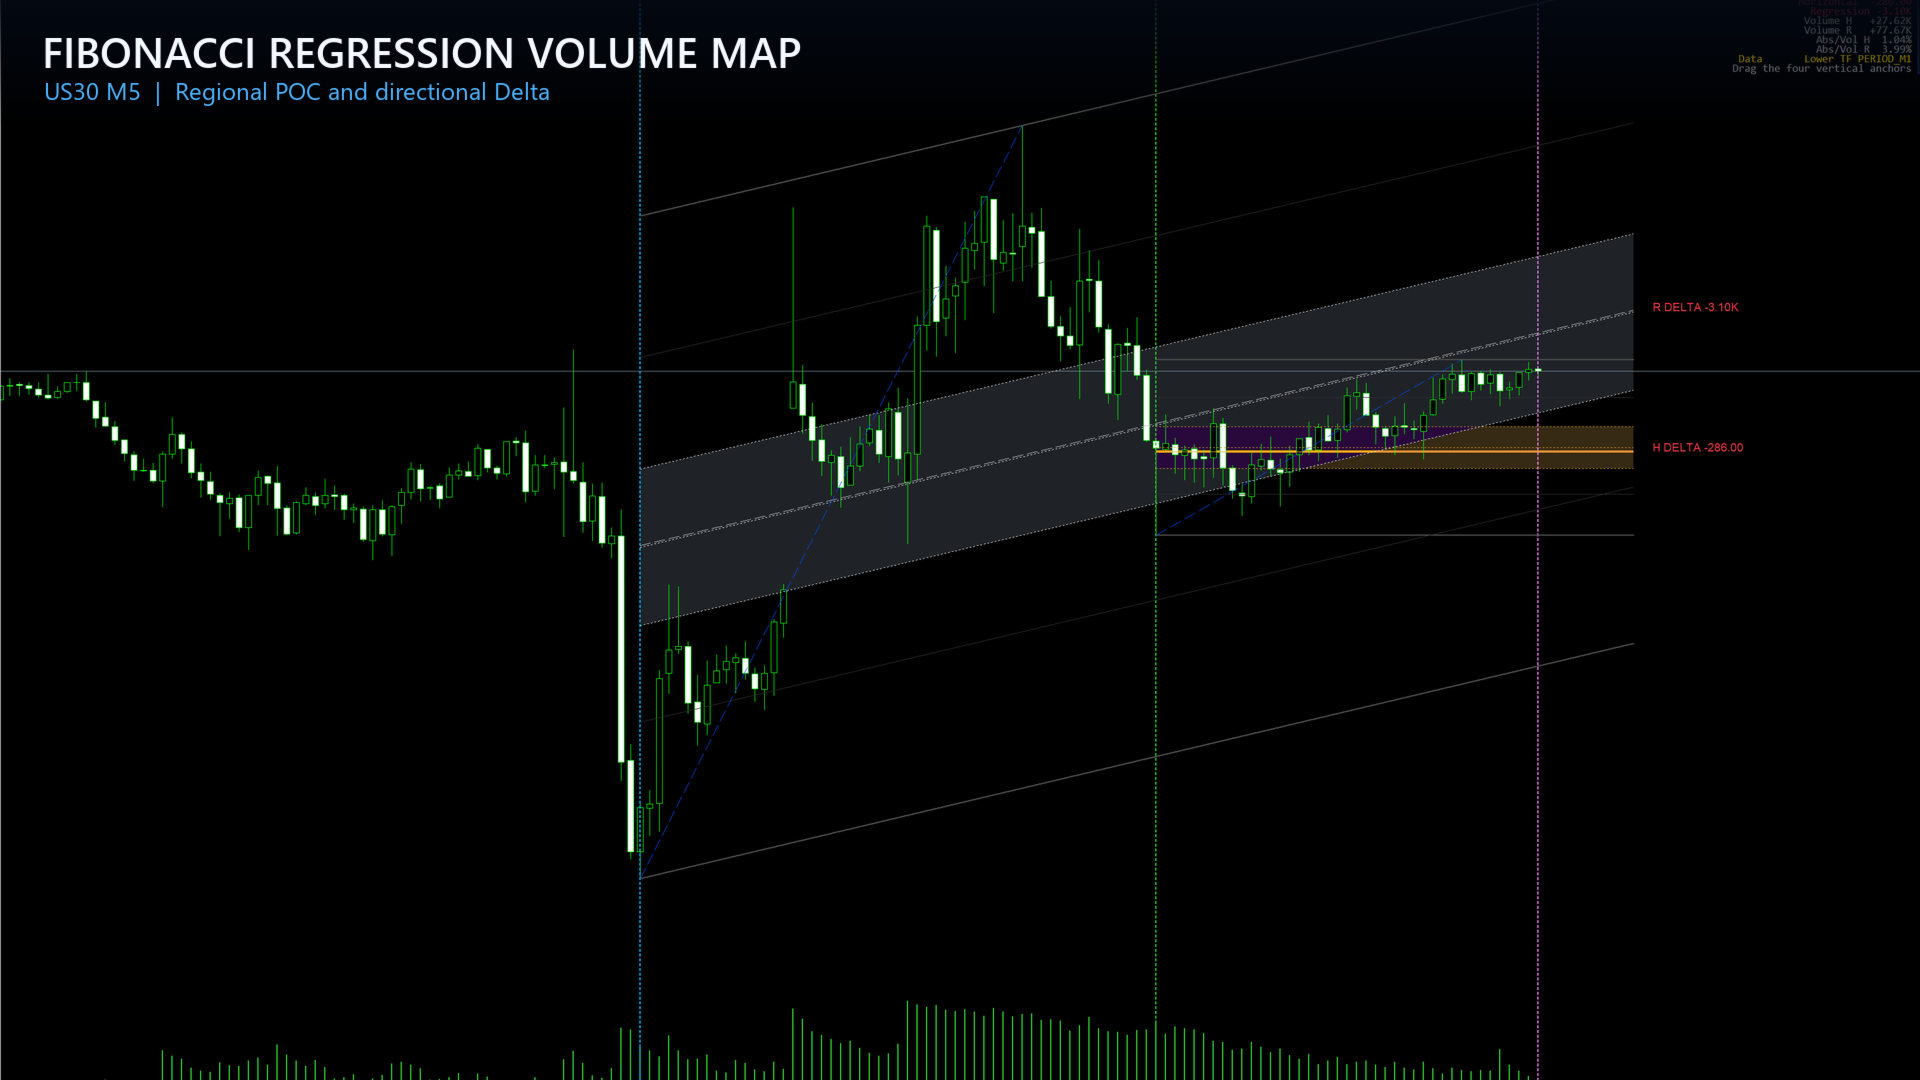
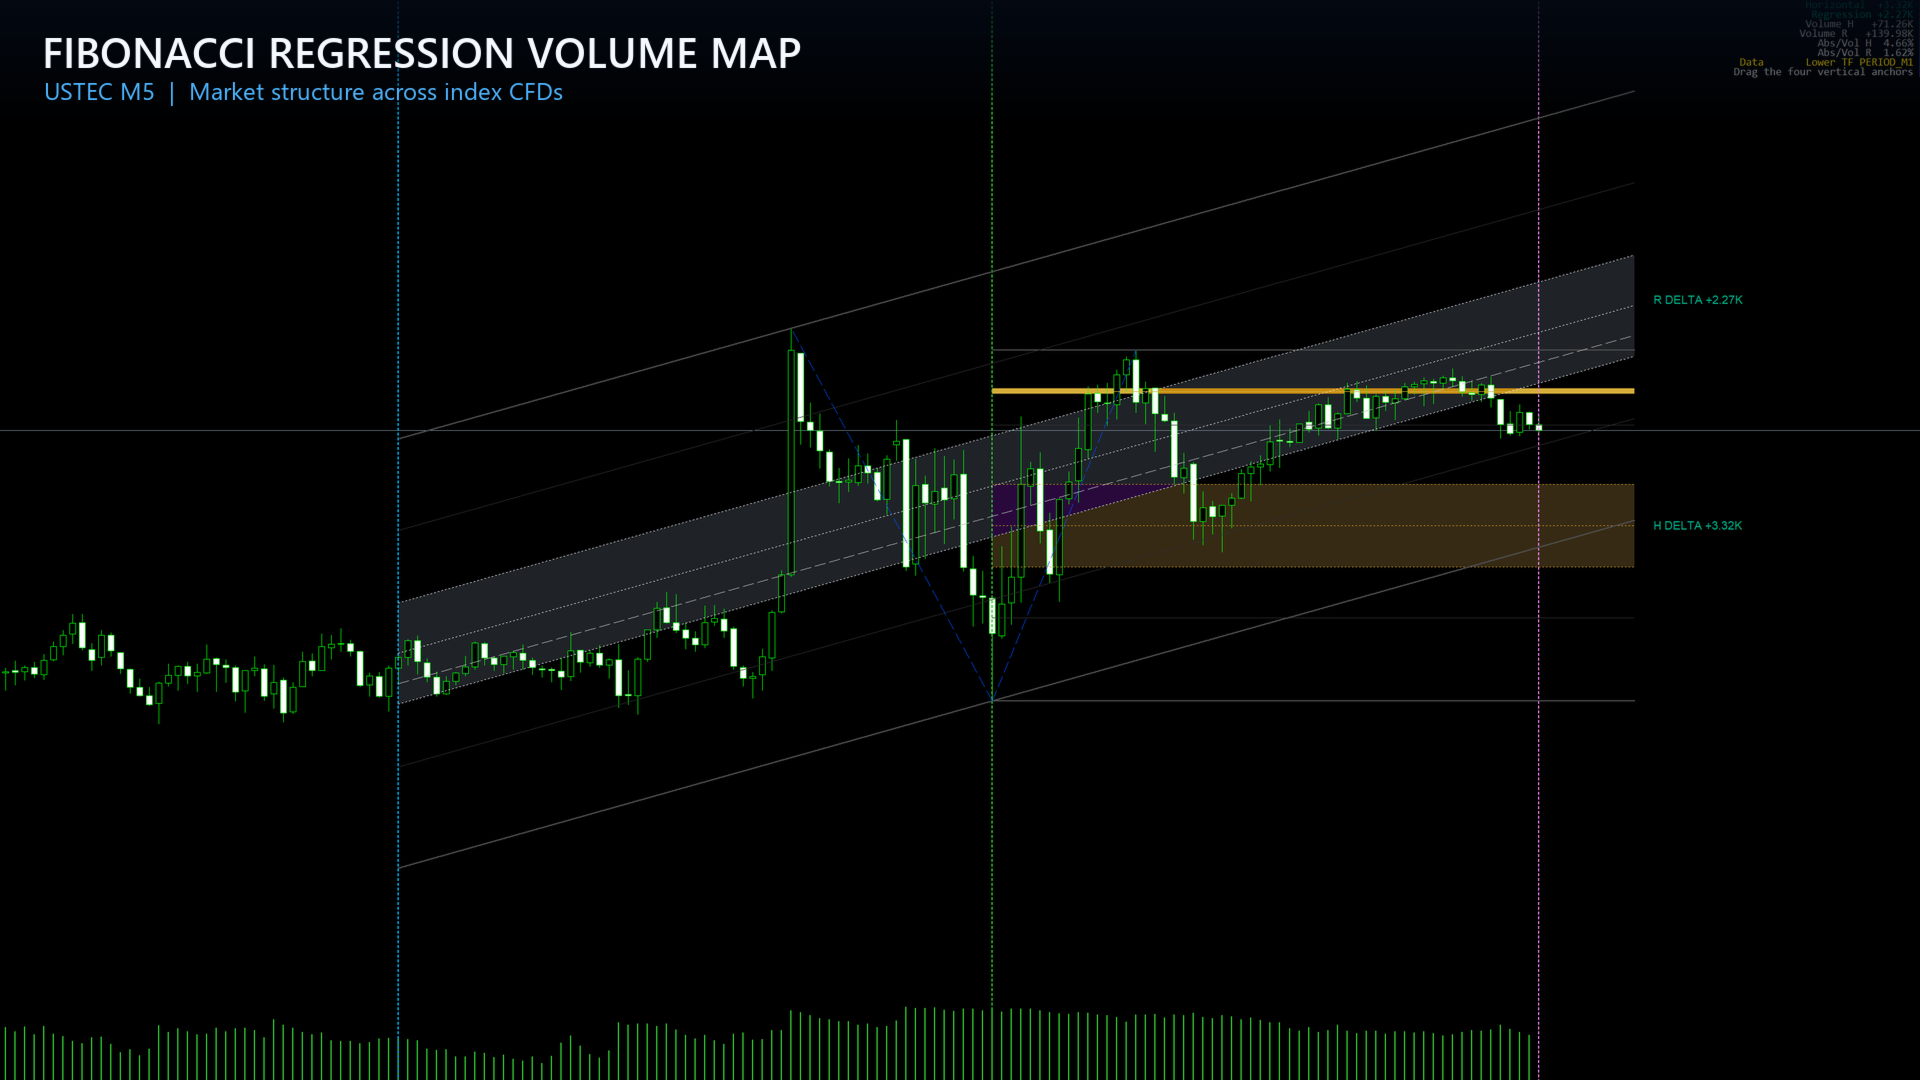
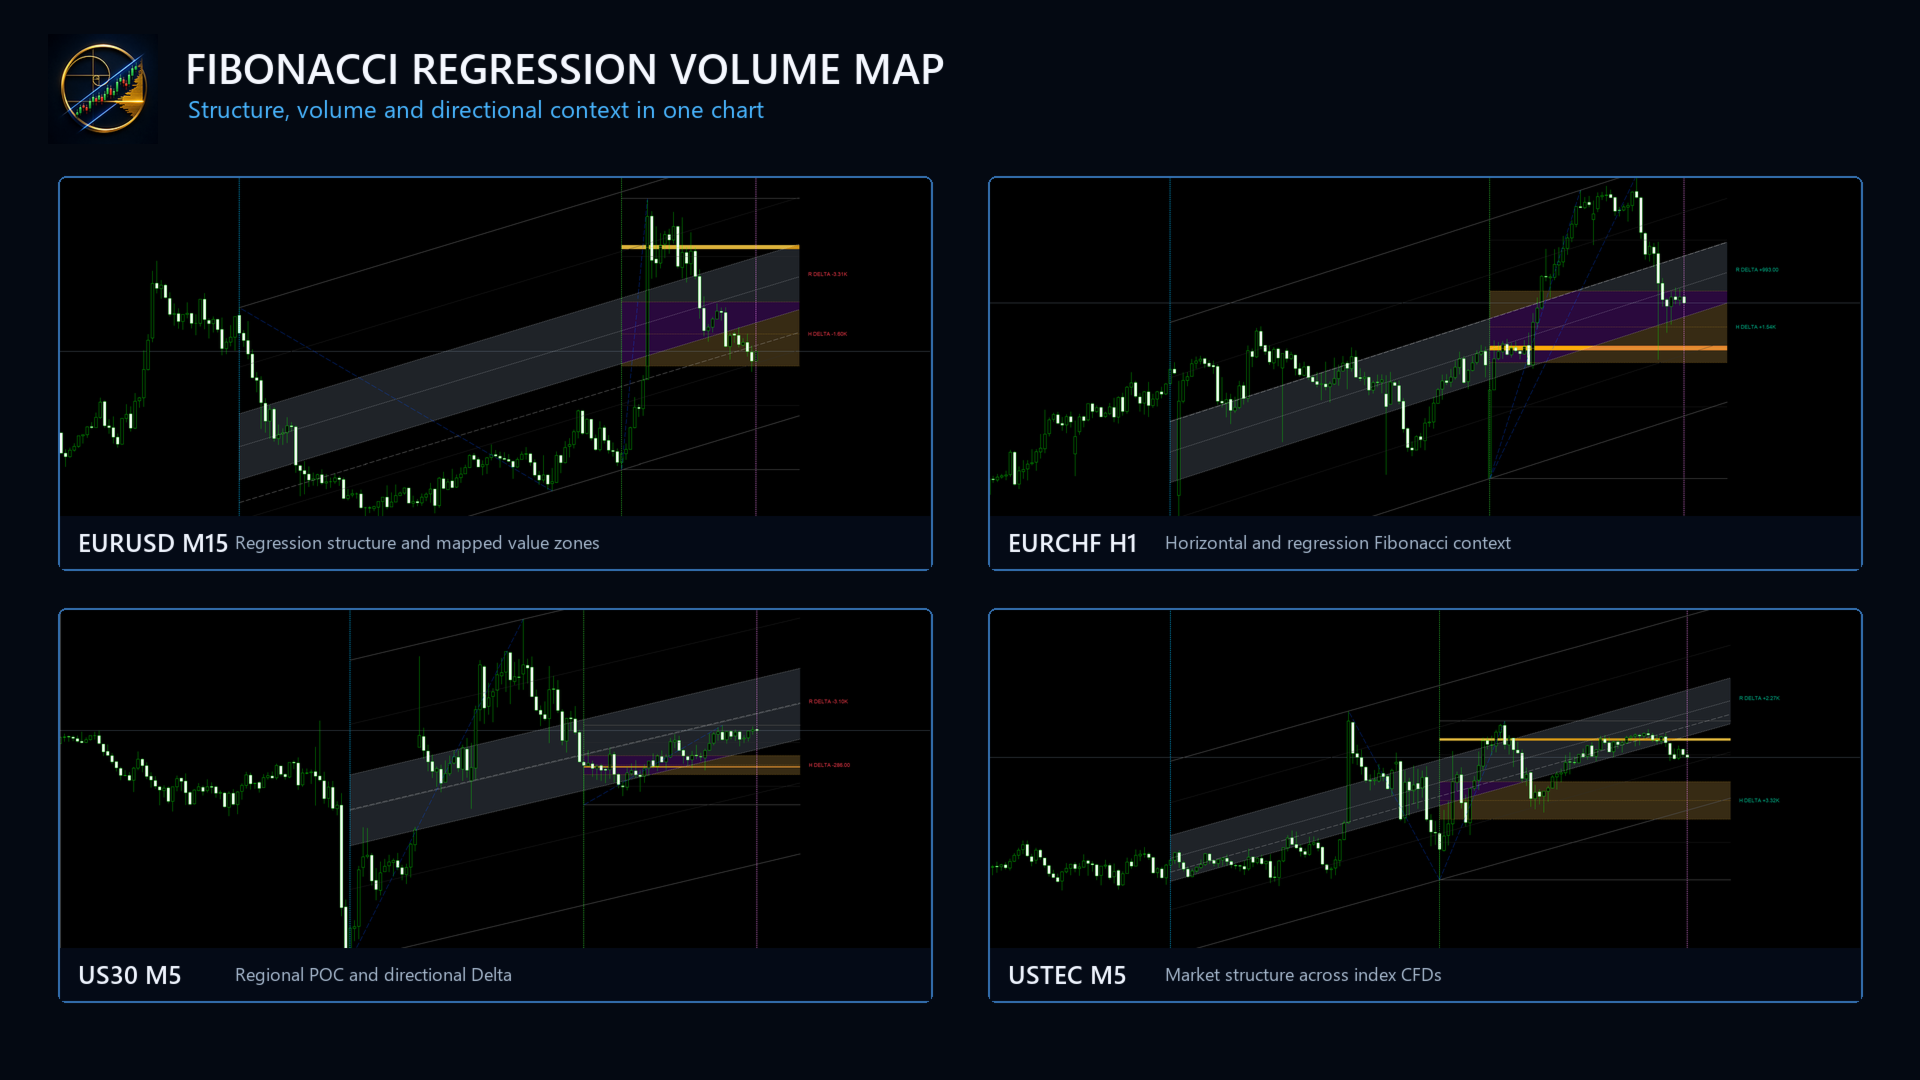
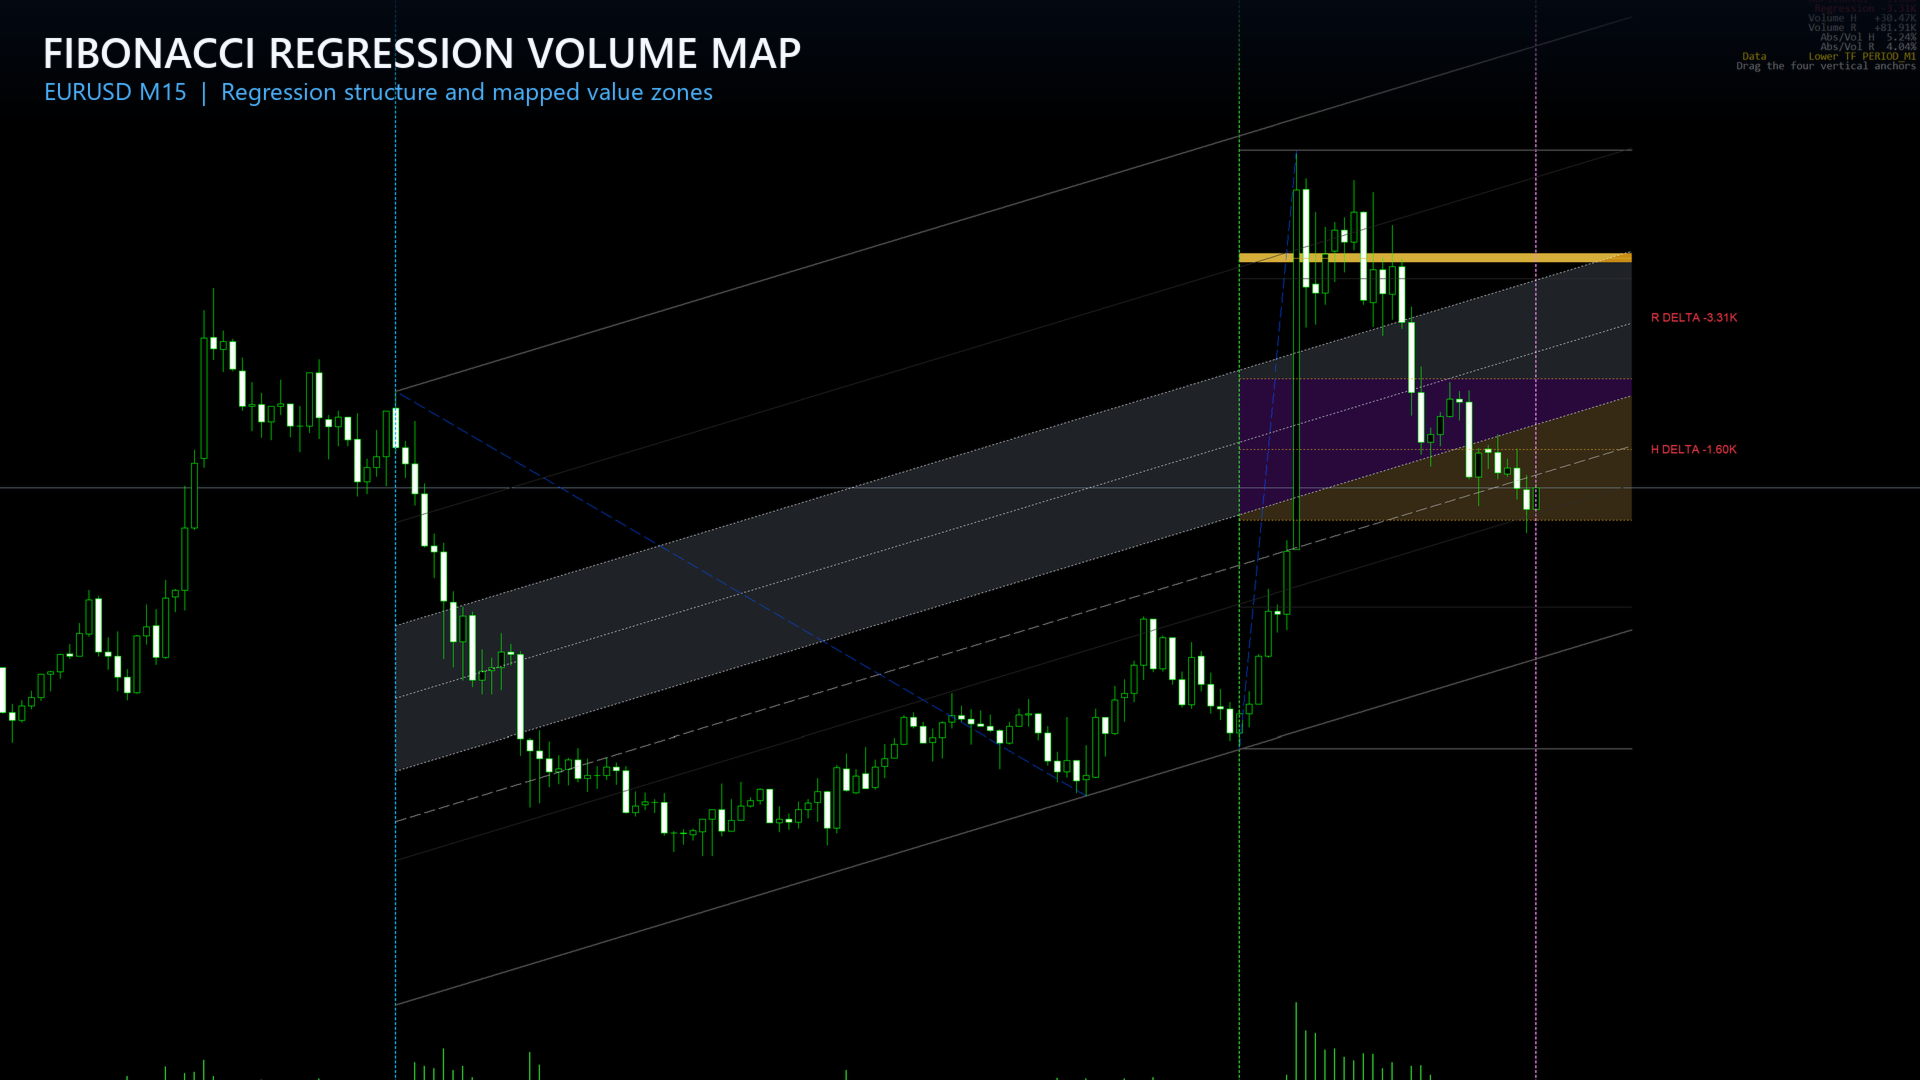
Fibonacci Regression Volume Map transforms any selected market range into a structured analytical workspace. It combines horizontal Fibonacci levels, a regression-based inclined Fibonacci channel, Golden Zones, regional Point of Control and directional volume context in a single MetaTrader 5 indicator.

Instead of analyzing isolated levels, you can observe how price structure, value concentration and directional participation interact inside the same region.

Four analytical layers

Horizontal Fibonacci map

The indicator detects the high and low of the selected horizontal region and projects the standard Fibonacci levels. Direction can be selected manually or determined automatically from the order of the extremes.

Regression Fibonacci structure

A least-squares regression line is calculated from Close, HLC3 or OHLC4 data. Parallel Fibonacci levels are then distributed across the channel height, allowing the structure to follow the slope of the selected movement.

Regional Point of Control

The selected price range is divided into configurable rows. The row with the highest accumulated volume is highlighted as the regional POC. Multiple allocation methods are available for lower-timeframe or chart-timeframe data.

Directional volume context

Lower-timeframe volume is classified according to candle direction. The indicator displays horizontal and regression Delta values, total regional volume and the absolute Delta-to-volume ratio.

Main features

  • Horizontal and regression-based Fibonacci maps
  • Standard levels: 0, 0.236, 0.382, 0.500, 0.618, 0.786 and 1.000
  • Draggable custom range anchors
  • Rolling lookback range modes
  • Automatic, bullish or bearish Fibonacci orientation
  • Multiple Golden Zone presets and manual boundaries
  • Regression based on Close, HLC3 or OHLC4
  • Regional POC calculated from configurable price rows
  • Lower-timeframe and chart-timeframe POC modes
  • Directional Delta for horizontal and regression regions
  • Total volume and absolute Delta-to-volume readings
  • Customizable colors, line widths and labels
  • Clean professional presentation designed for dark charts

A practical analysis process

  1. Select a meaningful region such as an impulse, consolidation, session or swing.
  2. Read the horizontal Fibonacci map and regional POC.
  3. Compare price with the inclined regression structure.
  4. Look for overlap between Fibonacci levels, Golden Zones, POC and channel boundaries.
  5. Use directional volume as additional context.
  6. Apply your own entry trigger, invalidation level and risk plan.

Range selection

Custom mode displays four colored vertical anchors. Two anchors define the horizontal region and two define the regression region. Drag the anchors directly on the chart to update the analysis.

Lookback mode automatically recalculates the region from the latest configurable number of chart bars. The regression structure can also reuse the horizontal range.

POC calculation modes

  • Lower timeframe price range: distributes each lower-timeframe bar volume across the price rows touched by that bar.
  • Lower timeframe HLC3: assigns each bar volume to its HLC3 price row.
  • Lower timeframe Close: assigns each bar volume to its closing-price row.
  • Lower timeframe OHLC4: assigns each bar volume to its OHLC4 price row.
  • Current chart price range: uses chart-timeframe bars and their touched price rows.

Data transparency

The indicator uses real volume when the broker supplies it. Otherwise, it uses tick volume. Directional Delta is an estimate based on candle direction and is not exchange bid/ask order flow. Values may differ between brokers because price history, tick history and available volume data are not identical.

Designed for

  • Trend pullback analysis
  • Mean-reversion context
  • Breakout and retest mapping
  • Swing and session analysis
  • Fibonacci confluence workflows
  • Regional support and resistance analysis
  • Traders who want several analytical perspectives without loading multiple unrelated indicators

Installation and first use

  1. Install the indicator through the MetaTrader 5 Market.
  2. Open the Navigator and attach Fibonacci Regression Volume Map to a chart.
  3. Keep the default parameters for the first analysis.
  4. Drag the four colored anchors to the desired regions.
  5. Allow MetaTrader 5 to download the selected lower-timeframe history.
  6. Adjust visibility and colors according to your chart template.

Important information

This product is an analytical indicator. It does not open, manage or close trades. No analytical level or volume reading guarantees a future market reaction. Trading involves risk, and the user remains responsible for testing, position sizing and every trading decision.
推荐产品
Quantum Pulse Force
Joas Da Silva Veiga
趋势指标, 市场动量, 价格行为, 外汇指标, 买卖信号, 趋势反转, 波动率指标, 技术分析, MT5指标, 剥头皮交易, 市场强度, 交易信号, 算法交易, 价格通道, 统计分析 Quantum Pulse Force 是一款用于 MetaTrader 5 的技术指标,旨在分析价格运动的加速度,识别趋势与横盘阶段,并基于多重定量过滤器突出关键市场位置。 与传统仅显示方向的指标不同,其核心在于衡量行情的强度及其变化过程,从而在价格走势尚未明显表现之前提供更精确的市场行为判断。 流动百分比(Flow Percentage) 该指标的核心是计算两条移动平均线之间差值的百分比变化。 该计算反映两条均线之间距离的扩大或缩小,从而表示行情的加速或减速。 解释: 正值表示向上加速 负值表示向下加速 接近零的数值表示动能减弱或市场进入横盘 这种方式可以在价格尚未明显变化前提前发现趋势变化。 K线颜色 指标会根据当前市场状态自动改变K线颜色。 颜色含义如下: 深蓝:强势上涨 深红:强势下跌 浅蓝:弱势上涨 浅红:弱势下跌 绿色:可能向上反转 橙色:可能向下反转 深绿色:可能出现买入资金流向反转。
Fair Value Gap Volume Profile Pro This indicator detects price imbalances (Fair Value Gaps) on the chart and displays the volume distribution inside each gap using data from a lower timeframe. It is designed for traders who use institutional price action concepts and want to understand where volume was concentrated during the formation of each gap. What is a Fair Value Gap A Fair Value Gap (FVG) is a three-candle price imbalance where a candle moves so strongly that it leaves a range untouched
Indicador 3 Vela do movimento
Vagner Ferreira Da Silva
专业多时间周期监控指标 产品描述 Scanner 3 do Movimento 是一款适用于 MetaTrader 5 的专业指标,可同时监控 11 个时间周期,并自动识别特定的三根K线反转形态。 使用该指标后,您无需再手动切换图表。所有信息都会直接显示在 MT5 屏幕上的单一面板中。 工作原理 K线形态 该指标会寻找由连续 3 根K线组成的特定形态。 BUY(买入)信号: K线 颜色 条件 第1根K线(最早) 红色 反转基础 第2根K线(中间) 绿色 最低点低于第1根K线 第3根K线(最新) 绿色 最高点高于第2根K线 SELL(卖出)信号: K线 颜色 条件 第1根K线(最早) 绿色 反转基础 第2根K线(中间) 红色 最高点高于第1根K线 第3根K线(最新) 红色 最低点低于第2根K线 实际运行方式 该指标会同时分析所有时间周期: (M1、M2、M3、M4、M5、M6、M10、M12、M15、M20、M30)。 当任意时间周期形成该形态时: 面板颜色会发生变化 自动触发声音警报 交易者能够立即知道哪个时间周期出现了有效形态 提前预警
Heiken Ashi Stacked Pro is a chart overlay indicator that combines smooth Heiken Ashi visual trend candles, a real-time bar completion timer, and an on-hover crosshair HUD for instant price and wick-to-body ratio diagnostics. Marketplace Description Overview Heiken Ashi Stacked Pro upgrades standard Heiken Ashi candle visuals with an interactive HUD. Designed for trend followers and price action traders, it filters out market noise using colored candles while supplying precise candle metric read
Fabulous Four FAB4 Indicator
Daniel Raimundo De Oliveira
The Exclusivissimo FAB4 (Fabulous Four) Indicator is an institutional-grade chart analysis tool designed for MetaTrader 5. Built for professional traders who demand precision, this indicator automatically maps the most critical liquidity zones and momentum shifts in the market, keeping your chart clean and your entries surgical. Whether you are trading Forex, Indices, or Stocks, the FAB4 Indicator provides a complete institutional roadmap right on your screen, highlighting true market intent wit
重要通知 – 需要许可证和激活 ============================ 激活说明: 完成购买后,请立即联系我们以获取您的许可证密钥、密码或激活信息。没有这些信息,软件将无法运行。我们将确保为您提供顺畅的激活过程,并解答您的任何问题。 --- Volume Delta Profile V2 Enhanced ================================ 专业成交量与Delta分析工具 ------------------------- 概述 ---- **Volume Delta Profile** 是一款专业级分析工具,结合了传统的成交量分布分析与先进的Delta和失衡检测功能。这款综合性指标为交易者提供了市场动态的精细视图,通过实时图形化展示拍卖数据,捕捉价格随时间波动的连续起伏。 --- 核心功能 -------- 5种显示模式 -------------- - **VOL** — 总成交量直方图:显示整体成交量分布 - **BS** — 买卖拆分:可视化每个价格水平的买卖压力 - **ΔH** — Delt
Description The indicator uses market profile theory to show the most relevant trading zones, on a daily basis. The zones to be shown are LVN (low volume nodes) and POC (point of control). An LVN zone is one which represents price areas with the least time or volume throughout the day. Typically, these areas indicate a supply or demand initiative, and in the future, they can turn into important breakout or retracement zones. A POC zone is one which represents price areas with the most time or vo
CvdDeltaVolumes
Parasbhai N Patel
Delta + CVD & CVD Candles Order-flow indicator combining Delta (Ask–Bid), Cumulative Volume Delta (CVD), and a unique CVD-based synthetic candle system. Shows buy/sell pressure, volume aggressiveness, and momentum shifts with optional Delta histogram, CVD line, and CVD+Delta combined candles. Useful for scalping, intraday trading, divergence detection, and understanding buyer/seller dominance. Overview The Delta + CVD & CVD Candles Indicator combines multiple order-flow tools into one clean
Overview Heiken Ashi CE Filtered MT5 is a technical indicator for the MetaTrader 5 platform. It integrates smoothed candlestick charting with a dynamic exit strategy and a customizable trend filter to deliver clear buy and sell signals. The indicator is designed to improve trend detection and signal reliability by reducing market noise. If you want to see more high-quality products or order the development/conversion of your own products, visit my partners' website: 4xDev Get 10% OFF on manual
Smart Volume Zone
Gleidson Duca De Aguiar
Launch price: 30 USD - price will increase after the first purchases, so early buyers lock in this rate. Smart Volume Zone marks the trading candle with the highest tick volume within the last N trading days (configurable, default 10) and highlights it directly in the terminal's native Volumes panel, with no separate window and no third-party dependency. How it works: the indicator scans every M1 candle within each of the last N days, finds the single highest-volume candle per day, then compar
Weis Wave Result MT5
Sant Clear Ali Costa
Features 3 types of waves: bullish, bearish and unknown. The unknown tower comes when prices move in opposite the direction of the current tower. Label that shows the percentage remaining for the next tower. Allows you set the type of volume that will be accumulated in the towers, either real or tick volumes. Thus, the indicator works in any market, for example: stocks, futures, forex, commodities, etc. Allows you to set the required score for the tower exchange. Allows you to set the font size
Before installing the HeatMap indicator make sure you are using a broker that gives you access to the Depth of market (DOM) !! This indicator creates a heatmap on your chart allowing you to see the buy or sell limit orders easily and in real time. You have the possibility to change the setting and the colors of the HeatMap in order to adapt to all markets and all charts. Here is an example of a setting you can use with the NASDAQ100 on the AMPGlobal broker :  https://www.youtube.com/watch?v=x0Y
Golden Limit
Renato Fridschtein
There are no limits! Golden Limit is the ultimate indicator to get clear and easy readings of price movements on charts. It projects support and resistance ranges, calculated by statistical models involving Price Action and the Fibonacci sequence, revealing in advance the behavior of prices and the best places to trade and not to trade. It also has two moving averages to help choose the best entries. The Golden Limit method was created from a proven model. In summary: We use the names of precio
FabFlowInPrice
Fabiano Luiz Roberto
Tape Reading, flow monitoring. FabFlowInPrice   is a powerful indicator for those who like Tape Reading (Times & Trades). It presents the volumes traded at each price level, considering the purchase, sale and direct aggressions for each level. Excellent tool for market flow analysis. Thought of flow so monitor who is attacking the most, buyers, sellers or direct exchanges, thought FabFlowInPrice. The indicator displays information in 4 distinct and fixed periods, on any timeframe: @Day - All t
Trend On Close
David Ben Svaiter
TrendOnClose is a sophisticated indicator designed for Binary market investors, focusing on statistical analysis of trends and counter-trends within specific candle cycles. Each cycle is defined by the candle CLOSE price, establishing the trend direction (UP/DOWN - BULL/BEAR) for subsequent statistical analysis until the start of the next cycle. The statistical analysis operates with two configurations: ⦁ Statistical Goal as SUBSEQUENT CANDLE: The algorithm focuses on the subsequent candle withi
Volume Profile DD 1B
OBARE PAUL OTIENO
重要通知 – 需要许可证和激活 激活说明: 完成购买后,请立即联系我们以获取您的许可证密钥、密码或激活详情。没有这些,软件将无法运行。我们将确保激活过程顺利进行,并随时为您解答任何疑问。 多语言定制 为了提升您的交易体验,我们提供软件的多语言完整定制服务。我们的团队可以提供以下语言的翻译: 中文 | 法语 | 葡萄牙语 | 西班牙语 | 俄语 日语 | 德语 | 韩语 | 意大利语 | 土耳其语 只需告诉我们您偏好的语言,我们将定制指标,确保为您提供用户友好的体验。 成交量分布 – 高级市场分析工具 成交量分布是一个复杂的分析工具,旨在为交易者提供对市场动态的深入洞察。它捕捉价格随时间的变化,提供实时图形化的拍卖数据表示,揭示影响价格变动的集体行为模式。 其核心是 价值区域 (Value Area) ,代表包含当天68%交易活动的价格范围。这一区域与标准差对齐,突出显示大多数交易发生的区域。 主要功能: 成交量控制点 (VPOC): 识别在指定时间内交易量最高的价格水平,作为公平价格。 价值
Touch VWAP MT5
Danrlei Hornke
O Touch VWAP é um indicador que permite calcular uma Média Ponderada por Volume (VWAP) apenas apertando a tecla 'w' no seu teclado e após clicando no candle do qual deseja realizar o calculo, clicando abaixo do candle é calculada a VWAP baseado na minima dos preços com o volume, clicando sobre o corpo do candle é calculado uma VWAP sobre o preço medio com o volume e clicando acima do candle é calculado uma VWAP baseado na máxima dos preços com o volume, voce tambem tem a opção de remover a VWAP
Smart Market Structure Simple is a powerful indicator that helps traders identify market structure based on the Smart Money Concept (SMC) . This indicator automatically detects Break of Structure (BOS), Change of Character (CHoCH), Fair Value Gaps (FVG), Order Blocks (OB), Liquidity Zones (LQZ), and key swing points Higher High (HH), Higher Low (HL), Lower High (LH), Lower Low (LL) . Main Objective: Assist traders in tracking institutional flow ( Smart Money ) and finding high-probability trade
SmartFVG Mapper
Muhamad Syafiq Bin Khairuddin
产品描述 自动化您的聪明钱概念 (SMC) 与 ICT 交易。 在多个图表上手动绘制公允价值缺口 (FVG) 和订单块会导致视觉疲劳并错失入场时机。SmartFVG Mapper Pro 是一款机构级的精准指标,可自动检测、绘制和管理真实的市场流动性失衡。 专为剥头皮交易者和资管公司 (Prop Firm) 交易员打造,该指标绝不盲目画框。它具有专有的 Mitigation Engine (缓解引擎) ,在缺口被填补的毫秒间立即删除该区域,保持图表整洁,让您只专注于活跃的、高概率的供需水平。 核心机构级功能: CE 50% 中线: 自动在每个活跃的 FVG 内绘制精准的 50% 虚线中线,助力挂单精准入场。 成交量异常过滤: (可选) 过滤低迷的亚洲盘震荡。仅当失衡 K 线的成交量超过 20 周期均量时才绘制 FVG。 触碰警报: 离开屏幕也无妨。当实时价格触碰活跃 FVG 的瞬间,您的手机和 MT5 终端会立即收到推送通知。 图表极简主义: 未测试的区域保持实心。一旦被缓解 (Mitigated),引擎会将其从图表中擦除,消除视觉混乱。
Master HMA
Leonel Alberto Jose Quintana
MetaTrader 5 的 Master HMA Master HMA 是一款适用于 MetaTrader 5 的技术指标,将不同的 Hull Moving Average 计算方式结合到一个可视化结构中,用于分析价格的方向、斜率以及运动行为。 该指标使用三个 HMA 周期:Fast、Main 和 Slow。这些线之间的关系可以帮助观察市场运动结构的变化,并跟踪不同的市场阶段。 Main HMA 使用不同颜色表示系统识别出的状态。指标还可以显示由 Fast 和 Slow HMA 之间关系形成的云带。 结构分析 Master HMA 分析移动平均线行为的不同特征,包括斜率、HMA 之间的距离、压缩、扩张、加速、力量减弱以及云带宽度的变化。 这些信息经过综合分析后,用于形成当前市场运动结构的可视化读数。 Master Score 该指标包含一个名为 Master Score 的内部系统,其计算范围为 -100 至 +100。 计算会考虑 HMA 结构的不同组成部分,包括趋势、斜率、均线之间的关系以及加速度。 Master Score 与 Master State 结合使用,将当前分析状态
Segmented Volume MT5
Eduardo Da Costa Custodio Santos
LT Support Resistance - 100% 自动识别支撑位与阻力位 您是否厌倦了在手动绘制支撑线和阻力线上浪费时间?或者因为总是错过某个关键位置而感到沮丧?LT Support Resistance 的开发正是为了消除这一繁琐的工作,它能同时在多个时间周期(Timeframe)内,自动识别并标注出对您交易资产最具价值的区域。 == 关键位置的智能自动化 == 相比手动绘制线条(既主观又耗时),该指标能够通过分析历史价格,识别出显著的反转点,并绘制出价格“真实”尊重的支撑线与阻力线。为您带来更客观、更高效且基于数据支撑的盘面分析。 == 核心特性 == 100% 自动检测: 无需手动分析,自动识别支撑/阻力 多时间周期 (MTF): 直接在 M5 图表上直观查看 H1、H4、D1、W1 的关键位置 智能警报: 当价格触及、突破或在某一水平位盘整时发送通知 动态区域: 创建的是“区域”而非简单的“线条”,更加贴合价格行为(Price Action)的真实市场 兼容任何资产: 外汇、指数、股票、加密货币、大宗商品 视觉完全自定义: 颜色、样式、粗细、透明度均可自由配置 == 运
Signal Liquidity Reaper Dashboard
Gabriel Alejandro Sanchez Lledo
Warlock Signal Liquidity Reaper Dashboard v1.2 是一款专为 MetaTrader 5 设计的专业多周期信号指标。该仪表盘采用与我们的 Gold Liquidity Reaper Pro EA 系列相同的机构交易方法论,让您一目了然地掌握全局市场状况——从周线宏观趋势到 5 分钟的精准入场。 一句话概括 同时读取六个时间周期,将每个周期标记为 看涨 (BULLISH) 、 看跌 (BEARISH) 或 中性 (NEUTRAL) ,当达到足够的共识时,直接在图表上生成包含入场价、止损位和止盈位的完整 ICT 交易设置。 六周期偏差面板 仪表盘顶部实时显示每个主要周期的方向偏差: W1 — 周线(最高宏观偏差): 机构大方向。价格在周线 EMA200 之上或之下决定了市场处于结构性牛市还是熊市。这是对冲基金和宏观交易员用来决定交易方向的过滤器。 D1 — 日线(结构方向): 确认中期趋势。结合 ADX 确认,D1 偏差会告诉你动能是支持周线方向,还是开始出现背离。 H4 — 四小时(趋势质量): 趋势质量闸门。ADX 必须超过最低阈值,H4 偏
️ Candle Timer Advanced Suite for MetaTrader 5 Gain the ultimate edge in precision timing with the Candle Timer Advanced Suite. This is not just a simple countdown; it is a professional-grade analytical tool designed to keep you perfectly synchronized with the market, ensuring you never miss a critical entry or exit due to server lag or misinterpretation. Built specifically for MetaTrader 5, this suite offers unparalleled flexibility, allowing you to visualize time exactly how you need it, acr
本指标可以让您享受两个最流行的产品来分析在感兴趣的价位的请求量和市场成交量: 真实市场深度图表 真实报价足迹成交量图表 本产品结合两个指标的效力,并以单个文件提供。 反危机出售。今日低价。赶紧! 真实的 COMBO 市场深度功能和报价成交量图表,完全等同于原始指标。您将享受这两款产品结合为单一超级指标的力量!下面是您将得到的功能: 真实市场深度图表 股民专用工具现已在 MetaTrader 5 上可用。 真实市场深度图表 指标在图表上以直方条的形式显示可视化的市场深度,并在实时模式下刷新。 利用 真实市场深度图表 指标您可以正确评估市场请求并从图表上看到大的市场。这可以 100% 的精确剥头皮和设置持仓止损。 指标以两种相应颜色的水平直方条形式显示买和卖的请求 (买-卖)。价格图表上给定级别的显示条和它们的长度与请求的交易量相应。此外, 它指示买卖请求的最大交易量。 此指标显示买卖请求总数量作为堆积面积图。这可以评估当经过下一价位时将会执行的请求总量。买卖请求总数量也显示在图表上。 省缺, 指标显示在图表背景上, 且它不会干扰任何其它指标。当使用指标交易时, 建议使用实际交易量。 本
CVD SmoothFlow Pro
Thalles Nascimento De Carvalho
CVD SmoothFlow Pro - 适用于任何资产的无限量分析! CVD SmoothFlow Pro 是寻求精确和无限量分析的交易者的终极解决方案。该专业版利用累计成交量 delta (CVD) 并结合高级噪声过滤,为交易任何金融资产提供所需的灵活性和精确度。 CVD SmoothFlow Pro 提供了什么? 清晰分析 :过滤市场噪声,突显任何金融资产中的重要成交量变动。 ️ 精确计算 :监测买卖差异,提供外汇、指数、加密货币等资产的成交量行为的详细视图。 直观界面 :提供易于理解和高效的分析,数据呈现清晰明了。 趋势识别 :更自信地识别市场趋势,帮助做出明智决策。 实际应用: 实时监测任何资产中买卖双方的平衡。 基于成交量识别趋势反转。 精确过滤,关注外汇、指数、加密货币等资产中的重要变动。 无限制的专业版! 专业版提供无限制的所有功能访问权限,让您能够对任何金融资产进行详细和无限量的分析。
Smart ATR Grid Pro
Syamsurizal Dimjati
SMART ATR GRID PRO++ – Adaptive Grid Intelligence Suite is a next-generation, institutional-grade grid trading indicator engineered for traders who demand precision, adaptability, and comprehensive market structure analysis. By seamlessly integrating   Adaptive Volatility Grid System ,   KAMA Candle Trend Filtering ,   Multi-Factor Trend Detection (ADX + EMA20/50) ,   Dynamic Heatmap Zone Engine , and   Real-Time Market Regime Classification , this indicator delivers a complete decision-making
Fibaction
Abdelkhalek Orabi
Indicator Name: Fibaction – price action candle Detector Description: Fibo Signal Boxes is a powerful Smart Money Concept (SMC)-inspired indicator that auto-detects price action candles. bullish hammers and shooting stars, then draws precise Fibonacci entry zones and multiple take-profit levels directly on the chart. as for the SL personally i use 40 pips rules  Key Features: Detects bullish hammer and shooting star reversal candles. Automatically draws Fibonacci entry and TP boxes. as
Tenet Support and Resistance Pro
Lucas De Melo Carvalho Cruz
Tenet Support & Resistance Pro 是一个用于 MetaTrader 5 的高级指标,旨在帮助交易者准确识别 关键市场支撑和阻力区域 。 基于价格历史,该指标会自动绘制水平线以突出战略区域。此外,它会在 实时显示蜡烛当前交易区域 ,提供对关键决策区域的清晰视图。 一个独特功能是 蜡烛旁边的倒计时器 ,精确显示当前K线收盘剩余时间——非常适合需要精确入场时机的价格行为交易者。 主要优势 自动识别 最相关的支撑和阻力区域 。 直观突出显示 蜡烛当前交易区域 。 内置倒计时器 ,实时显示在蜡烛旁。 完全 可配置 :选择生成线条所使用的时间框架(D1、H4、H1、M15、M5、M1)。 可自定义颜色 ,适用于每种线条类型、区域和倒计时器。 根据图表时间框架隐藏或显示线条。 智能系统,可 每日或用户指定时间自动重新计算 水平。 ️ 输入参数 一般设置 default_chart_view – 如果希望将图表视觉更改为 Tenet 默认(白色背景,绿色多头蜡烛,红色空头蜡烛),设置为 True。 chart_ID – 要分析的图表ID。 reset_
Multi Anchor VWAP
Gleidson Duca De Aguiar
Launch price: 30 USD - price will increase after the first purchases, so early buyers lock in this rate. Multi Anchor VWAP lets you place a Volume Weighted Average Price line starting from any candle you choose, instead of only resetting automatically at the start of a session, day, week or month. How it works: press the H or L button, then click the candle you want to anchor to, or use the Up and Down arrow keys to move to it and confirm with Enter. The VWAP line starts exactly at that candle
该产品的买家也购买
Trend Sniper X
Sarvarbek Abduvoxobov
4.9 (42)
Trend Sniper X 是一款适用于 MetaTrader 5 的多周期趋势跟踪指标,可帮助交易者清晰精准地识别趋势方向和潜在的反转点。 适用于 MT4: https://www.mql5.com/en/market/product/193245 价格信息: 当前价格为促销价,随着后续更新和新功能的推出,价格可能会有所变动。 赠品优惠: 购买后联系作者,即可免费获取该指标的 Auto-Trade Assistant EA(自动交易助手 EA)。 Code2Profit 频道 通过多时间框架分析掌控市场! 如何使用 Trend Sniper X 最大化您的胜率:核心规则与交易时段技巧 技术规格 平台 MetaTrader 5 指标类型 多时间周期趋势指标 运行时间周期 任何图表时间周期,可独立选择更高的时间周期 (M1–MN1) 主要交易品种 外汇、黄金 (XAUUSD) 及其他差价合约 (CFD) 推荐账户 任何账户类型 可视化 彩色趋势蜡烛 (买入/卖出/微弱/变化) + 买入/卖出箭头 附加模块 交易时段方框 (悉尼、东京、伦敦、纽约) 主要功能 多时间周期趋势分析: 直接在
Smart Trend Trading System — MetaTrader 5 购买后,请在 MQL5 上给我发消息,即可免费获得 Smart Universal Expert Advisor,以及在线课程、PDF 手册和私人群组访问权限。 STTS 将趋势方向、入场和出场信号、反转区域及重要价格水平集中呈现在图表上。您可以根据系统手动交易,也可以连接单独的兼容 EA,按照您选择的设置自动执行交易。 一套系统,四种交易思路 STTS 将交易方法分为四大类: • 剥头皮交易 — 跟踪短期信号和市场波动。 • 趋势交易 — 评估方向,寻找趋势中的交易机会。 • 反转交易 — 识别潜在的转折区域和方向变化。 • 成交量交易 — 利用成交量相关信息评估市场活跃程度。 入场和出场箭头、趋势信息、支撑与阻力位及反转区域,帮助您直接在图表上分析交易形态。 先从一种方法开始。了解其信号和设置后,再探索其他方法。 从信号到自动化 Smart Universal Expert Advisor 可连接 STTS,让您自动执行受支持的交易信号。 启用自动交易前,请配置指标连接、仓位大小和交易管理设置
SuperScalp Pro
Van Minh Nguyen
4.56 (36)
SuperScalp Pro - Professional Multi-Layer Confluence Scalping System SuperScalp Pro 是一款高级剥头皮交易指标,在经典 Supertrend 的基础上加入了多个智能确认过滤器。它可以帮助您识别概率更高的 Buy/Sell 交易机会,同时显著减少虚假信号。 清晰的 Buy 和 Sell 箭头会直接显示在图表上,基于 ATR 的 Stop Loss 和 Take Profit 水平会实时自动计算。 购买后,请联系我获取设置指导和推荐配置。 使用 SuperScalp Pro Auto Trader 轻松实现信号自动化: [Auto Trader] 下载推荐设置文件: [Set File] 完整文档请参阅产品博客: [User Guide] 加入官方频道获取最新更新: [Official Channel] 您将获得什么 SuperScalp Pro Indicator – 多层级 Buy/Sell 信号,并自动计算基于 ATR 的 Stop Loss 和 Take Profit。 免费 VM Auto SLTP
全新王者降临 - 指标 + 订单管理提示(TP1 + TP2 + TP3)+ 可选 Telegram 信号发送器 INCLUDED(免费) (完整交易与信号系统) 我们最强的黄金 EA: Gold Slayer 该指标包含先进的交易策略、可自定义订单管理系统,以及结合 Envelope 扩展的均值回归系统,并通过 RSI 等多重智能确认过滤器进行验证,以捕捉高概率反转入场机会,提供 BUY 与 SELL 信号。 你不仅能够学习如何交易,还能学会如何高效管理多个仓位,并利用之前盈利的持仓来覆盖亏损交易。 专为 M5 周期打造并优化,在 BTCUSD 和 XAUUSD 上表现尤为出色,因为这些市场的流动性能够让信号更加干净、可靠。 该指标会自动生成清晰的多头(Long)与空头(Short)信号,同时基于 ATR 自动计算入场位、止损位和止盈位,让风险管理从一开始就融入系统之中。 多 TP 系统设有三个渐进式目标位,你可以在 TP1 锁定部分利润、在 TP2 继续持仓,并在更大的行情中将仓位持有至 TP3,而这正是平均风险回报比真正开始大放异彩的地方。 默认参数开箱即用,已经针对稳定表现进行
SMC Intraday Formula
VividMind Digital Solutions
5 (26)
让我们先坦诚一点。 没有任何一个指标可以单独让你实现盈利。如果有人告诉你可以,那他是在向你兜售一个梦想。任何显示完美买卖箭头的指标都可以被做得看起来毫无瑕疵——只需要放大历史中的某一段并截取成功交易的截图。我们不会这样做。 SMC Intraday Formula 是一个工具。 它为你读取市场结构,标记出概率最高的价格区域,并用简单直白的语言准确告诉你当前智能资金的行为轨迹。你仍然需要做决定。你仍然需要执行交易。但现在,你是带着精确性执行,而不是靠希望。 我们已经在黄金(XAUUSD)以及主要外汇货币对的日内剥头皮交易中使用该指标将近三年。这是我们在 M1、M5、M15 和 M30 上的日常主力工具。它之所以有效,是因为它不试图预测未来——它展示的是当前正在形成的高概率交易机会,并解释 为什么 。 它与其他所有指标有什么不同? 大多数交易指标只做一件事。移动平均线交叉。振荡指标触及某个水平。出现一个箭头。你进场交易。你亏损。你责怪指标。重复。 SMC Intraday Formula 将多个机构级概念整合为一个统一的市场解读: - 斐波那契共振引擎 不只是普通的斐波那契水平——该指标
Entry Points Pro for MT5
Yury Orlov
4.52 (151)
传奇回归:Entry Points Pro 10。 这款传奇指标曾 3 年稳居 MQL5 Market 前三,如今全面重启。 数百条热情好评(两个版本合计 589 条),每天有数千名交易者用它交易,演示版下载 31,000+   MT4+MT5  次。 五年来我读过你们的每一条评价——在第 10 版里,我没有给出许诺,而是把答案直接做进了产品。指标作者自 1999 年入市, 珍视诚信、自己的声誉和自己的客户 。 Entry Points Pro 给出的入场信号严格不重绘。 而且这一次不再只是作者的一面之词,而是可验证的事实:确认信号只在 K 线收盘后标出,自动化测试记录到 零重绘 (在 EURUSD、XAUUSD 和 BTCUSD 上共 2,486,568 次不变量检查——0 次违规)。测试方法完全公开——您可以在策略测试器中自行复现。 购买后请务必第一时间给我发私信。 我会发给您 扩展版说明书《交易者圣经》 ——使用本指标交易的完整指南——并告诉您如何免费获得 赠品:市场扫描器 ,它能同时分析多个品种和多个时间周期,并在一个界面上显示 Entry Points Pro 此刻在哪里表现
Neuro Poseidon MT5
Daria Rezueva
4.75 (52)
Neuro Poseidon is a new indicator by Daria Rezueva. It combines precise trading signals with adaptive TP/SL levels - creating best possible trades as a result! Message me and get  Neuro Poseidon Assistant  as a gift to automize your trading process! What makes it stand out? 1. Proven profitability on all assets and timeframes 2. Only confirmed BUY and SELL signals present on the chart 3. Adaptive TP & SL levels generated by the software for each trade 4. Easy to understand - suitable for al
M5 Sniper
MeanFX
5 (3)
让您的交易优势尽在视野之中! M5 Sniper 是 MeanFX 推出的一款全新指标。它将 精准的交易信号 与 自适应 TP/SL 水平 相结合——从而创造出最佳的统计交易机会! 每售出 5 份,价格上涨一次,下一价格为 69$ 购买后请给我发消息,以获取技巧/指南和奖励 EA 它有哪些突出优势? 经过验证的统计表现 ,适用于 Gold XAUUSD( 几乎适用于每一种资产 ,专注于掌握一个时间周期,而不是试图面面俱到却无法获得稳定的结果) 每天每个交易品种 1 至 8 笔交易 ,具有较高的胜率百分比,并让所有统计优势站在我们这一边 图表上 仅显示已确认的 BUY 和 SELL 信号 自适应 TP 和 SL 水平 ,由指标针对每笔交易生成 平均胜率 75%+ 平均 Signal Ratio 最低 1.1+ 警报 和通知也会发送至 手机 **适合 Prop Firm(资金管理公司)**的交易方式 易于理解——适合 所有经验水平 的交易者 创作者提供的个人支持 100% 不重绘、不重新绘制、不滞后 奖励自动化 Expert Advisor(EA) 背后的策略: M5 Sniper 基于
Adaptive Price Action Engine 买指标,免费送EA 自适应多时间框架趋势与K线形态智能分析系统 市场环境始终在变化,不同的市场阶段中,并非所有 Price Action 形态都具有相同的参考价值。 Adaptive Price Action Engine 旨在适应不断变化的市场条件,将 趋势结构、多时间框架分析、K线形态与统计优化 整合到一个统一的分析框架中。 两种自适应模式 Dual Alpha Trend Mode(双 Alpha Trend 模式) 自动搜索适合的 Alpha Trend 参数,并结合低周期与高周期市场结构,使指标能够根据近期市场行为动态调整趋势识别。 Candlestick + Alpha Mode(K线 + Alpha 模式) 将 Alpha Trend 市场状态与 22种多空K线形态 相结合。系统不会简单地对所有形态一视同仁,而是对不同的形态组合进行统计评估,并识别在特定市场环境下表现出更强历史统计特征的配置。 主要功能 趋势参数自动优化 多时间框架市场状态分析 22种多头与空头 Price Action K线形态 对数千种可能
M1 Sniper MT5
Oleg Rodin
5 (7)
M1 SNIPER   是一款易于使用的交易指标系统。它是一个专为 M1 时间框架设计的箭头指标。该指标可以作为独立的系统在 M1 时间框架下进行剥头皮交易,也可以作为您现有交易系统的一部分使用。虽然该交易系统专为 M1 时间框架交易而设计,但它也可以用于其他时间框架。我最初设计此方法是为了交易 XAUUSD 和 BTCUSD。但我发现这种方法在其他市场交易中也同样有用。 指标信号既可以顺势交易,也可以逆势交易。我教授一种特殊的交易技巧,帮助您利用指标信号进行双向交易。该方法基于使用特殊的动态支撑位和阻力位区域。 购买后,您可以立即下载 M1 SNIPER 箭头指标。此外,我还为所有 M1 SNIPER 工具用户免费提供下方屏幕截图所示的 Apollo Dynamic SR 指标!这两个指标的组合可以帮助您更轻松、更准确地利用 M1 时间框架进行交易。 购买后请联系我,免费获取交易提示和奖励指标! 祝您交易成功!
Gann Made Easy MT5
Oleg Rodin
5 (11)
Gann Made Easy   是一个专业且易于使用的外汇交易系统,它基于使用先生理论的最佳交易原则。 W.D.江恩。该指标提供准确的买入和卖出信号,包括止损和获利水平。您甚至可以使用推送通知在旅途中进行交易。 购买后请联系我,即可免费获得交易指导和超棒的额外指标! 您可能已经多次听说过江恩交易方法。通常 Gann 的理论不仅对于新手交易者而且对于那些已经有一定交易经验的人来说都是非常复杂的东西。这是因为江恩的交易方法在理论上并不那么容易应用。我花了几年时间来完善这些知识,并将最好的原则应用到我的外汇指标中。 该指标非常易于应用。您所需要的只是将其附加到您的图表并遵循简单的交易建议。该指标不断进行市场分析工作并寻找交易机会。当它检测到一个好的入口点时,它会为您提供一个箭头信号。该指标还显示止损和获利水平。 换句话说,当您像先生一样进行交易时,该指标会为您提供最佳江恩建议。江恩亲自告诉你此时此刻该做什么。但最好的部分是您不需要了解任何有关江恩交易原则的知识,因为该指标会为您完成整个市场分析工作。
Auto Optimized SpeedAngle 是一款机构级的动量向量化系统,通过持续的前瞻优化(Walk-Forward Optimization, WFO)彻底消除了曲线拟合(curve-fitting)。该指标没有采用在市场 状态转换时容易失效的静态输入参数,而是利用出样外验证(Out-of-Sample, OOS) dynamically 动态重新校准设置,从而确保显示的 信号代表真正的统计优势,而非历史巧合。 核心机构级架构 前瞻优化引擎(Walk-Forward Optimization Engine): 核心算法持续扫描数千种回溯周期(lookback)与阈值组合,严格将数据划分为样本内(in-sample)和样本外(out-of-sample)。只有当参数配置在未知数据环境中证明具备数学优越性时,系统才会对其进行 adoption。 量化目标函数(Quantitative Objective Functions): 优化引擎不一味追求绝对毛利,而是聚焦于机构级的稳定性指标。用户可针对系统质量数(SQN)、期望值(每笔交易的平均 R 倍数)或净 R 值进行优化,从而优
ARIPoint
Temirlan Kdyrkhan
1 (4)
ARIPoint is a powerful trading companion designed to generate high-probability entry signals with dynamic TP/SL/DP levels based on volatility. Built-in performance tracking shows win/loss stats, PP1/PP2 hits, and success rates all updated live. Key Features: Buy/Sell signals with adaptive volatility bands Real-time TP/SL/DP levels based on ATR Built-in MA Filter with optional ATR/StdDev volatility Performance stats panel (Success, Profit/Loss, PP1/PP2) Alerts via popup, sound, push, or email Cu
Scalper Vault MT5
Oleg Rodin
5 (1)
Scalper Vault 是一套功能强大且配置完善的交易系统,专为追求日内交易稳定性的交易者而设计。 作为一套完整且独立的交易系统,该高精度指标能够为外汇和二元期权交易者提供机构级的市场分析。 购买后请联系我,获取我的独家交易技巧以及一份超值赠品! Scalper Vault 能够消除凭感觉交易和复杂的各种手动分析,让您只需专注于执行交易,并运用简单易行的交易技巧进行操作。 精准的顺势交易信号:其核心算法通过分析市场结构,仅在市场主导趋势的方向上提供高胜率信号,从而大幅减少错误的入场操作。 精确的顶部与底部探测:系统能够识别市场动能耗尽的状态,从而锁定潜在的反转区域。 基于江恩(Gann)理论的买卖区域:系统会自动绘制江恩数学市场点位,让您能清晰洞察大型机构交易者在何处寻求买入或卖出。 100% 不会重绘(Non-Repainting):一旦K线收盘,生成的信号便会永久固定在图表上。绝无动态偏移,绝无虚假信号——您在历史数据中所见,即为该指标的真实表现。 广泛的市场适用性:适用于各类货币对、黄金、指数以及加密货币交易。
Tokyo mt5 Indicator
Vasiliy Strukov
5 (10)
Tokyo Indicator(东京指标)直观地展示了趋势方向、潜在交易信号及市场状况。 其采用颜色编码的阶梯式趋势线,以蓝色标识看涨阶段,以洋红色标识看跌阶段。配套的方向箭头会在趋势发生变化时,标示出潜在的买入与卖出机会。 内置的综合仪表盘将当前信号、市场倾向、动能、波动率及信号质量整合于同一视图中,方便交易者在观察价格走势的同时评估指标数据,无需在不同面板间切换。 凭借清晰的图表显示和简洁的市场概览,Tokyo Indicator 支持以系统化的方式进行趋势分析与交易确认。 适用于任何时间周期及各类交易品种,尤其适合黄金交易。 购买后请立即联系我,以获取专属赠品!您可以免费获得我们的“强力支撑与趋势扫描”(Strong Support and Trend Scanner)指标,请私信我! 设置说明与使用手册请见此处。 请注意:我不会在 Telegram 上出售我的 EA 或特殊参数设置(set files);我的 EA 仅在 Mql5 平台上提供,而参数设置文件仅在我的博客(此处链接)上发布。请务必警惕诈骗,切勿从他人处购买任何参数设置! 设置 ShowHUD —— 在图表上显示
Entry In The Zone and SMC Multi Timeframe is a real-time market analysis tool based on Smart Money Concepts (SMC), designed to analyze market structure, price direction, and key trading zones. It supports both Single-Timeframe and Multi-Timeframe Analysis, providing a clearer view of overall market structure across multiple timeframes, with real-time BUY / SELL signals designed with a strict focus on No-Repaint principles. The signals are designed to help filter unclear setups and evaluate tradi
Trend Catcher ind mt5
Ramil Minniakhmetov
5 (18)
趨勢捕捉指標 趨勢捕捉指標結合了作者獨有的客製化自適應趨勢分析指標,用於分析市場價格趨勢。它透過過濾掉短期噪音,並專注於潛在的動能強度、波動性擴張和價格結構行為,來識別真實的市場方向。此外,它還結合了平滑和趨勢過濾等客製化指標,例如移動平均線、相對強弱指標 (RSI) 和波動率過濾器。 您可以在這裡查看實際運行情況以及我的其他產品: https://www.mql5.com/en/users/mechanic/seller 請注意,我不會在 Telegram 上出售 EA 或任何設置,那是騙局。所有設定都可以在我的部落格上免費取得。 重要提示!購買後請立即聯繫我,以獲取使用說明和額外獎勵! 請注意,我不會在 Telegram 上出售 EA 或任何設置,那是騙局。所有設定都可以在我的部落格上免費取得。
您好,交易员! 大多数散户交易者依赖于滞后的网页脚本。真正具有交易优势需要机构化的架构。 Astro AI 指标并非标准的图表叠加层。它是一个编译后的神经网络,包含两个代理,直接运行在您的终端上。 以下是该系统背后的具体技术: 1. 代理 1:分析师(图神经网络 - GNN) 市场并非孤立的价格柱;它们是相互关联的数据网络。 功能:代理 1 使用图神经网络来映射这些复杂的非线性关系。 优势:标准指标仅考虑单一的历史移动平均线,而我们的 GNN 可以实时处理深层的市场结构关系,在散户交易量发挥作用之前揭示隐藏的相关性。 2. 代理 2:执行器(近端策略优化 - PPO) 模式识别只是成功的一半。基于当前市场波动做出正确的决策,才是预测模型与滞后模型之间的区别所在。 功能:代理 2 使用 PPO(一种先进的强化学习算法)来确定最佳入场点。 优势:它持续调整交易策略,而非使用静态的“超买”或“超卖”线。它会分析当前市场状况并计算最可能的成交点。 执行桥接:通过 ONNX 集成到交易终端 如果执行速度慢,模式识别就毫无用处。我们已通过 ONNX(开放神经网络交换平台)
Divergence Bomber
Ihor Otkydach
4.89 (94)
购买该指标的每位用户将额外免费获得以下内容: 原创工具“Bomber Utility”,该工具会自动跟踪每一笔交易,设置止损和止盈点,并根据策略规则自动平仓; 适用于不同交易品种的指标设置文件(Set 文件); 三种不同风险模式下的 Bomber Utility 设置文件:“最低风险”、“平衡风险” 和 “观望策略”; 一套详细的 视频操作手册,帮助您快速完成安装、配置并开始使用本交易系统。 注意: 要获取以上所有赠品,请通过 MQL5 的私人消息系统联系卖家。 我为您介绍原创的自定义指标 “Divergence Bomber”(背离轰炸机),它是一套基于 MACD 背离交易策略 的“全功能”交易系统。 该技术指标的主要任务是识别 价格与 MACD 指标之间的背离,并发出交易信号(包括推送通知),指示未来价格可能的运动方向。平均而言,这些信号的准确率超过 98%。有关该指标如何工作的详细说明,请观看本页面上的视频演示。 该系统使用 止损订单 和 动态回撤平仓机制 来管理交易。 Divergence Bomber 指标的主要特点: 支持交易的品种: AUDCAD、AUDCHF、AUDS
Unix Scalper
Issam Kassas
4 (4)
Unix Scalper — MetaTrader 5 购买后,请在 MQL5 上给我发消息,即可免费获得 Smart Universal Expert Advisor,以及在线课程、PDF 手册和私人群组访问权限。 发现交易形态,看清交易计划,选择执行方式。 UNIX Scalper 将市场分析、BUY/SELL/WAIT 决策以及 Entry、Stop Loss、TP1 和 TP2 水平集中在一个清晰的面板中。 看清信号与交易计划 • 明确的决策:BUY、SELL 或 WAIT。 • 明确的价格水平:Entry、Stop Loss、TP1 和 TP2。 • 多时间周期概览:比较面板中各时间周期的信号。 • 辅助分析:趋势、动量、成交量、波动率、支撑与阻力,以及市场质量。 • 灵活的布局:Minimized、Compact、Standard 或 Full。 查看信号,检查价格水平,再判断该交易形态是否符合您的交易规则。 从黄金和比特币开始 建议首先使用的交易品种:XAUUSD 和 BTCUSD。 探索短期剥头皮交易和较高时间周期分析。选择历史K线范围,通过表现曲线查看所选设置
PainX GainX Blue Spike Fusion AI Advanced Synthetic Index Spike Detection Indicator for MetaTrader 5 Discover potential spike setups with a clear, organized, and professional trading interface. PainX GainX Blue Spike Fusion AI is a specialized indicator designed for traders who monitor synthetic indices and want a structured way to observe potential price spike opportunities. The indicator combines signal monitoring, market-condition analysis, visual alerts, and event tracking in one convenient
Volatility Master for MetaTrader is a real-time dashboard tool that scans up to  50 symbols  to identify high-volatility , trending markets instantly. With bullish/bearish signals, customizable alerts, and a user-friendly interface, it helps you avoid range-bound conditions and focus on high-probability trades. Clarity leads to confidence. Trade confidently and protect your capital effectively with this powerful dashboard. We don't offer free or bonus indicators in exchange of reviews from you.
Quantum TrendPulse
Bogdan Ion Puscasu
5 (26)
介绍 Quantum TrendPulse   ,这是一款终极交易工具,它将 SuperTrend   、   RSI 和 Stochastic 的强大功能整合到一个综合指标中,以最大限度地发挥您的交易潜力。该指标专为追求精准和效率的交易者而设计,可帮助您自信地识别市场趋势、动量变化以及最佳进入和退出点。 主要特点: 超级趋势整合: 轻松跟随当前的市场趋势并乘上盈利浪潮。 RSI 精度: 检测超买和超卖水平,非常适合把握市场逆转时机,可用作 SuperTrend 的过滤器 随机精度: 利用随机振荡在波动的市场中寻找隐藏的机会, 用作超级趋势的过滤器 多时间范围分析: 从 M5 到 H1 或 H4,在不同时间范围内关注市场动态。 可定制的警报: 当您的自定义交易条件得到满足时收到通知,这样您就不会错过任何交易。 无论您是新手还是经验丰富的交易员,   Quantum TrendPulse 都能为您提供所需的优势,帮助您增强策略并自信地进行交易。借助这一强大的指标,将洞察力转化为利润 — 掌控您的交易! ***购买 Quantum TrendPulse,即可免费获得 Quantum Tr
Atomic Analyst MT5
Issam Kassas
4.48 (62)
Atomic Analyst — MetaTrader 5 购买后,请在 MQL5 上给我发消息,即可免费获得 Smart Universal Expert Advisor,以及在线课程、PDF 手册和私人群组访问权限。 Atomic Analyst 将价格行为、趋势方向、入场和出场信号、止损位及多个止盈位集中呈现在图表上。 看清信号,理解交易形态 Atomic Analyst 将分析结果整理为清晰的可视化信息: • 买入和卖出箭头,用于识别潜在的入场机会。 • 止损位和多个止盈位,帮助规划交易。 • 趋势、强度和动量读数,用于评估市场方向。 • 多时间周期分析,用于比较更广泛的市场背景。 • 彩色K线和提醒,帮助您跟踪变化的市场条件。 结合辅助分析查看信号,再判断该交易形态是否符合您的交易规则。 从短期形态到更大级别的行情 您可以将 Atomic Analyst 用于剥头皮交易、日内交易,或跟踪持续时间更长的市场走势。 建议从 H1 时间周期开始。建议交易品种包括 EURUSD、AUDUSD 和 XAUUSD。 从信号到自动化 Smart Universal Expert A
FiboSniper Pro
Van Minh Nguyen
5 (3)
FiboSniper Pro – Multi-Filter Fibonacci System with Auto SL/TP and Control Panel FiboSniper Pro 是一款技术指标,将动态 Fibonacci Envelopes 与多个确认过滤器相结合,以生成经过筛选的 Buy 和 Sell 信号。Fibonacci 水平基于 Moving Average 和 ATR 计算,然后通过 ADX、EMA、RSI、ATR、Volume、Time 和 Candle 结构进行过滤。该指标直接在图表上显示基于 ATR 自动计算的 Stop Loss 和 Take Profit 水平,并提供交互式控制面板,以便快速调整参数。 购买后,请联系我以获取推荐的设置文件和详细使用说明。 使用 Auto Trader X 自动执行 FiboSniper Pro 信号: [Auto Trader X] 用户指南和设置文件: [Click here] 完整文档请参阅产品博客: [Click here] 加入官方频道获取最新更新: [Click here] 专为偏好结构化入场和清晰风险管理
Break and Retest Hunter
Mohamed Hassan
5 (1)
Break and Retest Hunter is a powerful MetaTrader 5 indicator designed to automatically identify support and resistance levels, breakout structures, and potential retest opportunities in real time. Bonus Indicator: After purchasing Break and Retest Hunter , contact me to receive Trade Indicator Assistant EA completely free as a bonus utility. $65 for the next 10 copies . Next price is $120.  Combining adaptive market analysis, clear BUY/SELL signals, Fibonacci-based profit targets, and a premiu
介绍     Quantum Breakout PRO   ,突破性的 MQL5 指标,正在改变您交易突破区域的方式!由拥有超过13年交易经验的资深交易员团队开发,     量子突破 PRO     旨在通过其创新和动态的突破区域策略将您的交易之旅推向新的高度。 量子突破指标将为您提供带有 5 个利润目标区域的突破区域的信号箭头,以及基于突破框的止损建议。 它既适合新手交易者,也适合专业交易者。 量子 EA 通道:       点击这里 重要的!购买后请私信我领取安装手册。 建议: 时间范围:M15 货币对:GBPJPY、EURJPY、USDJPY、NZDUSD、XAUUSD 账户类型:ECN、Raw 或 Razor,点差极低 经纪商时间:GMT +3 经纪商:IC Markets、Pepperstone with Raw 和 Razor 的点差最低 规格: 不重漆! 最多 5 个建议利润目标区域 建议止损水平 可定制的盒子。您可以设置自己的 Box Time Start 和 Box Time End。 接触 如果您有任何疑问或需要帮助,请通过私人消息与我联系。
FX Power MT5 NG
Daniel Stein
5 (33)
FX Power:分析货币强度,助您做出更明智的交易决策 概述 FX Power 是一款专业工具,帮助您全面了解主要货币和黄金在任何市场条件下的真实强度。通过识别强势货币用于买入,弱势货币用于卖出, FX Power 简化了交易决策,并帮助您发现高概率的交易机会。不论您是想跟随趋势还是通过极端的 Delta 值预测反转,这款工具都能完美适应您的交易风格。别再盲目交易——用 FX Power 让您的交易更加智慧。 1. 为什么 FX Power 对交易者极具价值 实时货币和黄金强度分析 • FX Power 实时计算并显示主要货币和黄金的相对强度,助您全面了解市场动态。 • 监控领先或落后资产,轻松识别值得交易的货币对。 全面的多时间框架视图 • 跟踪短期、中期和长期时间框架的货币和黄金强度,以便将您的交易策略与市场趋势保持一致。 • 无论是快进快出的短线交易还是更长期的投资策略, FX Power 都能为您提供所需的信息。 Delta 动态分析用于趋势和反转 • 极端 Delta 值常常预示反转机会,而平缓的 Delta 变化则确认趋势延续。 • 使用 Delta 分析,轻
PZ Divergence Trading MT5
PZ TRADING SLU
3.71 (7)
棘手的发现和频率稀缺是最可靠的交易方案之一。该指标使用您喜欢的振荡器自动查找并扫描常规和隐藏的发散。 [ 安装指南 | 更新指南 | 故障排除 | 常见问题 | 所有产品 ] 容易交易 发现常规和隐藏的分歧 支持许多知名的振荡器 根据突破实现交易信号 显示适当的止损和获利水平 可配置的振荡器参数 可自定义的颜色和尺寸 按条形过滤大小差异 实现绩效统计 它实现了电子邮件/声音/视觉警报 为了提供广阔的市场前景,可以使用不同的振荡器在同一张图表中多次加载该指标,而不会产生干扰。该指标支持以下振荡器: RSI CCI MACD OSMA 随机 动量 很棒的振荡器 加速器振荡器 威廉姆斯百分比范围 相对活力指数 由于差异可能会扩大很多,尤其是在外汇市场中,因此该指标产生了转折:它在等待交易突破之前等待donchian突破确认差异。最终结果是带有非常可靠的交易信号的重新粉刷指示器。 输入参数 幅度:用于寻找差异的之字形周期 振荡器-选择要加载到图表的振荡器。 突破期-交易信号的突破期,以柱为单位。 发散类型-启用或禁用发散类型:隐藏,常规或两者。 最小散度单位为条形-最小散度单位为条形
Gartley Hunter Multi
Siarhei Vashchylka
5 (12)
Gartley Hunter Multi - An indicator for searching for harmonic patterns simultaneously on dozens of trading instruments and on all possible timeframes. Manual (Be sure to read before purchasing) | Version for MT4 Advantages 1. Patterns: Gartley, Butterfly, Shark, Crab. Bat, Alternate Bat, Deep Crab, Cypher 2. Simultaneous search for patterns on dozens of trading instruments and on all possible timeframes 3. Search for patterns of all possible sizes. From the smallest to the largest 4. All fou
筛选:
无评论
回复评论