GravityField
- Göstergeler
- Sürüm: 2.0
- Etkinleştirmeler: 5

GravityField 2.0 — Multi-Timeframe Newtonian Force Indicator
What if price had gravity?
Every FVG imbalance and swing liquidity level pulls price toward it — just like mass attracts mass. GravityField 2.0 measures that pull using Newton's inverse-square law (F = G·m/r²): the bigger the zone, the closer the price, the stronger the force. The indicator combines all active zones across 19 timeframes simultaneously and delivers a single net reading: which direction is price being pulled right now, and how hard.
This is not pattern recognition. It does not redraw. It computes physics.
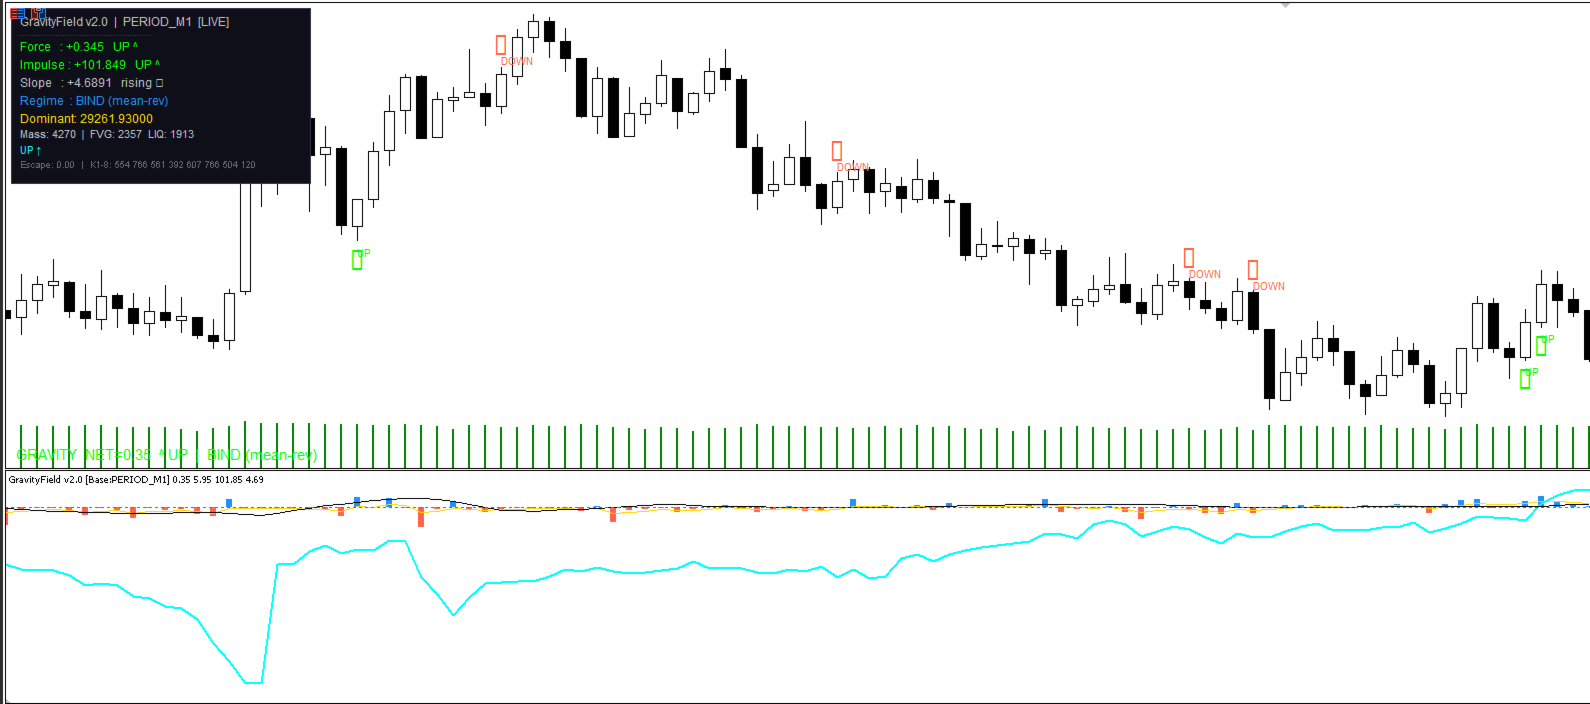
What you get on your chart
A separate indicator window with four lines:
- NetForce histogram (blue/red) — the raw gravitational pull of all zones at this exact moment. Blue = net pull upward. Red = net pull downward. Bar height = intensity.
- ForceSignal (gold) — a smoothed EMA of NetForce. Filters noise. Watch for crossovers with zero.
- NetImpulse (aqua) — the accumulated force over the last N bars. This is momentum: where has the net pull been going recently?
- ImpulseSlope (black) — the rate of change of Impulse. Rising = momentum building. Falling = fading.
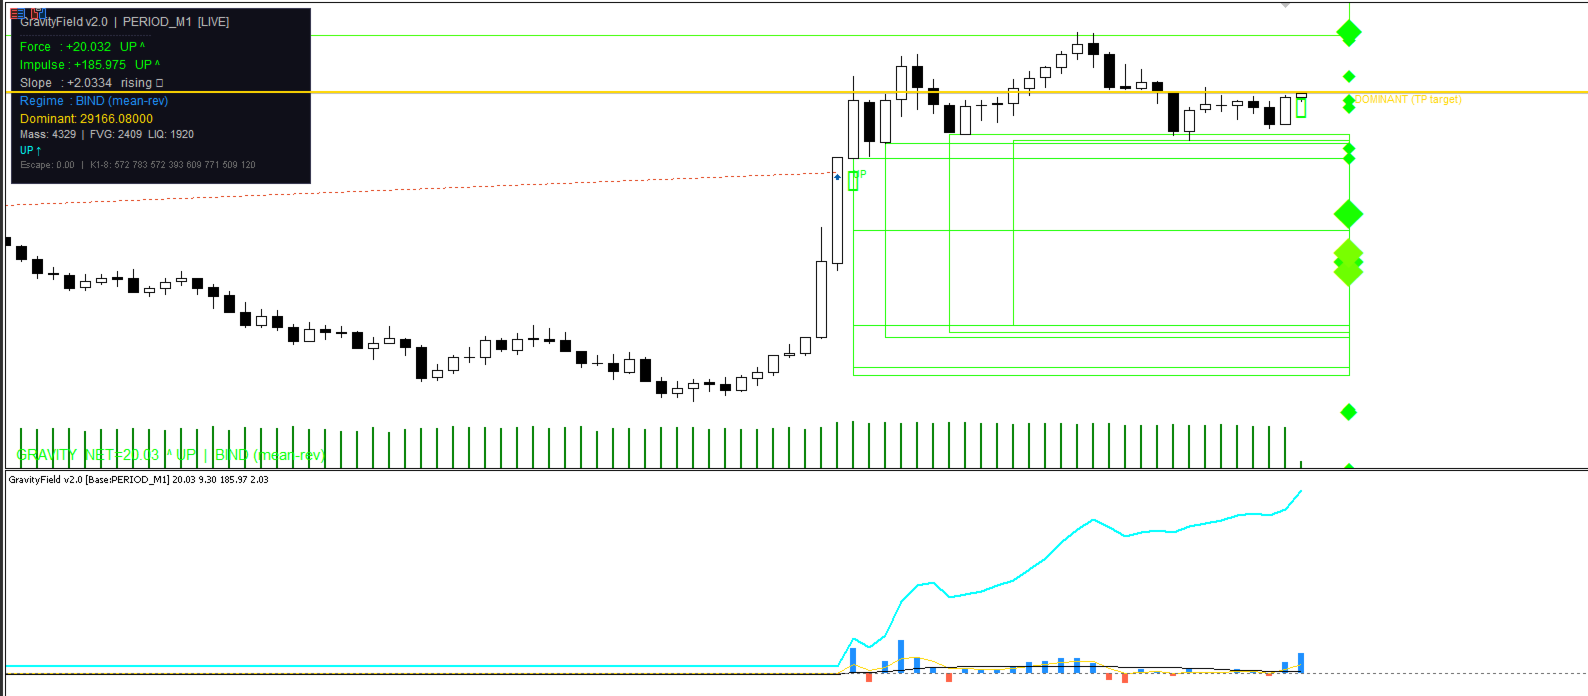
On the main chart: zone boxes color-coded by mass (green = light, yellow = medium, red = heavy), a dominant gravity target line (the highest-mass zone — a natural TP candidate), and BUY/SELL signal arrows.
A live panel shows Force, Impulse, Slope, Regime, Dominant price, and active mass count.
The regime system — BIND vs ESCAPE
Borrowed directly from orbital mechanics. If price is moving slower than the escape velocity of the gravitational field, it stays trapped: BIND = mean-reverting conditions. If price breaks escape velocity, it has left the gravitational field: ESCAPE = trending conditions.
This tells you how to trade the signal. In BIND regime, fade extremes and target the Dominant zone. In ESCAPE, trade with the force direction and trail.
BUY / SELL signals
A signal fires only when Impulse direction and Slope direction agree simultaneously — when accumulated force and its acceleration point the same way. Signals are transition-based: the same direction does not re-fire until it resets to neutral. This prevents signal spam.
Signals can optionally trigger alerts, push notifications, and sound.
Multi-timeframe architecture
Zones from all 19 timeframes (M1 through D1) are grouped into 8 clusters. Each cluster carries a different base weight using the golden ratio (φ): M1–M3 is the lightest, D1 is the heaviest. A D1 FVG dominates the gravitational field the way Jupiter dominates the solar system — but a nearby M5 FVG at close range still matters because of the inverse-square law. You control exactly which timeframes contribute. Disable what you don't need.
| Cluster | Timeframes | Weight |
|---|---|---|
| 1 — Micro | M1, M2, M3 | ×1.0 |
| 2 — Low1 | M4, M5, M6, M10 | ×1.6 |
| 3 — Low2 | M12, M15, M20 | ×2.6 |
| 4 — Mid1 | M30, H1 | ×4.2 |
| 5 — Mid2 | H2, H3 | ×6.9 |
| 6 — Upper1 | H4, H6 | ×11.1 |
| 7 — Upper2 | H8, H12 | ×17.9 |
| 8 — Macro | D1 | ×29.0 |
Session filtering
All calculations are session-aware. You define up to 6 killzones by NY time. ATR, FVG sourcing, liquidity sourcing, and signal generation each have independent session toggles. Run the indicator clean during your session, carry values outside it.
No repainting. No future leak.
FVGs are confirmed on bar close. Liquidity levels require Swing_Strength bars on each side before confirming. No zone is used before its formation bar closes.
Why GravityField uses a custom ATR — not iATR
The standard ATR built into MetaTrader uses True Range: the maximum of (high−low), |high−prev_close|, and |low−prev_close|. This means overnight gaps and weekend gaps count as volatility. A Monday gap on EURUSD inflates the standard ATR for the entire week — with noise you weren't trading through.
GravityField uses a purpose-built Session ATR with three deliberate differences:
1 — High minus low only, no True Range.
Gap between Friday close and Monday open is not volatility you can trade. Session ATR measures only the bar's actual traded range: high − low. This gives a cleaner reading of intrabar movement.
2 — Session-bound calculation.
Session ATR only counts bars that fall inside your active ATR killzone. The moment a bar lands outside the session, the calculation stops at the boundary. It does not look across the gap to the previous session. Each session's ATR reflects only that session's conditions.
3 — Out-of-window hold.
When price is outside the ATR session (overnight, weekend, off-hours), Session ATR carries the last known value forward unchanged. It does not decay or reset — it waits for the next session bar.
Why this matters for the physics:
Every distance and mass calculation normalizes by ATR:
This is the "distance" a zone is from price, expressed in units of current volatility. A gap-inflated ATR makes every zone appear artificially closer in normalized space, weakening its gravitational pull incorrectly. Session ATR gives a volatility unit that reflects only the market conditions you are actually trading in — making force readings consistent and comparable across different instruments and sessions.
Standard ATR measures how much the market moved including gaps. Session ATR measures how much the market traded during your hours. For a physics model built on intraday price structure, the second number is the one that matters.
Parameter guide
Every parameter has a physical or statistical reason. None are arbitrary knobs.
Recommended settings by trading style:
| Parameter | Scalping (M1–M5) | Intraday (M15–H1) | Swing (H4–D1) |
|---|---|---|---|
| Active clusters | 1–3 | All (1–8) | 4–8 |
| MTF_Bars | 150–200 | 250–350 | 200–300 |
| FVG_Decay_TFbars | 25–35 | 40–55 | 60–90 |
| Liq_Decay_TFbars | 20–30 | 35–45 | 50–70 |
| Impulse_Window | 15–20 | 25–35 | 40–60 |
| Slope_Bars | 8–12 | 12–18 | 20–30 |
| Calc_Bars | 390–600 | 1170 | 500–800 |
Individual parameter explanations:
- Base_TF — The reference timeframe for ATR and physics. M1 is recommended for all chart types: it gives the finest-grain ATR and ensures force is computed against the most up-to-date price.
- MTF_Bars — How many bars back each timeframe scans for FVG and liquidity sources. Higher = more historical zones = heavier computation. 300 is the balanced default.
- FVG_Decay_TFbars — How many bars of that timeframe before an FVG loses half its mass. A D1 FVG decays far slower than an M5 FVG. This parameter is in that timeframe's own bars — so 50 on D1 means 50 trading days; 50 on M5 means 250 minutes.
- Liq_Decay_TFbars — Same decay logic for liquidity levels. Liquidity tends to refresh faster than FVGs, so setting this slightly lower (e.g. 40 vs 50) is typical.
- MinGap_ATR — Minimum FVG size to qualify as a mass source, expressed in ATR units. Keeps micro-noise out of the calculation. Leave at 0.05 unless your instrument has unusually thin candles.
- Softening_Floor_ATR — Prevents infinite force when price sits exactly on a zone center. Leave at default (0.10) unless you see extreme spikes.
- Impulse_Window — How many NY-session bars to sum for the Impulse reading. Larger = slower, more stable. Smaller = faster, more reactive.
- Slope_Bars — The lookback for the linear regression slope of Impulse. Minimum 2 (simple difference). 15 is the balanced default for intraday.
- Velocity_Period — How many Base_TF bars to use for measuring current price velocity (for escape velocity calculation). 5–10 is typical.
- Max_Masses — Memory limit for mass objects. At 8000 (default) you will never hit this on normal instruments. On very active symbols with all TFs enabled, increase to 12000 if the Experts log shows a warning.
Compatible with
Any liquid instrument. Best performance on FX majors (EURUSD, GBPUSD, USDJPY, XAUUSD) with NY session killzones active. Crypto works — disable session filters or widen killzones to cover 24h hours.
Honest limitations
GravityField measures the current gravitational landscape — it does not predict price. A strong upward force means price is being pulled toward zones above, not that it will definitely reach them. Use it to understand context and confluence, not as a standalone entry trigger. The Dominant line is the highest-mass zone, making it a natural magnet for price, but it requires your own confirmation before trading toward it.