Triple Crox Strategy

Triple Crox Strategy v4.10
⚙ Triple Crox Strategy v4.10
Professional MetaTrader 5 Indicator
13 Patterns • Fibonacci • CLUSTER ML • Multi-Filter

1. Overview

Advanced MT5 indicator combining 13 Pattern Detection, Fibonacci Analysis, CLUSTER Machine Learning and Multi-Filter system for precise signals on Forex, indices, commodities, crypto. 5-step pipeline: indicators → filter → patterns → signals → levels.

2. Trading Setup

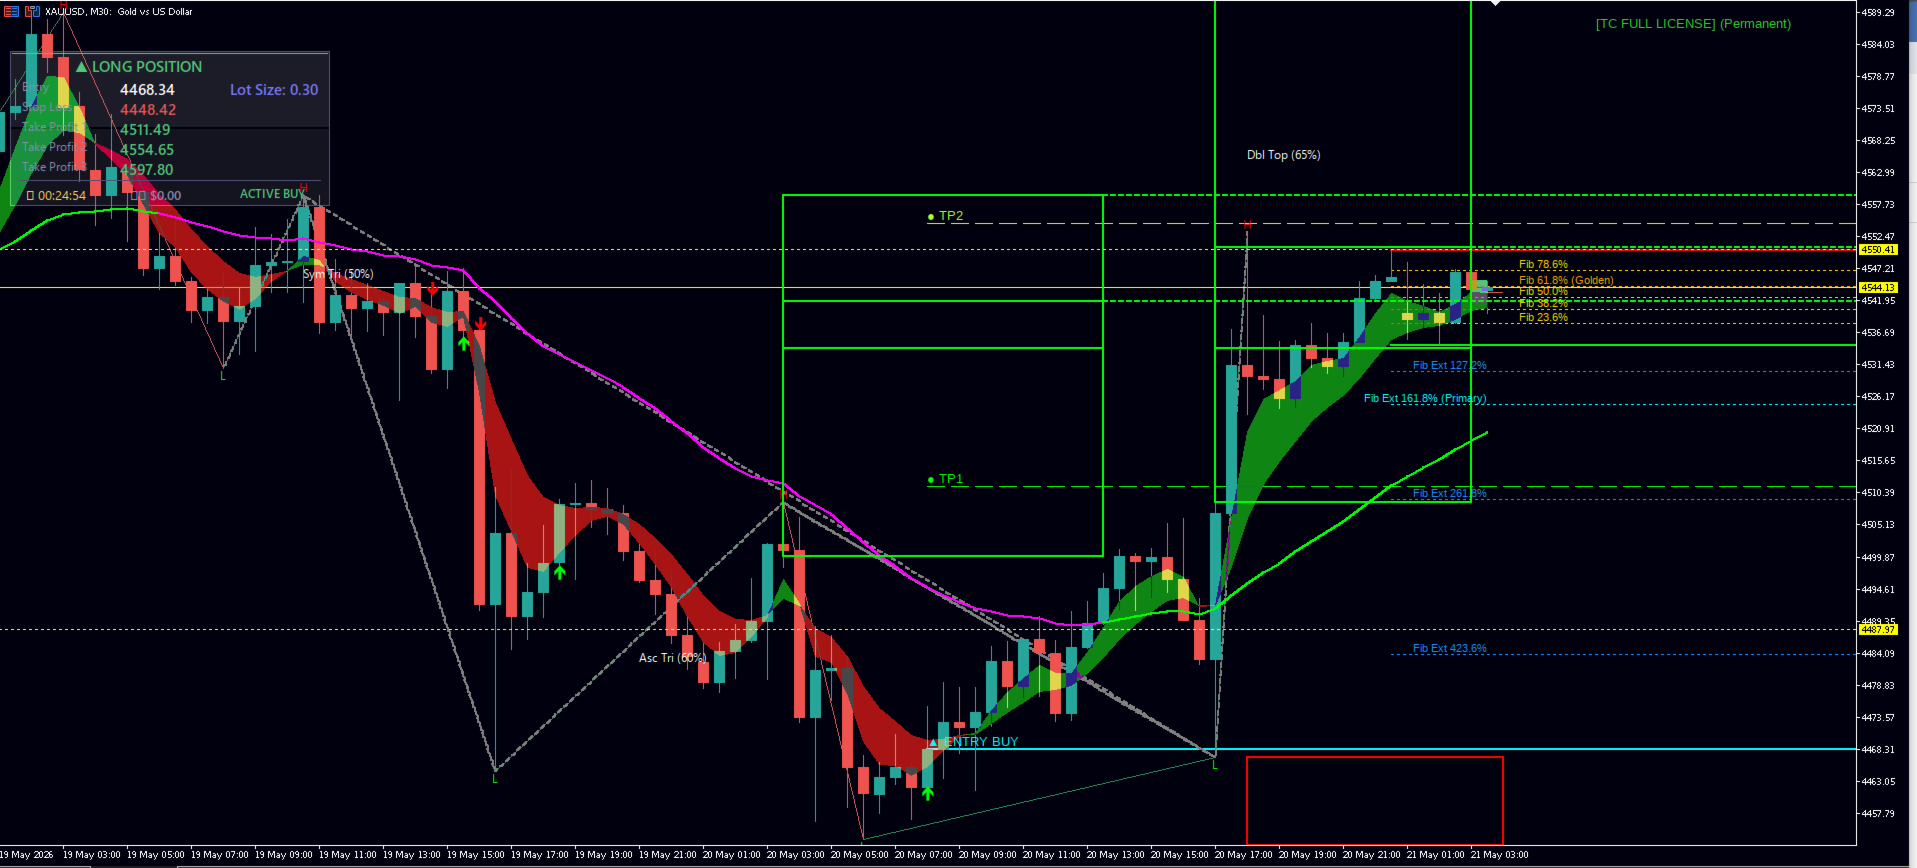
Heikin-Ashi colored bars. Buy/Sell arrows with Entry, TP1(1x ATR), TP2(2x), TP3(3x), SL(1.5x) as horizontal lines. Momentum bars at bottom. 13 filters validate signals.

3. Visual Components

Arrows: ▲Buy/▼Sell + dashed lines
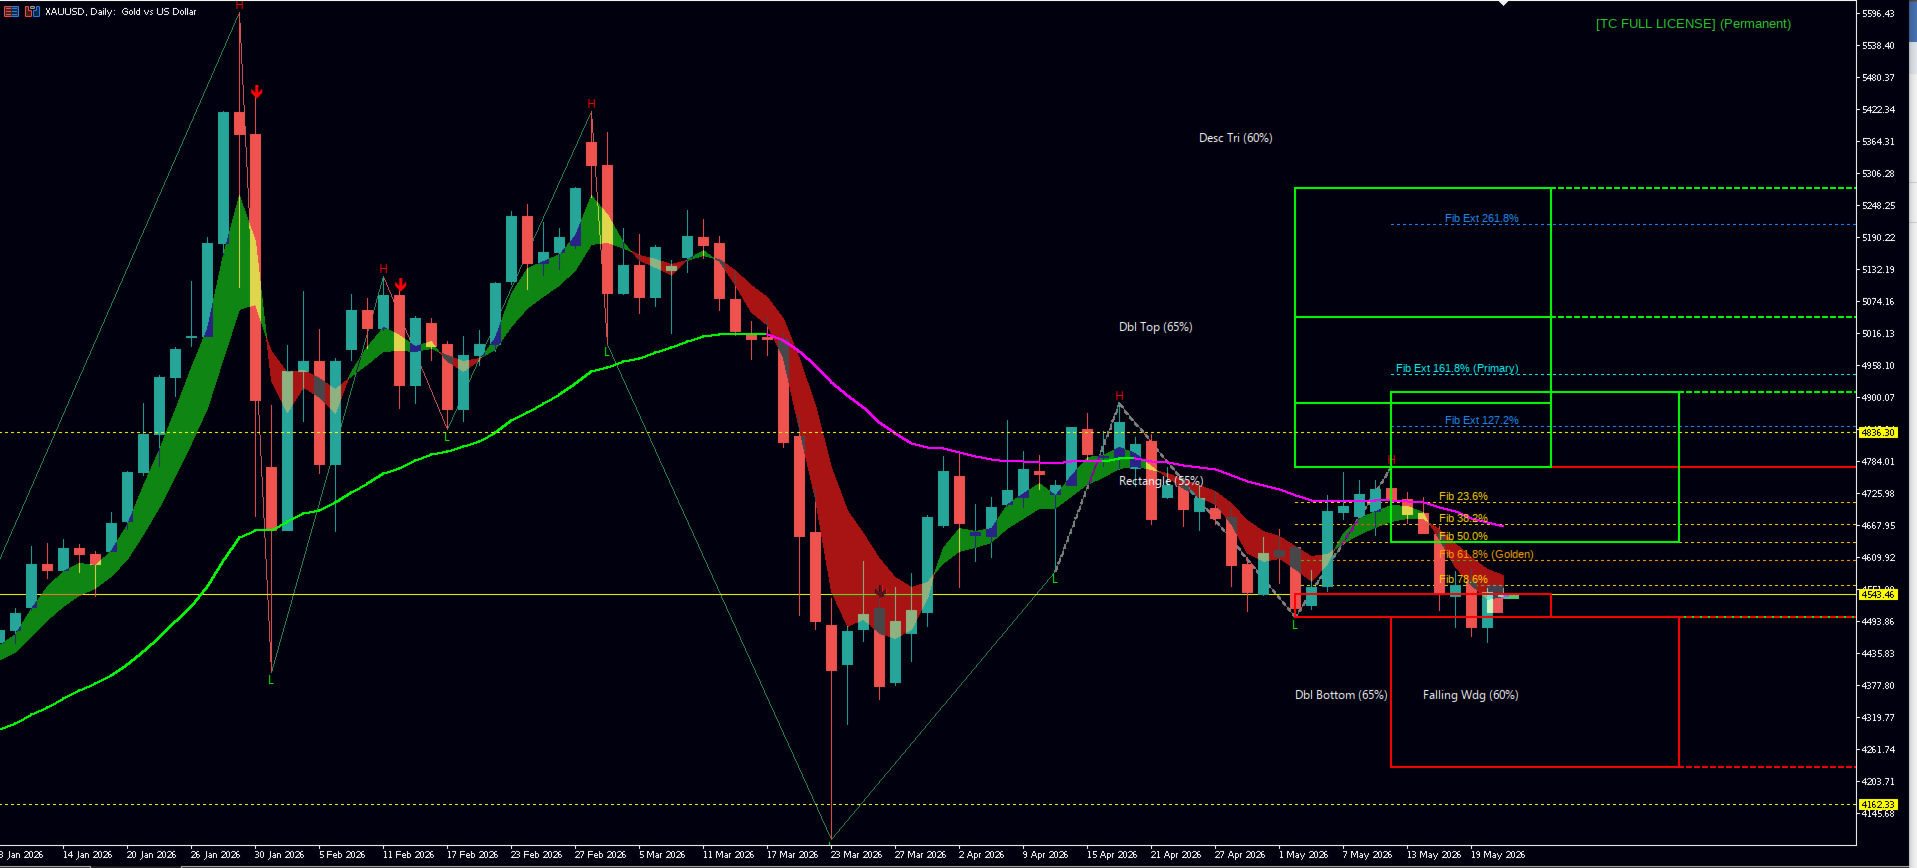
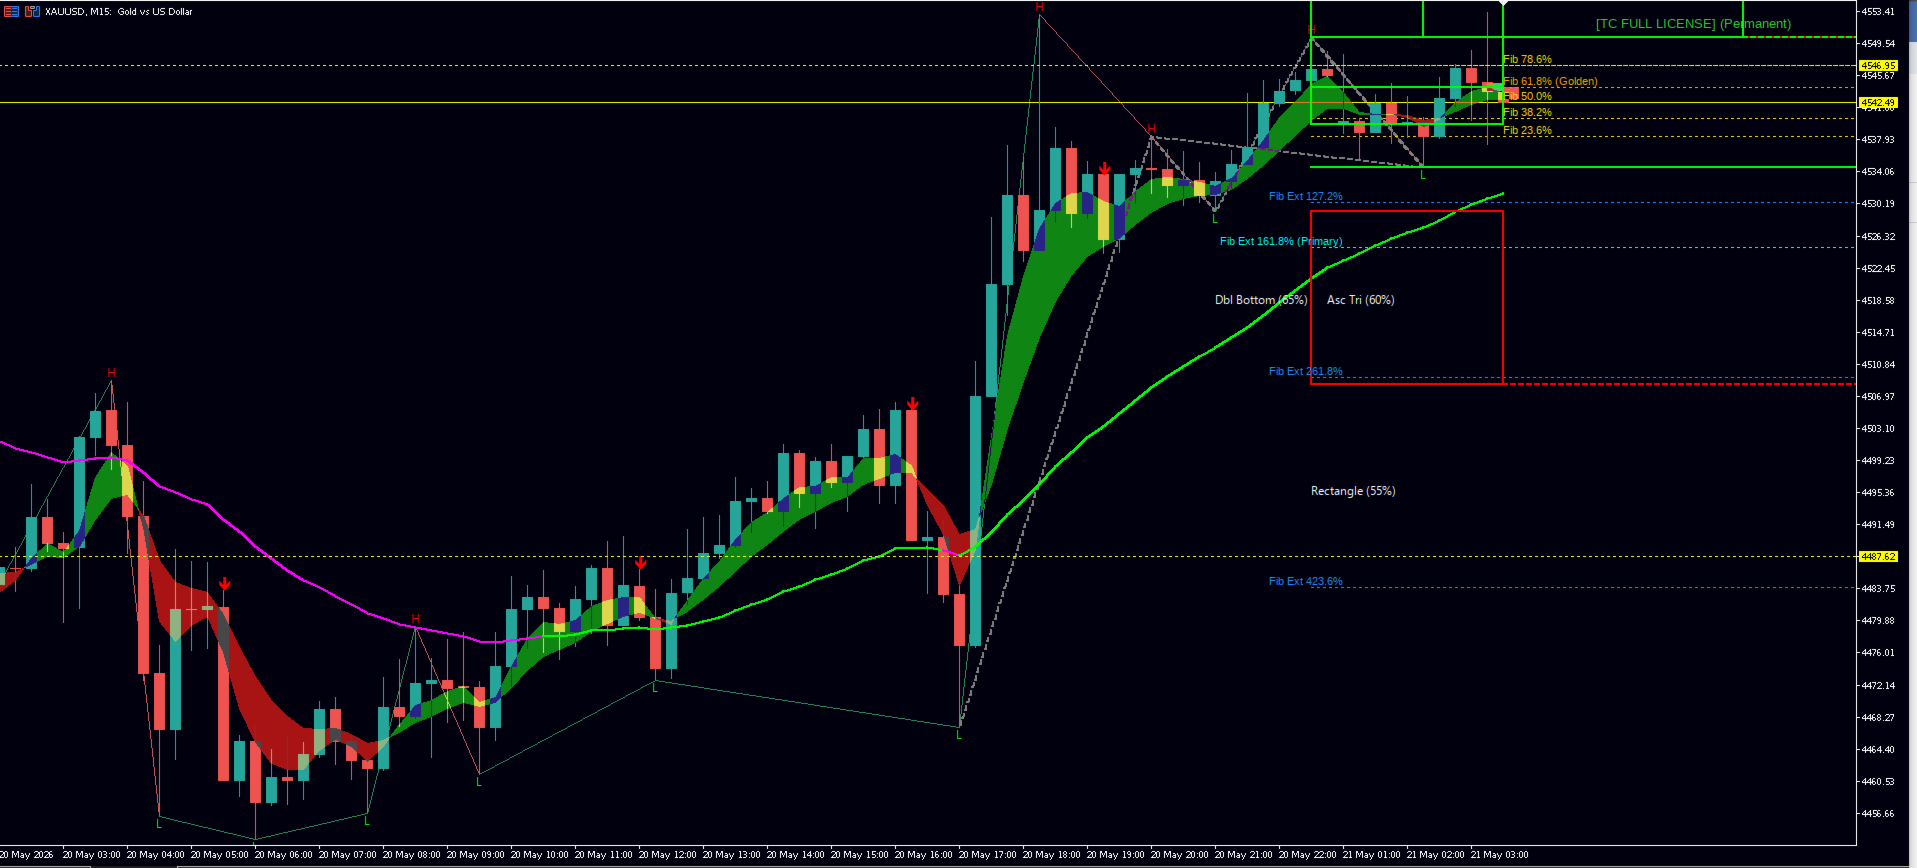
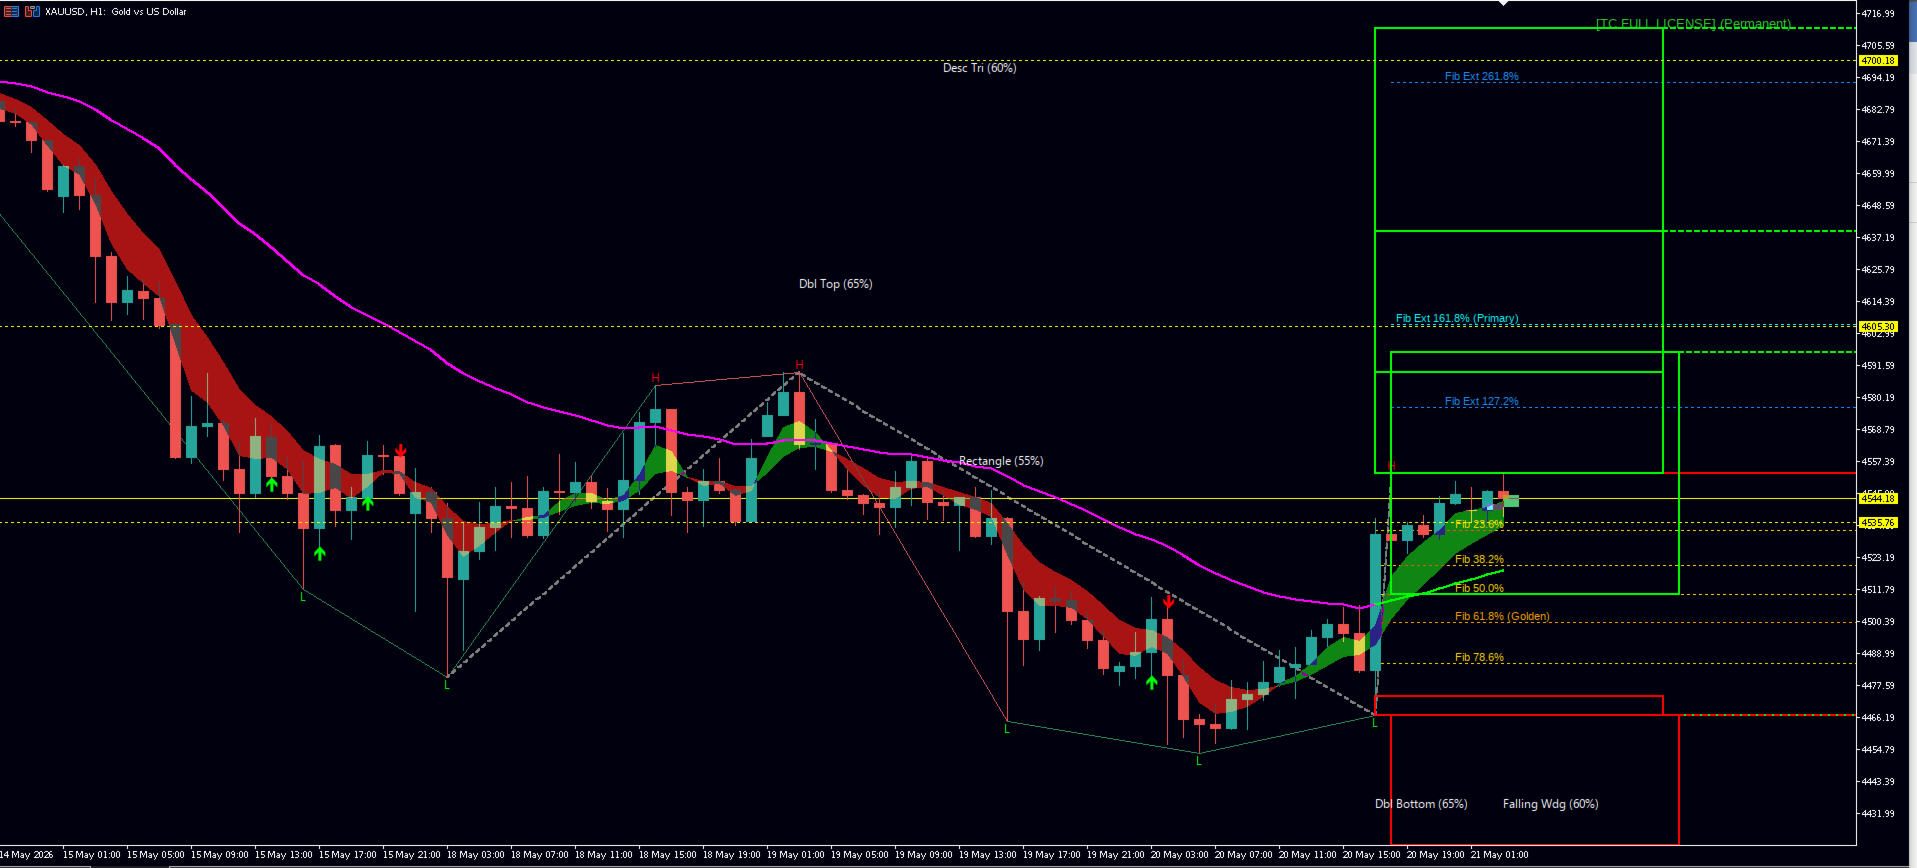
EMA Cloud(3): Green=bull, Red=bear (8,21,50)
Ribbon: Green(Fast>Slow)=bull, Magenta=bear
DEMA-ATR: Green=up, Red=down
Fibonacci: Retrace, Extend, Golden Zone(38.2-61.8%)
13 Patterns: Lines, labels, breakout zones, ZigZag
Dashboard: Real-time on-chart panel

4. Risk Management

TP/SL Types: ATR, Trailing, Options. Profit/Stop Factor adjusts risk-reward. ATR auto-adapts to volatility. Lines: TP=green, SL=red, Entry=gold.

5. 13 Filter Types

Simple: ATR | CCI | ATR/CCI OR | ATR/CCI AND | None
Lateral: Sideways ATR/CCI OR | Sideways ATR/CCI AND
Advanced: DEMA-ATR Trend | Cloud Dir | Ribbon Align | ATR Expand | CCI Zero Cross
Composite: Cloud+CCI | Ribbon+ATR | Multi-Filter Strict

6. 13 Pattern Detection

ZigZag engine (configurable swing/tolerance). Bearish: H&S, Double Top, Descending Triangle, Bearish Flag, Rising Wedge. Bullish: Inv.H&S, Double Bottom, Ascending Triangle, Bullish Flag, Falling Wedge. Breakout: Sym.Triangle, Rectangle. Neckline + target + breakout zones.

7. Fibonacci Analysis

Retracements: 23.6, 38.2, 50, 61.8, 78.6%. Extensions: 127.2, 161.8, 261.8, 423.6%. Golden Zone(38.2-61.8%) highlighted. Time Zones + Confluence Filter + independent Swing Strength.

8. CLUSTER ML

Unsupervised ML classifies market by volatility, trend, momentum, acceleration. 3-7 clusters configurable. High-confidence regimes get extra weight. Real-time per-bar updates.

9. Operation Pipeline

S1: CCI, ATR, 3 EMAs, DEMA-ATR, Ribbon MA
S2: Multi-layer filter (Cloud+Ribbon+DEMA+CCI+Fibonacci)
S3: Pattern detection + CLUSTER ML
S4: Generate Buy/Sell when aligned
S5: Entry/TP1-3/SL, draw lines, update dashboard

10. Visual Guide

Cloud: Green=bull, Red=bear | Ribbon: Green=bull, Magenta=bear | DEMA-ATR: Green=buy, Red=sell | HA: Green/Red. All aligned=strong bias; mixed=caution.

11. Dashboard

Total Trades, Win Rate, W/L Ratio, Profit Factor, Max Drawdown, Total Return, Equity, Current Signal, DEMA-ATR Status, Weekly/Monthly Performance.

12. Themes & Positions

5 Themes: Elegant, Light, Dark, Green, Blue. 4 Positions: Top-Left, Top-Right, Bottom-Left, Bottom-Right.

13. Notifications

Pop-up, Push, Email, Sound(WAV), Telegram bot. Anti-Spam cooldown. Pattern breakout alerts.

14. Strengths

► Multi-TF | 13 Patterns | Full Fibonacci | CLUSTER ML | 13 Filters | HA+Cloud+Ribbon | Risk Mgmt | 5 Themes | Multi-Channel Alerts | Multi-Language(EN/FR/AR) | Real-Time Stats | Triple Crox License

15. Recommendations

All Forex, indices, commodities, crypto. 1-2% risk. H1+ timeframes. Start with Multi-Filter Strict. Backtest first. Combine Fibonacci + patterns. Monitor dashboard.

16. Support

Contact for technical help, customization, license, bug reports. Continuous updates.

⚙ Triple Crox Strategy v4.10
Your Intelligent Trading Partner
© Triple Crox. All rights reserved. MetaTrader 5.
Önerilen ürünler
ZigZag SMC Premium MT5
Kallebe Lins De Oliveira Santos
If you are looking for precision in identifying strategic tops and bottoms, the ZigZag SMC/SMT Indicator for MT5 is the tool that will contribute to your technical analysis. Developed based on the advanced concepts of Smart Money Concepts (SMC) and Smart Money Trap (SMT), it offers an insight into market behavior, helping you make decisions. What will you find in this indicator? Automatic identification of strategic tops and bottoms Based on institutional strategies Ideal for analyzing liqu
TCT BB PANEL - Bollinger Bands Dashboard MASTER VOLATILITY WITH BOLLINGER BANDS The TCT BB PANEL monitors Bollinger Bands, identifying volatility squeezes and price extremes. WHAT YOUR DASHBOARD DISPLAYS Account: Balance, Equity, Profit, Drawdown Positions: Buys, Sells, Total BB: Upper, Middle, and Lower Bands Milestones: Detection, Last Touched, Next
RBreaker
Zhong Long Wu
RBreaker Gold Indicators is a short-term intraday trading strategy for gold futures that combines trend following and intraday reversal approaches. It not only captures profits during trending markets but also enables timely profit-taking and counter-trend trading during market reversals. This strategy has been ranked among the top ten most profitable trading strategies by the American magazine   Futures Truth   for 15 consecutive years. It boasts a long lifecycle and remains widely used and st
HAshi-E is an enhanced way to analyze Heiken-Ashi signals. Briefing: Heiken-Ashi is particularly valued for its ability to filter out short-term volatility, making it a preferred tool for identifying and following trends, helps in decision-making regarding entry and exit points, and assists in distinguishing between false signals and genuine trend reversals. Unlike traditional candlestick charts, Heiken-Ashi candles are calculated using average values of previous bars, creating a smoother, mo
Trend Direction Up Down Indicator Trend Direction Up Down is part of a series of indicators used to characterize market conditions. Almost any strategy only works under certain market conditions. Therefore it is important to be able to characterize market conditions at any time: trend direction, trend strength, volatility. Trend Direction Up Down is an indicator to be used to characterize trend direction (medium term trend): trending up trending down ranging Trend Direction Up Down is based
This indicator plots buy and sell signals based on pattern which I have discovered over the year. When I entered trading world, I started with chart patterns. whole day I used identify patterns plot them. Take screenshot. After practicing for years and trading patterns. My eyes started to see patterns that repeat over and over again. Chart pattern and candles sticks both. New Patterns. Over time I got to know few pattern were already discovered by somebody else. These are my own pattern which 
STRICTLY FOR BOOM INDEX ONLY!!!!! Here I bring the Maximum Trend Arrows OT1.0 MT5 indicator. This indicator is made up of a combination of different trend indicators for entries and exits, for entries an orange arrow will paint on the chart below the current market and a red flag for closing of trades and it produces buy arrows only. When the orange arrow appears, it will appear along with it's sound to notify you. The 1H timeframe is recommended, don't use it anywhere else than on the 1H timefr
# RSI Pro Alert - Advanced RSI Indicator A powerful professional-grade RSI indicator with intelligent alerts, scheduled snapshots, and multi-dimensional notifications to help you capture market opportunities with precision! --- ## Key Features ### Smart Signal Detection - **Precision Cross Detection** : Automatically identifies critical moments when RSI crosses overbought/oversold levels - **State Tracking Mechanism** : Real-time monitoring of market state changes (Overbought/Overso
Divergent Stochastic Filter II Catch Reversals Early, Filter Noise, Trade with Confidence The Edge: Why This Stochastic is Different  Every trader knows the Stochastic oscillator. But knowing when to trust its signals, that's the real challenge. The Divergent Stochastic Filter II transforms this classic indicator into a precision reversal detection system by adding critical elements: divergence intelligence, signal filtering and exhaustion detection.  While standard Stochastic oscillators fire s
Flag Pattern Angelo
Brighton Mufaro Mudzingwa
Brandon Angelo Flag Pattern — how it works This indicator automatically detects classic bull and bear flag chart patterns in real time. The detection happens in three stages for each bar. First it looks for a flagpole — a sharp, strong directional move over a configurable number of bars ( FlagpoleBars , default 5) that must exceed a minimum percentage size ( FlagpoleMinPct ). For a bullish flag the pole must close net higher than it opened; for a bearish flag, net lower. Second it identifies th
Gapscalper AI
Ruben Octavio Gonzalez Aviles
3.57 (14)
Gapscalper AI , yapay zeka destekli gelişmiş bir alım satım algoritmasıdır. Adil Değer Boşluklarını (FVG) akıllıca tespit eder ve bunları geleneksel teknik analizle birleştirerek fiyat hareketlerini yüksek doğrulukla tahmin eder. Temelinde, özel olarak eğitilmiş bir pekiştirmeli öğrenme modeli bulunmaktadır. Bu model, gizli piyasa verimsizliklerini belirlemek ve dinamik işlem yürütme stratejileri ile bunlardan yararlanmak için dikkatle tasarlanmıştır. Bu yenilikçi yaklaşım, EA'nin yüksek olasılı
Trend Direction ADX indicator Trend Direction ADX is part of a serie of indicators used to characterize market conditions. Almost any strategy only work under certain market conditions. Therefore it is important to be able to characterize market conditions at any time: trend direction, trend strength, volatility, etc.. Trend Direction ADX is an indicator to be used to characterize trend direction: trending up trending down ranging Trend Direction ADX is based on ADX standard indicator. Tre
Key Candlepatterns
Raphael Lorenz Baumgartner
Key Candlepatterns Platform: MetaTrader 5 Type: Custom Indicator Display: Chart Window (Candlestick Overlay) Functions: Detects and color-codes specific candlestick patterns based on candle shape, relative position, and ATR filters. Candles receive distinct colors depending on type (e.g. inside bar, outside bar, engulfing, hammer, shooting star, etc.). Visual patterns can help traders identify where buyers or sellers are likely active . Turning points (e.g., hammer followed by confirmation) are
Gold Trader Pro is an advanced analytical tool specifically engineered for professional trading on XAUUSD (Gold). It provides an immediate comprehensive overview of market structure across 7 different timeframes, allowing traders to identify flow direction and signal strength through a modern, draggable, and interactive interface. Key Features Multi-Timeframe Analysis: Real-time monitoring of M1, M5, M15, M30, H1, H4, and D1. Two Operational Modes: MODE_SCALPING: Optimized for fast-paced analys
FREE
Heiken Ashi Smoothed Strategy is a very simple but powerful system to get forex market trend direction. This indicator is actually 2 indicators in 1 pack, Heiken Ashi and Heiken Ashi Smoothed Moving Average both included. Because HA (Heiken Ashi) and HAS (Heiken Ashi Smoothed) are calculated in the same one system event with necessary buffers and loop only, so it is the FAST, OPTIMIZED and EFFICIENT HA having the combined indicator of MetaTrader 5. You can choose to display HA and HAS in the sam
QuantXMarketScanner is a multi assets indicator for MT5 - Mathematical model based on 7 custom moving averages indicators  - Adaptable on Currencies, Stocks and Crypto - Automatic setup, self optimized About QuantXsystem Products: –         Simple installation & integration into MT5   –         Unlimited License after purchase (for one user) –         Automatic pattern recognition to identify the best timing and price levels. –         Trading indicators are displayed directly and automaticall
Limitless MT5
Dmitriy Kashevich
Limitless MT5 is a universal indicator suitable for every beginner and experienced trader. works on all currency pairs, cryptocurrencies, raw stocks Limitless MT5 - already configured and does not require additional configuration And now the main thing Why Limitless MT5? 1 complete lack of redrawing 2 two years of testing by the best specialists in trading 3 the accuracy of correct signals exceeds 80% 4 performed well in trading during news releases Trading rules 1 buy signal - the ap
MA Catcher Pro
Tiago Muniz Glicerio
MA Catcher Pro - 2025 Edition ===================================== Indicator Type: Moving Average Crossover Alert (MetaTrader 5) Version: 1.0 (2025) Platform: MetaTrader 5 (.mq5) -------------------------------------------------------------- OVERVIEW -------------------------------------------------------------- MA Catcher Pro is a professional-grade trend detection indicator that alerts you whenever a Fast Moving Average crosses a Slow Moving Average.  It provides visual, sound, and push not
HAshi-E, Heiken-Ashi sinyallerini analiz etmenin gelişmiş bir yoludur. Brifing: Heiken-Ashi özellikle kısa vadeli dalgalanmaları filtreleme kabiliyeti nedeniyle değerlidir, bu da onu trendleri belirlemek ve takip etmek için tercih edilen bir araç haline getirir, giriş ve çıkış noktalarına ilişkin karar vermeye yardımcı olur ve yanlış sinyaller ile gerçek trend dönüşlerini ayırt etmeye yardımcı olur. Geleneksel mum grafiklerinin aksine, Heiken-Ashi mumları önceki çubukların ortalama değerleri
Chỉ báo này sẽ thông báo cho bạn nếu cấu hình xu hướng thành công. Tín hiệu theo xu hướng không nên được tăng theo, nhưng tín hiệu mua ở mức giá thấp theo mô hình giao dịch thông thường của bạn, hoặc tín hiệu bán ở mức giá tốt, là một lựa chọn rất tốt. Hãy thiết lập nó trên khung thời gian lớn hơn và theo dõi các khung thời gian nhỏ hơn, bám sát các xu hướng chính. Tôi thường thiết lập ba khung thời gian gần nhau nhất và không bao giờ đi ngược tín hiệu của INdicator này. INdicator   này không có
Bu göstergeye benzersiz ve keskin bir avantaj kazandıran kavramlar, en iyi mentorlardan biri olan Arjo tarafından tasarlanıp derlenen "Adil Değer Boşlukları Teorisi"ne dayanmaktadır ve ben de açıklanan kavramlara geliştirme yönünü ekledim. Video serisi, kapsamlı açıklamalar için orijinal YouTube bağlantılarını ve derlenmiş MT4/5 sisteminin çalışır durumdaki ekran görüntülerini içerecektir. Yayınlanan tüm sistemler, tüm platformlara ve kullanıcı isteklerine uyum sağlamak için MT4 ve MT5'te ayrı a
Tma Poc Gold
Ignacio Agustin Mene Franco
POC + TMA SCALPER GOLD - Expert Advisor Professional DESCRIPTION: Automated trading system designed specifically for XAU/USD, combining Point of Control (POC) with Triangular Moving Average (TMA) to identify high-volume and trending zones. It uses advanced risk management with dynamic trailing stops and an intelligent grid system. TECHNICA
DAILY OH/OL SDEV QUANT MODEL - STATISTICAL TRADING WITH PRECISION RISK MANAGEMENT TRADE WITH MATHEMATICAL CERTAINTY - KNOW YOUR EXACT STOP-LOSS AND TAKE-PROFIT BEFORE YOU ENTER This indicator analyzes 5,000+ days of price history to give you: Exact entry levels (sigma bands locked at daily open) Exact stop-loss distance (from M
Automated Trendlines MT5
Georgios Kalomoiropoulos
Trend çizgileri, forex ticaretinde en önemli teknik analiz aracıdır. Ne yazık ki, çoğu tüccar onları doğru şekilde çizmez. Otomatik Trend Çizgileri göstergesi, piyasaların trend hareketini görselleştirmenize yardımcı olan ciddi tüccarlar için profesyonel bir araçtır. İki tür Trend Çizgisi, Boğa Trend Çizgisi ve Ayı Trend Çizgisi vardır. Yükseliş trendinde, Forex trend çizgisi, fiyat hareketinin en düşük salınım noktalarından geçer. En az iki "en düşük düşük"ü birleştirmek, bir trend çizgisi o
MercariaPattern1-2-3 відстежує рух ціни, знаходить трьоххвильові структури 1-2-3 та підсвічує момент, коли сценарій підтверджується пробоєм ключового рівня. MercariaPattern1-2-3 tracks price movement, detects three-leg 1-2-3 structures and highlights the moment when the scenario is confirmed by a key level breakout. Індикатор збирає локальні свінги в компактну фігуру 0–1–2–3 , чекає підтвердженого пробою та будує стрілку входу з готовими рівнями SL/TP. The indicator combines local swings into a
Synthetic Trend AI
Vitali Vasilenka
5 (3)
Sentetik Trend AI - Yapay Zeka Destekli Akıllı Bir Trend Göstergesi Sentetik Trend AI göstergesi, klasik Süper Trend formülünü yapay zeka algoritmaları (k-En Yakın Komşular, KNN) ve hacim analiziyle birleştiren güçlü bir teknik analiz aracıdır. Piyasayı daha derinlemesine incelemek ve daha güvenli kararlar almak isteyenler için tasarlanmıştır. Sentetik Trend AI'yı benzersiz kılan özellikler: Yapay Zeka trend tahmini: Geçmiş verileri analiz etmek ve fiyat hareketinin yönünü tahmin etmek için K
FREE
Axiom Point
Tatiana Savkevych
Axiom Point — Precision Structural Breakout Indicator Axiom Point is a high-performance analytical indicator designed to identify high-probability reversal zones using price-action behaviour and adaptive balance filtering. The indicator applies a multi-layer analytical model to detect moments when price transitions beyond its normal equilibrium area, indicating a potential shift in market momentum. Unlike conventional trend-following tools, Axiom Point focuses on so-called points of no return —
The Zain GOLD indicator
Haitham Gamal Abdelnaser Mohamed
Specializing in (All brokers supported): Professional Trading Tools Want the same tools used by professional traders? Get them now and start dominating the markets! Join our premium communities for free: Specializing in (All brokers supported): Gold (XAUUSD) - Unmatched accuracy Forex Pairs - Comprehensive global market coverage Binary Options - Highly accurate signals ️ Synthetic Derivatives - Trade pairs using Drive Cryptocurrencies - Professional cryptocurrency trad
KasTon Trend System: The Complete 2-in-1 Trading Strategy Identify the Trend, Confirm the Signal, and Trade with Confidence! Do you suffer from confusion while trading? Do you find it difficult to determine the market's direction? Are you tired of losing money on false signals? The KasTon Trend System is here as an integrated solution to all these problems. This is not just an indicator; it is a complete trading strategy built on the synergy of two powerful, custom-built indicators. Our main g
WanaScalper
Isaac Wanasolo
1 (1)
A scalping indicator based on mathematical patterns, which on average gives signals with relatively small SL, and also occasionally helps to catch big moves in the markets (more information in the video) This indicator has three main types of notifications: The first type warns of a possible/upcoming signal on the next bar The second type indicates the presence of a ready signal to enter the market/open a position The third type is for SL and TP levels - you will be notified every time price re
Bu ürünün alıcıları ayrıca şunları da satın alıyor
PrimeScalping
Temirlan Kdyrkhan
PrimeScalping is a powerful trading companion designed to generate high-probability entry signals with dynamic TP/SL/DP levels based on volatility. Built-in performance tracking shows win/loss stats, PP1/PP2 hits, and success rates — all updated live. Key Features: Buy/Sell signals with adaptive volatility bands Real-time TP/SL/DP levels based on ATR Built-in MA Filter with optional ATR/StdDev volatility Performance stats panel (Success, Profit/Loss, PP1/PP2) Alerts via popup, sound, push, or e
ARIPoint
Temirlan Kdyrkhan
1 (1)
ARIPoint is a powerful trading companion designed to generate high-probability entry signals with dynamic TP/SL/DP levels based on volatility. Built-in performance tracking shows win/loss stats, PP1/PP2 hits, and success rates all updated live. Key Features: Buy/Sell signals with adaptive volatility bands Real-time TP/SL/DP levels based on ATR Built-in MA Filter with optional ATR/StdDev volatility Performance stats panel (Success, Profit/Loss, PP1/PP2) Alerts via popup, sound, push, or email Cu
SmartScalping
Temirlan Kdyrkhan
SmartScalping is a powerful trading companion designed to generate high-probability entry signals with dynamic TP/SL/DP levels based on volatility. Built-in performance tracking shows win/loss stats, PP1/PP2 hits, and success rates — all updated live. Key Features: Buy/Sell signals with adaptive volatility bands Real-time TP/SL/DP levels based on ATR Built-in MA Filter with optional ATR/StdDev volatility Performance stats panel (Success, Profit/Loss, PP1/PP2) Alerts via popup, sound, push, or e
TrendProMaster
Temirlan Kdyrkhan
MasterTrend Indicator for MT5 A powerful trend-following and signal-evaluation tool MasterTrend   is a custom MT5 indicator that combines Moving Averages and ATR-based risk/reward logic to generate clear buy/sell signals. It visualizes dynamic SL/TP levels, evaluates past trade outcomes, and displays win/loss statistics in a clean on-chart panel. Key features include: Buy/Sell signals based on MA crossovers ATR-based SL/TP1/TP2/TP3 levels with visual lines and labels Signal outcome tracking wit
ARICoins
Temirlan Kdyrkhan
ARICoin is a powerful trading companion designed to generate high-probability entry signals with dynamic TP/SL/DP levels based on volatility. Built-in performance tracking shows win/loss stats, PP1/PP2 hits, and success rates all updated live. Key Features: Buy/Sell signals with adaptive volatility bands Real-time TP/SL/DP levels based on ATR Built-in MA Filter with optional ATR/StdDev volatility Performance stats panel (Success, Profit/Loss, PP1/PP2) Alerts via popup, sound, push, or email Cust
AriX
Temirlan Kdyrkhan
1 (4)
AriX Indicator for MT5 A powerful trend-following and signal-evaluation tool AriX is a custom MT5 indicator that combines Moving Averages and ATR-based risk/reward logic to generate clear buy/sell signals. It visualizes dynamic SL/TP levels, evaluates past trade outcomes, and displays win/loss statistics in a clean on-chart panel. Key features include: Buy/Sell signals based on MA crossovers ATR-based SL/TP1/TP2/TP3 levels with visual lines and labels Signal outcome tracking with real-time stat
ZIVA Signal Intelligence
Hassan Abdullah Hassan Al Balushi
ZIVA Signal Intelligence An Adaptive, Modular Market Intelligence System ZIVA Signal Intelligence is not positioned as a conventional trading indicator. It is a fully integrated, proprietary market intelligence system engineered to deliver structured, high-precision interpretation of price behavior within a controlled analytical environment. Developed through an independent architectural approach, ZIVA does not rely on, derive from, or replicate existing indicators. It represents a standalone
CGE Trading Suite
Carl Gustav Johan Ekstrom
5 (2)
Institutional-Grade Analytics for MT5 C GE Trading Suite delivers the analytical edge typically reserved for professional trading desks. The platform integrates a full suite of analytical tools into one seamless workflow: dynamic grid mapping, liquidity behavior analysis, ECM, trend lines, MIDAS, trade cycles, and directional channel projections. Together, these provide a unified view of market structure and momentum. Directional clarity is further enhanced by the daily capital flow index, whic
IVISTscalp5
Vadym Zhukovskyi
5 (6)
[iVISTscalp5]: Zaman Üzerinden Piyasa Davranışını Araştırma Laboratuvarı TLV Framework | Liquidity Activation Points ⸻ Genel Açıklama iVISTscalp5, VISTmany projesi kapsamında geliştirilen çok katmanlı bir zamanlama ve fiyat yapısı göstergesidir. Sistem, Liquidity Activation Points (timings) aracılığıyla: hareket zamanı yön hareket aralığını tahmin eder. iVISTscalp5 göstergesi, varsayılan parametrelerle herhangi bir finansal enstrümanda kullanılabilir. ⸻ Pratik Değer iVISTsca
Red and Green Light – Intelligent Trading Signal Indicator Product Overview Red and Green Light is a professional trading signal indicator based on the multi-stage T3 smoothing algorithm. It integrates a visual traffic light system, intelligent signal recognition, risk alerts, and multiple notification features. Whether you're a manual trader or an Expert Advisor (EA) developer, this indicator helps you capture market opportunities with greater precision and effectively avoid the risks of
The Expert Advisor and the video are attached in the Discussion tab . The robot applies only one order and strictly follows the signals to evaluate the indicator efficiency. Pan PrizMA CD Phase is an option based on the Pan PrizMA indicator. Details (in Russian). Averaging by a quadric-quartic polynomial increases the smoothness of lines, adds momentum and rhythm. Extrapolation by the sinusoid function near a constant allows adjusting the delay or lead of signals. The value of the phase - wave s
Классификатор силы тренда. Показания на истории не меняет. Изменяется классификация только незакрытого бара. По идее подобен полной системе ASCTrend, сигнальный модуль которой, точнее его аппроксимация в несколько "урезанном" виде, есть в свободном доступе, а также в терминале как сигнальный индикатор SilverTrend . Точной копией системы ASCTrend не является. Работает на всех инструментах и всех временных диапазонах. Индикатор использует несколько некоррелируемых между собой алгоритмов для класси
FFx Universal Strength Meter PRO is more than a basic strength meter. Instead of limiting the calculation to price, it can be based on any of the 19 integrated strength modes + 9 timeframes. With the FFx USM, you are able to define any period for any combination of timeframes. For example, you can set the dashboard for the last 10 candles for M15-H1-H4… Full flexibility! Very easy to interpret... It gives a great idea about which currency is weak and which is strong, so you can find the best pai
The FFx Universal MTF alerter shows on a single chart all the timeframes (M1 to Monthly) with their own status for the chosen indicator. 9 indicators mode (MACD-RSI-Stochastic-MA-ADX-Ichimoku-Candles-CCI-PSAR). Each can be applied multiple times on the same chart with different settings. Very easy to interpret. Confirm your BUY entries when most of the timeframes are showing green color. And confirm your SELL entries when most of the timeframes are showing red color. 2 Alert Options : input to s
The FFx Watcher PRO is a dashboard displaying on a single chart the current direction of up to 15 standard indicators and up to 21 timeframes. It has 2 different modes: Watcher mode: Multi Indicators User is able to select up to 15 indicators to be displayed User is able to select up to 21 timeframes to be displayed Watcher mode: Multi Pairs User is able to select any number of pairs/symbols User is able to select up to 21 timeframes to be displayed This mode uses one of the standard indicators
FFx Patterns Alerter gives trade suggestions with Entry, Target 1, Target 2 and StopLoss .... for any of the selected patterns (PinBar, Engulfing, InsideBar, OutsideBar) Below are the different options available: Multiple instances can be applied on the same chart to monitor different patterns Entry suggestion - pips to be added over the break for the entry 3 different options to calculate the SL - by pips, by ATR multiplier or at the pattern High/Low 3 different options to calculate the 2 TPs -
MetaTrader 4 version available here : https://www.mql5.com/en/market/product/24881 FFx Basket Scanner is a global tool scanning all pairs and all timeframes over up to five indicators among the 16 available. You will clearly see which currencies to avoid trading and which ones to focus on. Once a currency goes into an extreme zone (e.g. 20/80%), you can trade the whole basket with great confidence. Another way to use it is to look at two currencies (weak vs strong) to find the best single pairs
MetaTrader 4 version available here: https://www.mql5.com/en/market/product/25793 FFx Pivot SR Suite PRO is a complete suite for support and resistance levels. Support and Resistance are the most used levels in all kinds of trading. Can be used to find reversal trend, to set targets and stop, etc. The indicator is fully flexible directly from the chart 4 periods to choose for the calculation: 4Hours, Daily, Weekly and Monthly 4 formulas to choose for the calculation: Classic, Camarilla, Fibonac
ClassicSBA
Umri Azkia Zulkarnaen
this indicator very simple and easy if you understand and agree with setup and rule basic teknical sba you can cek in link : please cek my youtube channel for detail chanel : an for detail info  contact me  basicly setup buy (long) for this indicator is Magenta- blue and green candle or magenta - green  and green candlestik and for setup sell (short) is Black - yellow - and red candle or black - red  and red candlestik
Pendiente de Precio
Cesar Juan Flores Navarro
Indicador en base a la pendiente de la linea de precio, dibuja una línea de color cuando sube a base de los precios que previamente has sido procesados o linealizados, y cuando baja la pendiente la linea linealizada toma otro color. En este caso se a considerado 6 lineas de diferentes procesos desde pendientes largas hacia las cortas, observándose que cuando coincidan las pendientes se produce un máximo o mínimo, lo que a simple vista nos permitirá hacer una COMPRA O VENTA.
Fibonacci Multiple 12
Cesar Juan Flores Navarro
Fibonacci Múltiple 12, utiliza la serie fibonacci plasmado en el indicador fibonacci, aumentadolo 12 veces según su secuencia. El indicador fibonacci normalmente muestra una vez, el presente indicador se mostrara 12 veces empezando el numero que le indique siguiendo la secuencia. Se puede utilizar para ver la tendencia en periodos cortos y largos, de minutos a meses, solo aumentado el numero MULTIPLICA.
Recommended TimeFrame >= H1. 100% Non Repainted at any moment.  Use it carefully, only with Trend Direction. Trading Usage: 2 Variants: as Range System or as BreakOut System (Both Only With Trend Direction)::: (Always use StopLoss for minimise Risk); [1] as Range System: (Recommended) in UP TREND:  - BUY in Blue Line , then if price goes down by 50 points (on H1) open Second BUY.   Close in any Profit you wish: TrailingStop(45 points) or Close when Price touches upper Gold Line. in DOWN TREND
En base a cálculos matemáticos de determino una linea Horizontal que cruza a todas las señales de trading, mostrando los máximos y mínimos. La linea horizontal parte en dos las subidas y bajadas de las señales de trading, de tan manera que es fácil identificar los máximos y mínimos, y es inteligente por que es sensible a las subidas y bajadas, afín de no quedarse en un solo lado por siempre, trabaja excelentemente con otros indicadores suavizadores ya que les garantiza que en un intervalo de tie
Spike Detector
Tete Adate Adjete
this indicator is a Spike detector indicator, it is specially designed to trade Boom 1000, Boom 500, Crash 1000 and Crash 500 We recommend using it on Deriv Boom and Crash indices only Its setting is intuitive, familiar, easy to use it has notification functions; audible notifications and push notifications. this tool is simple to use, easy to handle This update is based on different strategies for spikes
Escalera Inteligente
Cesar Juan Flores Navarro
Indicador en MQL5, recibe la información del precio SUAVIZADO, lo procesa anulando los picos inteligentemente, y el resultado lo envía al desarrollo de la escalera que iniciara y subirá o bajara según el peldaño o INTERVALO ingresado Ingreso PERIODO = 50 (variar segun uso) Ingreso MULTIPLICA AL PERIODO = 1 (variar segun uso) Segun la configuración la escalera puede pegarse o separarse de los precios,, Se aplica toda la linea de tiempo, y a todas las divisas, etc.  
Fibonacci Suavizado
Cesar Juan Flores Navarro
Indicador en MQL5, que obtiene el promedio de 10 EMAS, que son alineadas según Fibonacci, obteniendo un promedio, que sera suavizado.  Se puede ingresar un numero desde 2 a N, que multiplica a los EMA-Fibonacci. Funciona en cualquier criptomoneda, etc. etc... pudiendo calcular el futuro segun la tendencia de las EMAS. Funciona excelentemente en tramos largos, determinando exactamente el mejor inicio/salida. El precio inicial por apertura sera por un periodo de tiempo, luego aumentará.
QuantXSTocks Trading Range Indicator for MT5: INSTRUCTIONS TO USE OUR INDICATOR:- User needs to take trade on Arrow or after an Arrow CandleStick, You can achieve up-to 35-125 pips target by this Indicator. Best Timeframes for Stocks and Indices are M30 and H1: AMAZON M30 (50 pips) TESLA M30 (50 pips) APPLE M30 (50 pips) ADOBE M30 (50 pips) NASDAQ100 H1 (125 pips) The above are the approximate amount of pips you can achieve by this Indicator, Green arrow appears to be buy arrow while the Red ar
Super Suavizador
Cesar Juan Flores Navarro
Indicador en MQL5 que obtiene el promedio de 10 EMAS que son alineadas y procesadas según Fibonacci luego el promedio es suavizado"  Se ingresa un número de 2 a N que multiplica los EMA-Fibonacci y por consiguiente aumenta los fibonacci, resultando un promedio.   Se ingresa un número que suaviza los EMA-Fibonacci. Considerando los números 1/1 seria la suavización minima. Considerando los números 3/5 seria la suavización media. Considerando los números 10/30 seria la suavización alta.....etc
Trend and Signals MT5  indicator scans  30 trading Instruments (Forex, Metals and Indices).     It uses special algorithm on the  current market   based on   Pure Price Action   and display the overall trend and signal on the dashboard. When signals are produced the indicator sends alert and notification. Strategy for Signals This indicator uses the daily timeframe to determine the direction of the trend. The hourly timeframe is used to identify possible entries. Main trend and is determined by
This indicator is based on a mathematical formula and an ANN combined, designed to make a model(using previous prices) of the most recent market condition (any chart*) in order to use the model as a forecasting tool. *This indicator can operate on any chart/timeframe, but it's suggested you use multiple timeframes for each trade because this method relies solely on the time factor, you can not use this indicator to predict price volatility, but if it's fit correctly it will show you when the nex
Yazarın diğer ürünleri
GannTools
issam rahhal sabour
GannTools Indicator The GannTools Indicator is a powerful trading tool inspired by W.D. Gann's strategies. This indicator provides traders with dynamic support and resistance levels, trend analysis, and key price patterns using Gann angles and cycles. Key Features: Customizable Gann Fans, Angles, and Cycles for precise market analysis. Automatic identification of key price levels and trend directions. Works on all timeframes and instruments for flexible trading strategies. Integrated visualiza
Gann Master Pro
issam rahhal sabour
### Birleşik Göstergenin Temel Özellikleri: 1. **Gann Açı Sistemi**: - Başlangıç ​​noktasından çeşitli açılarda (45, 90 vb.) trend çizgileri çizer. - Giriş sinyalleri ve fiyat seviyesi uyarıları içerir. - Pivot noktalarını, Fibonacci seviyelerini ve salınım noktalarını gösterir. 2. **9'un Karesi Sistemi**: - Fiyat karelerine göre yatay destek/direnç seviyeleri oluşturur. - Açısal öneme göre renk kodlu seviyeler (0, 45, 90 vb.) - Seviye dokunuşları için yapılandırılabilir uyarı sistemi. 3
Tesla Gates 369
issam rahhal sabour
Automate Gann's Market Geometry: The Ultimate MT5 Indicator for Predicting Price Cycles & Key Levels Stop guessing and start knowing. The indicator does the complex math for you, transforming W.D. Gann's profound theories into clear, actionable trading signals on your chart. Are you struggling to... Manually calculate pivotal support and resistance levels? Identify high-probability reversal zones in a chaotic market? Understand how to apply Gann's concepts to modern trading? Keep track of your a
Enigma112 Pro V2
issam rahhal sabour
Enigma112 PRO Multi-Confluence Trading System Version 2.13 | Copyright 2024 Issam.R Sabour --- 1. Overview Enigma112 PRO is an advanced MetaTrader 5 indicator that combines multiple technical analysis methodologies into a unified multi-confluence trading system. The indicator integrates PO3 Range analysis, Huddleston Volume Profile, Order Blocks, Fair Value Gaps, Tesla Gates digital root calculations, Pivot Points, and Multi-Timeframe trend analysis to generate high-probability trading signals.
Filtrele:
i LECTRIC
39
i LECTRIC 2026.06.12 07:24 
 

Kullanıcı değerlendirmeye herhangi bir yorum bırakmadı

issam rahhal sabour
424
Geliştiriciden yanıt issam rahhal sabour 2026.06.12 16:18
This an indicator not EA stupid man
Değerlendirmeye yanıt