TrendEngine
- Uzmanlar
- Sürüm: 2.33
- Etkinleştirmeler: 5

A systematic, medium-term trend-following strategy on global equity indices and metals. No grid, no martingale, no averaging into losers. Risk is bounded mathematically — by position size and a hard leverage cap.
Who this strategy is for
Target audience. Investors and traders who want a systematic, risk-controlled "set it and leave it" approach rather than discretionary screen-trading. Especially those who are tired of grid and martingale EAs that draw a beautiful equity curve right up until a single catastrophic blow-up. It works as a standalone tool and as a diversifying sleeve alongside other strategies in a portfolio.
What it gives you. Exposure to the well-documented trend premium (time-series momentum, "managed futures") across a basket of ~10 assets — 8 global equity indices plus gold and silver — with automatic monthly rebalancing and built-in risk control. You don't watch the market: once a month the EA recomputes what to hold and in what size.
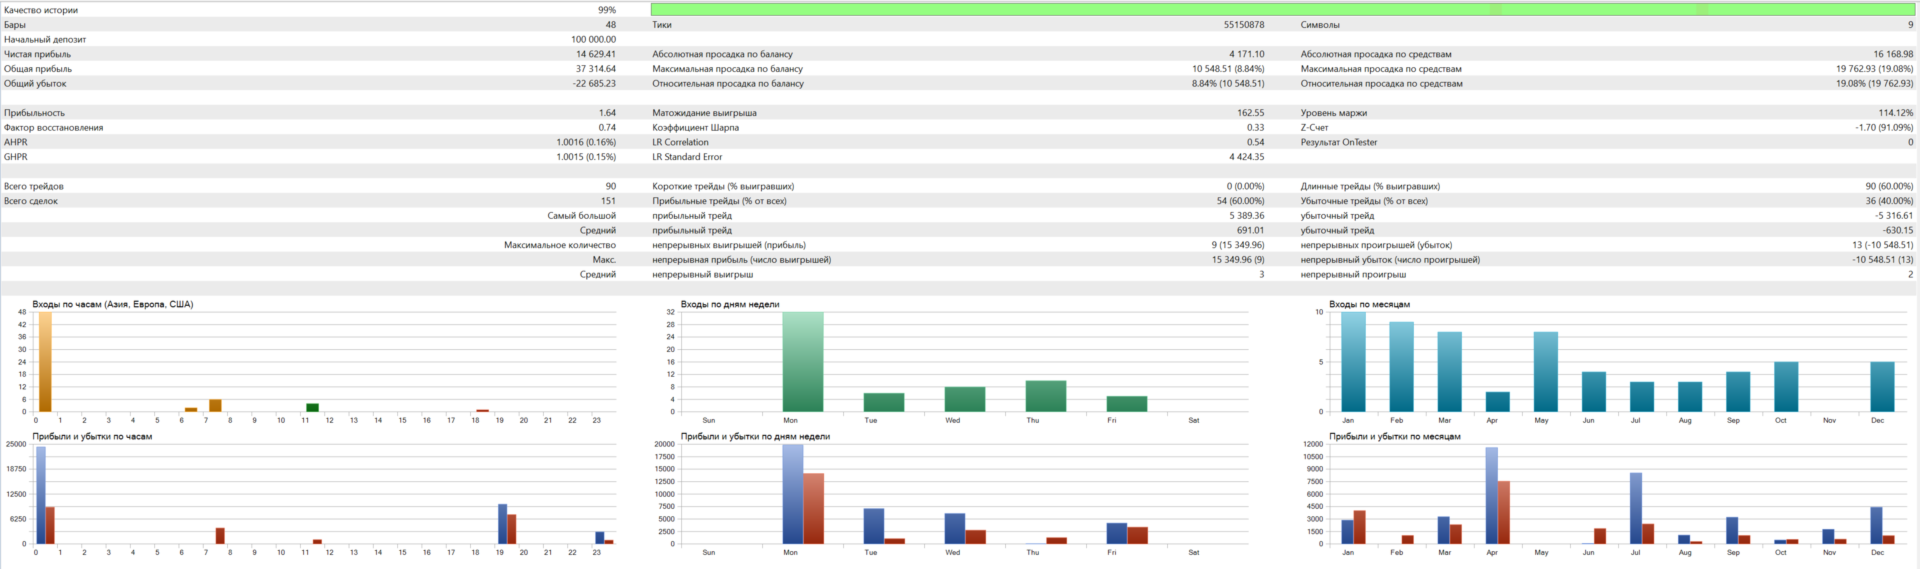
What kind of return (backtest 2010–2026, NOT a guarantee). Return is governed by a single risk parameter (target volatility), and return and drawdown scale together — there is no free lunch:
| Profile (target vol / gross cap) | Annual return | Max drawdown | Sharpe |
|---|---|---|---|
| Conservative (10% / 1.0×) | ~8–10% | ~16% | ~0.85 |
| Balanced (15% / 1.5×) | ~11–13% | ~24–27% | ~0.85 |
| Aggressive (20% / 2.0×) | ~14–17% | ~30–32% | ~0.85 |
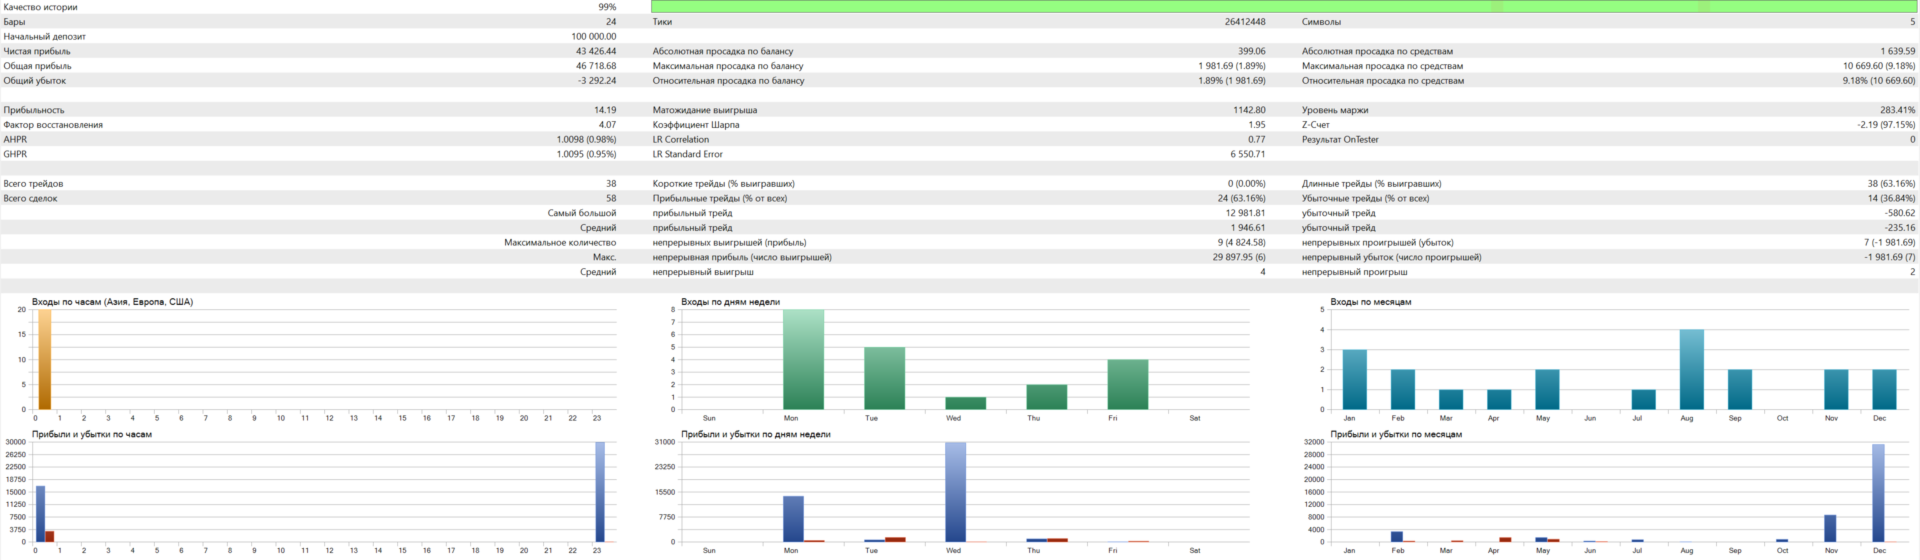
These are average figures. Trend returns are lumpy: there are strong years and flat/losing stretches. It is not a steady 1% a month — some months are down, some are sharply up. The strategy held up in out-of-sample (forward) testing, but in a favorable trending window; over the long run, expect a Sharpe of ~0.7–0.9.
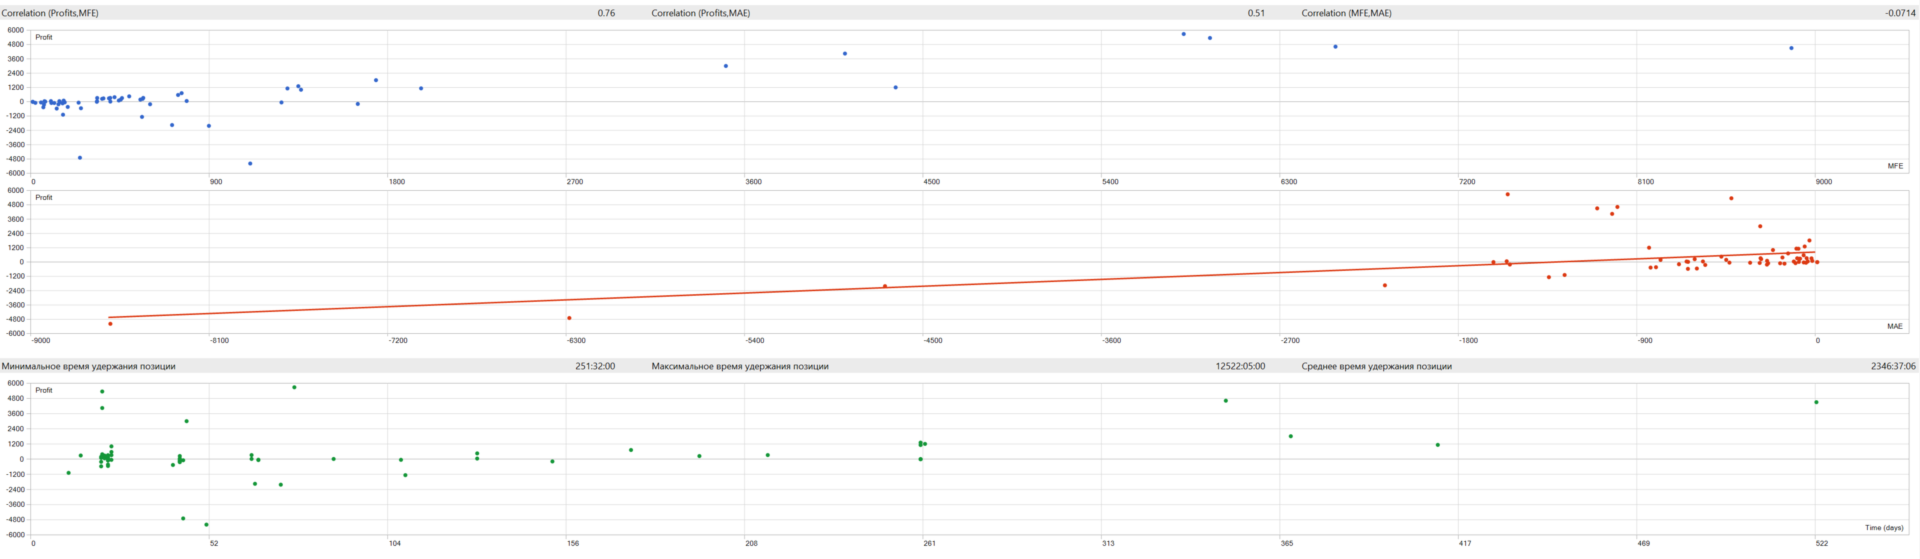
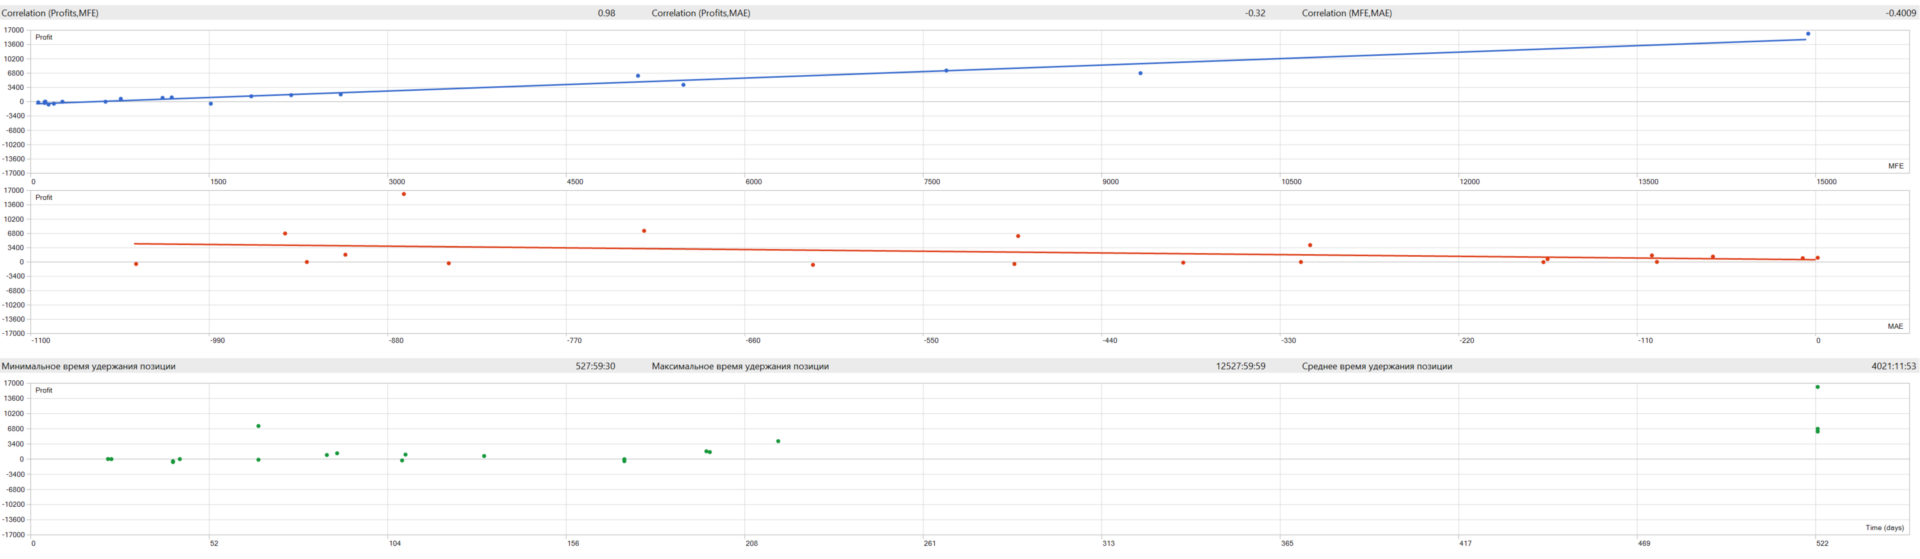
How many trades. This is a low-frequency strategy: one rebalance a month across ~7–10 symbols. On average ~20–40 trades a year, with positions held for weeks to months (the average holding period is around 5–6 months; some trends run longer than a year).
The edge over grid and martingale is structural.
| Grid / martingale | TrendEngine | |
|---|---|---|
| Reaction to a loss | adds to the loser (averages down) | cuts it — exits when the trend fades |
| Outcome distribution | many small wins → a rare total wipeout | rare large wins pay for the small losses |
| Exposure | grows without limit during a drawdown | hard-capped by the gross limit |
| Source of edge | none — trades ruin risk for smoothness | a real, documented trend premium |
Grid and martingale survive as long as the market chops sideways and die on the first strong move against them. TrendEngine does the opposite: small losses are accepted up front, and large moves with the trend are exactly where the money is made. Drawdowns are bounded and recoverable, not account-ending.
Quick start: install, test, alerts
Installing on MetaTrader 5
- File → Open Data Folder.
- Copy TrendEngine.ex5 (or .mq5 ) into MQL5/Experts/ . If it's the .mq5 , open it in MetaEditor and press Compile (F7).
- In the terminal: Navigator → Expert Advisors → right-click → Refresh.
- Drag the EA onto any chart (the chart symbol doesn't matter — the EA reads the monthly bars of its own trading symbols itself) and enable algorithmic trading.
Symbols: out of the box, and where to find your broker's equivalents
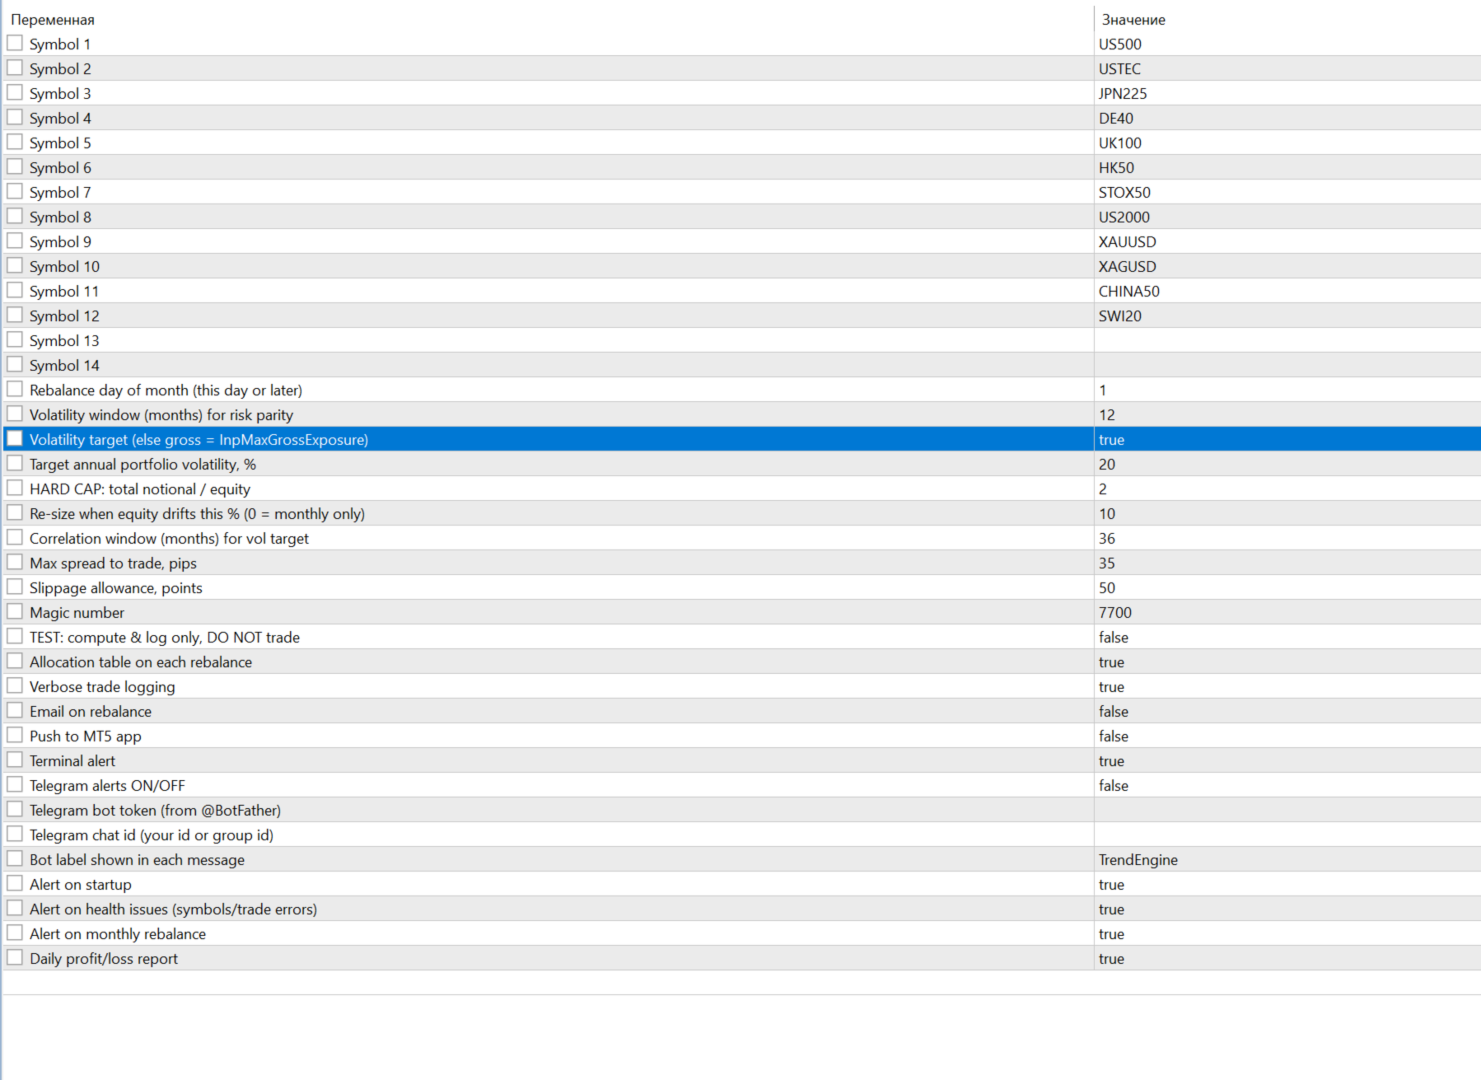
The defaults are a validated 10-asset basket: US500, USTEC, JPN225, DE40, UK100, HK50, STOX50, US2000, XAUUSD, XAGUSD . Names differ from broker to broker — that's normal.
To find yours: Market Watch (Ctrl+M) → right-click → Symbols → the indices/CFD group. Match by description, not by ticker:
- "US SPX 500 / S&P 500" → US500 / SP500m / US500M — pick ONE (usually the one without an m/M suffix).
- "US Tech 100 / Nasdaq" → USTEC / USTECH100 / ND100m .
- "Germany 40 / DAX" → DE40 / GER30 ; "FTSE 100" → UK100 ; "Nikkei 225" → JPN225 .
- "EURO STOXX 50" → STOX50 ; "Hong Kong" → HK50 ; "US Small Cap 2000" → US2000 .
- Gold / silver → XAUUSD / XAGUSD .
Each symbol goes on its own line in the inputs ( Symbol 1 … Symbol 12 ). Enter your broker's exact names; blank slots are skipped.
Self-check. On startup the EA prints a Symbol self-check (MN1) block to the log — for each symbol, OK (N months) / NOT at broker / too little history . NOT at broker → fix the name. too little history → open the symbol's MN1 chart and scroll back to old bars to load history.
"Works out of the box"
Once you've substituted your broker's names, there's nothing else to change: the defaults are the validated 10-asset basket, 10% target volatility, 1.0× gross cap (a conservative ~8–10%/year profile). Want it more aggressive? Raise Target annual portfolio volatility to 15–20 and HARD CAP (total notional / equity) to 1.5–2.0; return and drawdown grow proportionally.
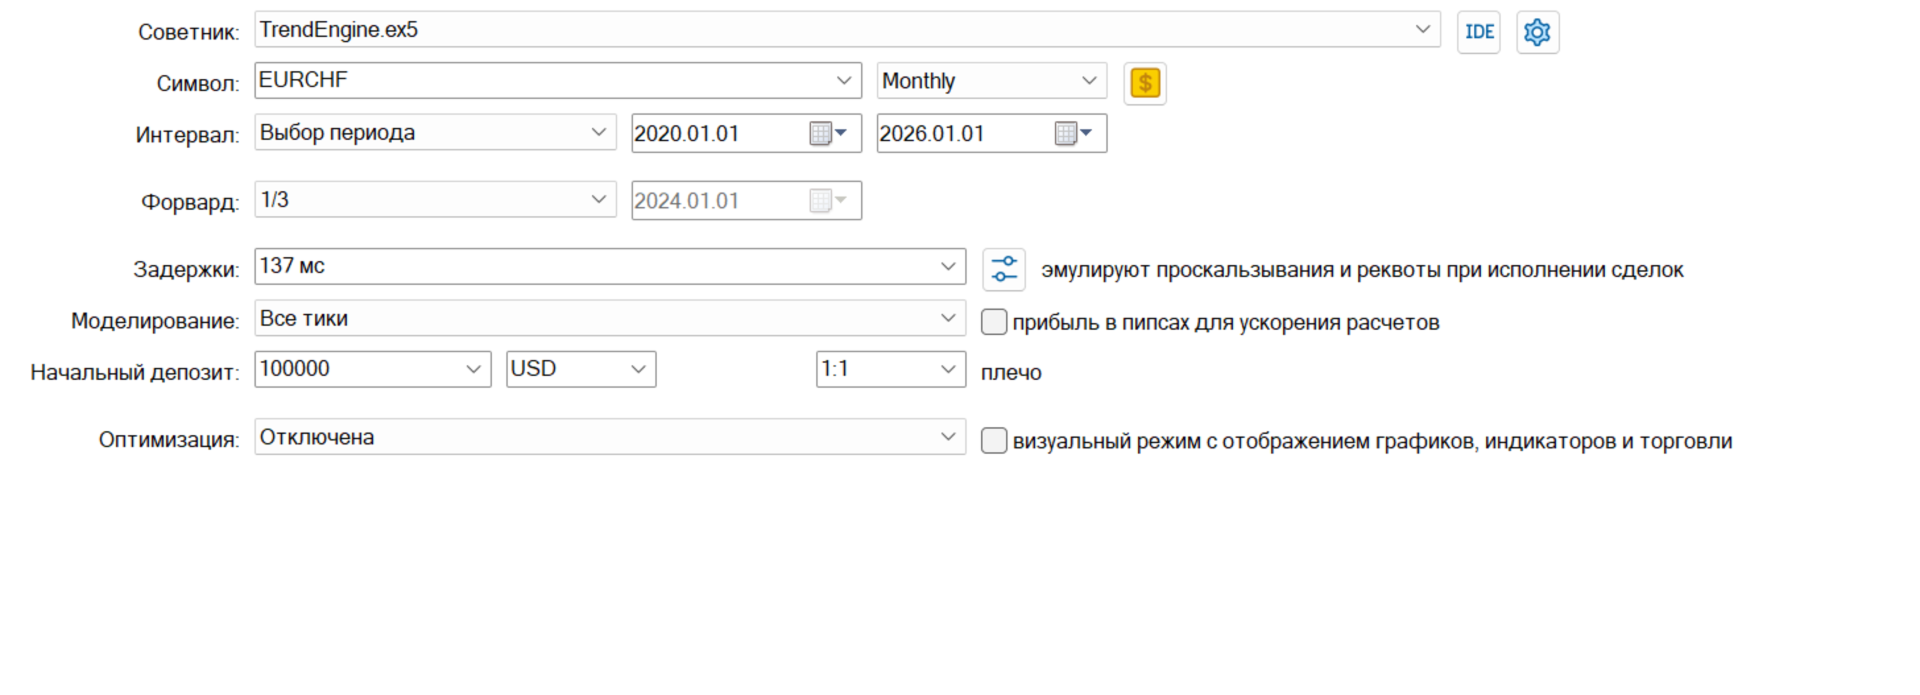
Testing in the Strategy Tester
- Chart symbol: any liquid one, e.g. US500 or EURUSD — it doesn't affect the result.
- Timeframe: H1 or D1 (D1 runs faster).
- Modeling: "OHLC on M1." Do NOT use "Open prices only" — on a multi-symbol test it gives wrong reads on the non-chart symbols.
- Period: allow for history. Most brokers have index-CFD data from ~2012–2016, and some symbols (UK100/STOX50/the Chinese indices) start later. To have ALL symbols trading from the start of the test, begin in 2016 or later (it's worth running both a long window and the recent years). The engine needs ~15 months of history before its first signal.
- Initial deposit: $100,000. This matters: index/metal CFDs have a large minimum lot — on $1,000–10,000 many positions round to zero and simply won't trade. A 10-asset basket is sized for a substantial account.
- Add all symbols to Market Watch before testing (multi-symbol mode).
Adding 2 symbols and checking for improvement
You can put any of your broker's symbols into slots Symbol 11 and Symbol 12 and run a test — the tester will show whether Sharpe and drawdown improved. (A note from the research: adding more of the same broker's indices usually does NOT improve the result — global equities are highly correlated with one another; real diversification comes from other asset classes. But there's nothing stopping you from checking — that's what the slots are for.)
Alerts: Telegram and email
Email. Set up mail in the terminal: Tools → Options → Email tab (SMTP server, login, password, from/to). Then set Email on rebalance = true in the EA inputs.
Telegram.
- Create a bot: message @BotFather → /newbot → you'll get a token.
- Find your chat_id: send the bot any message, then open @userinfobot (it shows your id).
- Allow the URL: Tools → Options → Expert Advisors → ✓ "Allow WebRequest for listed URL" → add https://api.telegram.org .
- In the inputs: Telegram alerts = true , Telegram bot token = <token> , Telegram chat id = <your id> , Bot label = <label> .
Important: alerts only work on a live/demo account in real time. They stay silent in the Strategy Tester (by design). If the log shows [TG] send failed err=4060 , the URL hasn't been added to the allowed list (step 3).
What alerts there are, and what arrives
Every message is tagged with [bot label] (handy when you run several copies). You'll get:
- Startup — on launch: number of symbols, how many are ready, the risk profile, the gross cap, equity. If a symbol isn't ready, the message says so.
- Health — if no symbol is ready, or a trade fails to execute (with the error code).
- Monthly rebalance — a summary: how many longs, current gross (leverage), the list of positions with their sizes.
- Daily P&L — at the start of a new day: the day's profit/loss, equity, balance, number of open positions.
Each channel (terminal alert, push to the MT5 app, email, Telegram) is toggled independently by its own flag.
How every relationship was determined, and why these in particular
The idea. At its core is time-series momentum: an asset that has risen over the past several months tends, statistically, to keep rising; one that has fallen tends to keep falling. The effect has been documented for decades in the managed-futures literature. But it isn't the same everywhere.
The platform. MetaTrader 5 / MQL5, multi-symbol mode (a single EA manages all symbols at once), with signals taken from closed monthly bars (MN1) — no look-ahead, no repainting.
What went into the build. Before the EA was written, the edges were tested on ~25 years of history across 40+ instruments (indices, metals, energy, agricultural commodities, currencies, crypto, bonds). The result: the trend premium is robust on equity indices and precious metals, but in the 2010s it decayed on commodities and bonds. That's why the basket is exactly 8 indices + gold/silver: where the trend is alive, plus metals for diversification (they're less correlated with equities). Adding commodities, bonds, or extra European indices made the result worse in testing — so they're not there.
Here's how that turns into MQL logic.
(1) Signal — multi-horizon momentum (long/flat). For each symbol we take the 3-, 6-, and 12-month returns and count the fraction that are positive. That gives a number from 0 to 1 — how firmly the asset is trending up. There's no shorting: it's either long or cash.
int LB[3] = {3,6,12}; // horizons in months bool ComputeSignal(string sym, double &sigOut) { double c1 = iClose(sym, PERIOD_MN1, 1); // last CLOSED month double s = 0.0; for(int j=0; j<3; j++){ double cp = iClose(sym, PERIOD_MN1, 1+LB[j]); s += ((c1/cp - 1.0) > 0.0 ? 1.0 : 0.0); // +1 if it rose over this horizon } sigOut = s/3.0; // 0.00 / 0.33 / 0.67 / 1.00 return(true); }
(2) Weights — risk parity (inverse volatility). So that a calm index and a wild metal contribute equally to risk, each asset's weight is inversely proportional to its volatility. First we compute monthly vol:
bool ComputeMonthlyVol(string sym, double &volOut)
{
   int W = InpVolWindow;                 // 12 months
   double r[]; ArrayResize(r,W); double mean=0;
   for(int k=0;k<W;k++){
      double a=iClose(sym,PERIOD_MN1,1+k), b=iClose(sym,PERIOD_MN1,2+k);
      r[k]=a/b-1.0; mean+=r[k];
   }
   mean/=W; double var=0;
   for(int k=0;k<W;k++) var+=(r[k]-mean)*(r[k]-mean);
   volOut=MathSqrt(var/W);
   return(true);
}
Then weight ∝ signal / vol, and everything is normalized:
// raw_i = sig_i / vol_i ; then normalize so the weights sum to 1 // a more volatile asset gets LESS capital -> equal contribution to risk
(3) Volatility targeting via correlations. The weights set the structure; the overall scale is set by the portfolio's target volatility. We compute the correlation matrix of monthly returns and solve for a multiplier k that makes the portfolio's forecast vol match the target ( InpTargetVolPct ):
// portfolio variance, accounting for correlations
double pv=0.0;
for(int a=0;a<M;a++) for(int b=0;b<M;b++)
   pv += v[a]*v[b]*corr[a][b];           // v = the position's money sigma
double pSig = MathSqrt(pv);
double tgt  = eq*(InpTargetVolPct/100.0)/MathSqrt(12.0);
double k    = tgt/pSig;                   // multiplier on the lots
(4) The hard leverage cap — the main safety valve. After vol targeting we compute the actual total notional and, if it exceeds InpMaxGrossExposure × equity , scale ALL positions down proportionally. This doesn't depend on noise in the vol estimate and physically prevents the account from over-leveraging:
double cap = InpMaxGrossExposure*eq; // e.g. 1.0–2.0 × equity if(gross > cap){ double sc = cap/gross; for(...) aLots[i] *= sc; // scale everything down proportionally }
(5) Reliable position-cost calculation. On CFDs the TICK_VALUE fields can be unreliable, so the risk per lot is computed via OrderCalcProfit (the platform's authoritative P&L calculation), with a fallback through the contract size:
double MoneyPerSigmaLot(string sym, double volFrac)
{
   double price=SymbolInfoDouble(sym,SYMBOL_BID);
   double sp=volFrac*price, profit=0.0;
   if(OrderCalcProfit(ORDER_TYPE_BUY,sym,1.0,price,price+sp,profit) && profit!=0.0)
      return(MathAbs(profit));            // loss on 1 lot for a 1σ move
   double cs=SymbolInfoDouble(sym,SYMBOL_TRADE_CONTRACT_SIZE);
   return(cs*price*volFrac);              // fallback
}
So the blocks fit together like this: the signal decides whether to enter, risk parity decides in what proportion, vol targeting decides at what overall scale, the gross cap decides no more than how much, and OrderCalcProfit keeps the money math correct.
Where the profit comes from, how capital is protected, why there's no TP/SL/trailing
Where the profit comes from. The strategy earns from sustained trends: while an asset rises, the position is held and profit accumulates; when momentum fades, it goes to cash. The outcome distribution is positively skewed — rare large winners pay for many small losses. On top of that, long/flat moves to cash in bear phases, sidestepping slow declines.
How capital is protected — four layers:
- Position sizing to a vol budget — each position is sized to the target volatility, not "all-in on leverage."
- A hard gross-exposure cap ( InpMaxGrossExposure ) — total notional never exceeds a set multiple of equity; averaging into losers is impossible by construction.
- Long/flat — when a trend fades, the asset goes to cash (sidestepping slow bear markets).
- Diversification across ~10 loosely correlated assets.
Why there's no TP / SL / trailing. This is a trend strategy, and its exit is the monthly signal fading, not a price level.
- A fixed TP cuts the winners — and the winners are what create all the profit (positive skew). Cap the large moves and you're left with the small losses, which flips the edge negative.
- A fixed SL whipsaws you: ordinary intra-month volatility knocks you out of a position the signal still wants → you realize a temporary drawdown as a real loss, then re-enter higher → idle churn that lowers both return and Sharpe.
- Risk is already controlled — by position size and the gross cap. Stops would be a third, conflicting layer.
(This isn't an opinion — it's been tested; see section 3.)
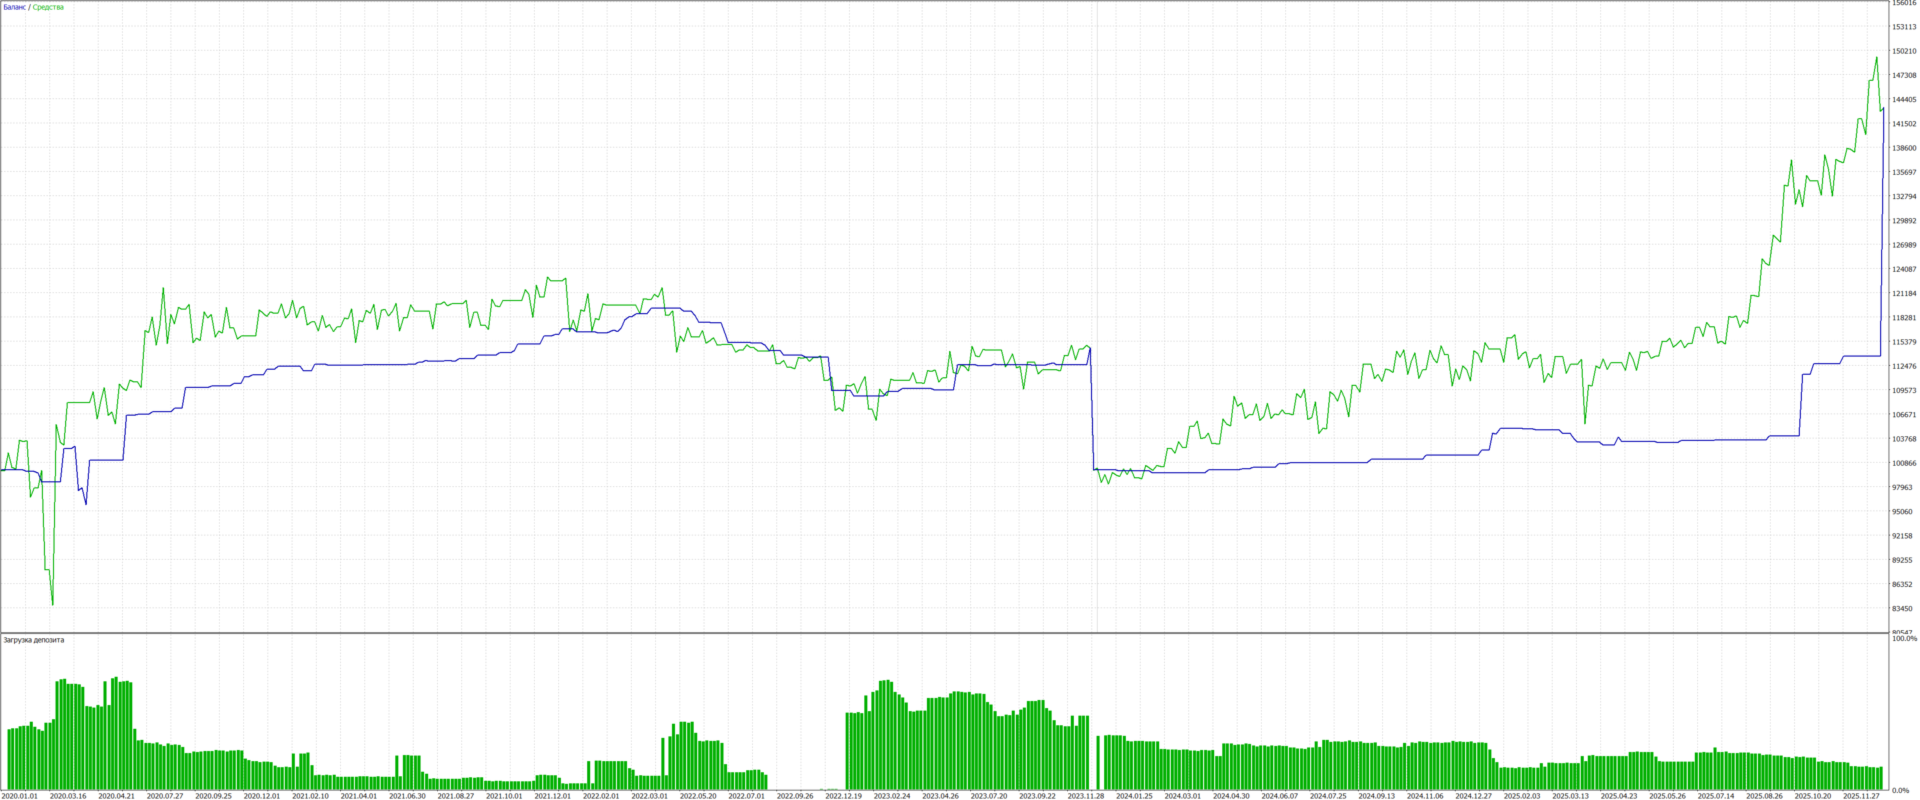
How to read the tester chart.
- The blue line (Balance) is realized capital. It only moves when positions close, so it's flat between rebalances and "steps" at each rebalance.
- The green line (Equity) is balance plus the floating P&L of open positions. It breathes with the market.
- A gap between green and blue is normal: positions are held for weeks, and their P&L floats until the trade closes.
- A vertical jump at the very end of the test is a tester artifact — it force-closes all open positions on the last bar. It has nothing to do with the strategy's logic.
- "Deposit load" is margin utilization (indirectly, leverage). It should stay moderate; sharp spikes mean overload.
What unrealized (floating) P&L is. It's the current profit/loss of positions that haven't closed yet. It's included in equity (the green line) but not in balance (the blue line) until the trade closes. For a strategy that holds positions for months, a large floating P&L is normal, not a malfunction.
How trades close. At each monthly rebalance the EA recomputes the signals: symbols whose momentum has reversed (signal → 0) are closed; those still trending are held or resized to the new risk. In other words, a trade closes when the trend ends, not when a price target is hit.
Why adding TP / SL would worsen the profit (per the tests)
This was tested on historical data, normalized to a single volatility, and net of costs. The baseline Sharpe, with no intervention, is 0.86–0.89.
A trailing stop (at any width) hurts every metric:
| Variant | CAGR | Sharpe | Drawdown |
|---|---|---|---|
| Baseline (no stops) | 8.5% | 0.86 | −16.4% |
| Trailing SL 2.5σ | 4.9% | 0.57 | −25.1% |
| Trailing SL 4.0σ (wide) | 5.3% | 0.58 | −21.4% |
Return halves, Sharpe drops from 0.86 to ~0.57, and the drawdown gets WORSE (−16% → −25%): the stop realizes temporary pullbacks as real losses, then re-enters higher — idle churn. There's no sweet spot at any width.
Take-profit is neutral at best, usually negative: it cuts the winners that create the edge, and it never improves the result.
A "+1% of balance" TP (close and wait a month): return is cut by half to two-thirds (8.6%→4.6% at 10% vol; 16.7%→4.9% at 20%), Sharpe from 0.87 to 0.42–0.65. And the higher the leverage, the worse it gets — the TP defeats the whole point of leverage (you bank +1% before leverage can let the trend run).
A "+1% → rebalance immediately" TP: since the signals don't change within a month, you close and immediately reopen the same positions — pure idle churn. Vol is unchanged (no risk reduction), return drops by the cost of the trades (dozens of extra round-trips), Sharpe from 0.83 to 0.69–0.76.
Bottom line. Trend lives on positive skew — a few large wins. A TP truncates the right tail (the big moves) and flips the edge; an SL turns temporary drawdowns into realized losses plus churn. Risk is managed by position size, not by stops.
The strategy's prospects (tentatively, per the calculations)
On the plus side. The trend premium (managed futures) is a structural phenomenon observed over decades, not an artifact of one market. The equity-indices-plus-metals version proved more robust than "broad" trend in testing and came through the 2022 bear market with a shallow drawdown. The edge held up in out-of-sample forward testing.
What to keep honestly in mind (risks and limits):
- Trend decays and fades. In the 2010s the broad trend premium weakened (especially on commodities — which is why they're not in the basket). Multi-year flat/weak stretches are possible (2010–2014, for example, were weak). That's the normal price of a trend approach.
- It won't save you from fast crashes. A monthly signal can't keep up with sharp crashes (like February–March 2020) — in those events the strategy takes a loss alongside the market, the larger the higher the leverage.
- Future returns are most likely below the backtest. Real spreads, slippage, CFD swap, and edge decay all work against it. A reasonable long-run guide: Sharpe ~0.7–0.9, return ~8–17% (depending on the chosen risk), with periodic drawdowns of 15–35%.
- It's a diversifier, not a holy grail. It's best used as one sleeve of a portfolio alongside other, loosely correlated strategies; the overall risk-adjusted result is then higher than any single sleeve on its own.
In summary. TrendEngine is a drawdown-controlled trend tool built on a real premium, with mathematically bounded risk and none of the grid/martingale tricks. It doesn't promise to make you rich quickly, and it will have weak years — but it's precisely the absence of hidden ruin risk and the transparency of the mechanics that set it apart from the "smooth until they blow up" EAs.
Disclaimer. All figures shown are the results of historical testing and are not a promise or guarantee of future performance. Trading carries the risk of loss, including substantial drawdowns. This material is not individual investment advice. Test on a demo account and risk only what you are prepared to lose.