Session VWAP Bands MT4

Limited-time free release: this indicator is free while we collect real trader feedback. Please leave a comment with your requests, issues, settings ideas, or features you want us to consider for the premium version.

Session VWAP Bands plots the session volume-weighted average price and adaptive deviation bands directly on the chart. It helps you see where price is trading relative to the current session's fair-value area.

Use it to spot

  • Price holding above or below session VWAP.
  • Mean-reversion areas near the first deviation bands.
  • Stretched moves near the second deviation bands.
  • Intraday trend continuation when price keeps respecting VWAP.

What it shows

  • VWAP line on the main chart.
  • Upper and lower first-deviation bands.
  • Upper and lower second-deviation bands.
  • Hidden session-age buffer for EA or dashboard integration.

Main features

  • Daily/session reset with configurable start hour and minute.
  • Tick-volume weighted VWAP calculation.
  • Optional typical-price or close-price calculation.
  • Configurable first and second band deviations.
  • Historical calculation limit for lighter charts.

Basic use

  1. Add the indicator to an intraday chart.
  2. Watch whether price accepts above, below, or around VWAP.
  3. Use the first bands as normal session extension areas.
  4. Use the second bands as stretched movement or target areas.
  5. Confirm with your own trend, price action, and risk rules.

Inputs

  • MaxCalculatedBars: limits how many historical bars are calculated.
  • SessionStartHour: hour used for the session reset.
  • SessionStartMinute: minute used for the session reset.
  • Band1Deviation: multiplier for the first band set.
  • Band2Deviation: multiplier for the second band set.
  • ResetEveryDay: resets VWAP on each trading day/session.
  • UseTypicalPrice: uses typical price instead of close price.

Buffers

  • Buffer 0: VWAP value.
  • Buffer 1: upper first band.
  • Buffer 2: lower first band.
  • Buffer 3: upper second band.
  • Buffer 4: lower second band.
  • Buffer 5: session age.

Risk note: this indicator is a technical analysis tool. It does not guarantee profitable trades. Use it with risk management and additional confirmation.
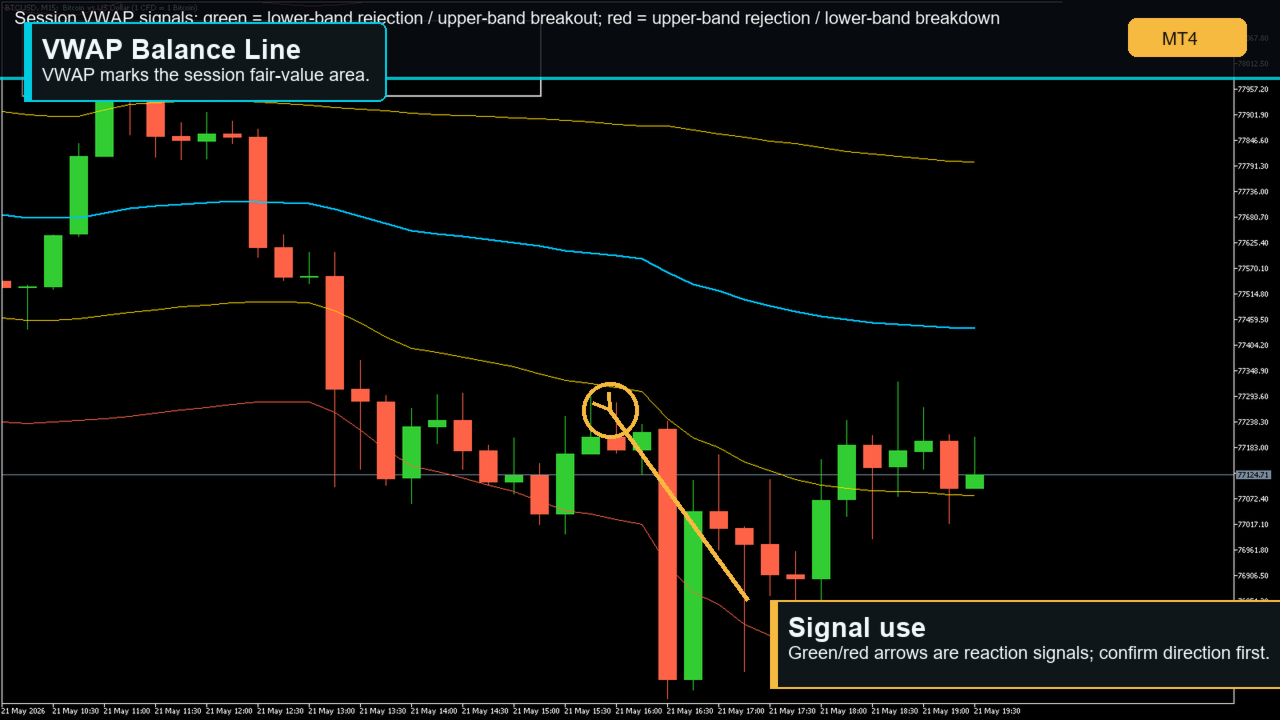
Signals

  • Green arrows mark bullish VWAP setups: lower-band rejection or a move above the outer upper band.
  • Red arrows mark bearish VWAP setups: upper-band rejection or a move below the outer lower band.
  • Signal buffer values: 1 lower-band bullish rejection, 2 upper-band bullish breakout, -1 upper-band bearish rejection, -2 lower-band bearish breakdown, 0 no signal.
Önerilen ürünler
Limited-time free release: this indicator is free while we collect real trader feedback. Please leave a comment with your requests, issues, settings ideas, or features you want us to consider for the premium version. FVG Imbalance Zones is a free MT4 chart indicator that automatically marks bullish and bearish fair value gap zones. It scans three-candle price imbalances, filters out small gaps, and manages zones as price interacts with them. Use it to spot: Bullish fair value gaps where buyers c
FREE
Limited-time free release: this indicator is free while we collect real trader feedback. Please leave a comment with your requests, issues, settings ideas, or features you want us to consider for the premium version. Cumulative Delta Flow MT4 is a separate-window tick-volume flow oscillator for MetaTrader 4. It estimates signed buying and selling pressure from candle position, candle direction, and tick volume, then plots a cumulative delta line with a signal line and divergence markers. Use it
FREE
BoxInside MT4
Evgeny Shevtsov
4.83 (6)
This indicator calculates the volume profile and places labels that correspond to the VAH, VAL and POC levels, for each candle individually. Indicator operation features The indicator works on the timeframes from M5 to MN, but it uses the history data of smaller periods: M1 - for periods from M5 to H1, M5 - for the H4 period, M30 - for the D1 period, H4 - for the W1 period, D1 - for the MN period. The color and location of the VAL, VAH and POC labels on the current candle are considered to be c
FREE
Enhanced Volume Profile: The Ultimate Order Flow & Liquidity Analysis Tool Overview Enhanced Volume Profile   is an indicator for MetaTrader 5 that displays the traded volume at specific price levels over a defined period. It separates the total volume into buy and sell components, presenting them as a side-by-side histogram on the chart. This allows users to observe the volume distribution and the proportion of buy and sell volumes at each price level. Graphics Rendering The indicator uses t
FREE
Market Profile with Dashboard Indicator - Complete User Guide xau only indicator Overview The Market Profile with Dashboard is a comprehensive trading analysis tool for MetaTrader 4 that displays market profile data, volume analysis, and key market structure information directly on your chart. This indicator helps traders identify significant price levels, market balance areas, and potential trading opportunities based on market profile theory. Core Components and Features Market Profile Dis
FREE
Cumulative Delta MT4
Evgeny Shevtsov
4.86 (29)
The indicator analyzes the volume scale and splits it into two components - seller volumes and buyer volumes, and also calculates the delta and cumulative delta. The indicator does not flicker or redraw, its calculation and plotting are performed fairly quickly, while using the data from the smaller (relative to the current) periods. The indicator operation modes can be switched using the Mode input variable: Buy - display only the buyer volumes. Sell - display only the seller volumes. BuySell -
FREE
Limited-time free release: this indicator is free while we collect real trader feedback. Please leave a comment with your requests, issues, settings ideas, or features you want us to consider for the premium version. Opening Range FVG Breakout MT4 marks the opening range, breakout levels, projected targets, and optional Fair Value Gap confluence zones. Use it to: Frame the first range of a trading session. Spot bullish and bearish breakouts beyond the range. Filter breakout arrows with FVG confl
FREE
Market Profile 3
Hussien Abdeltwab Hussien Ryad
3 (2)
Market Profile 3 MetaTrader 4 indicator  — is a classic Market Profile implementation that can show the price density over time, outlining the most important price levels, value area, and control value of a given trading session. This indicator can be attached to timeframes between M1 and D1 and will show the Market Profile for daily, weekly, monthly, or even intraday sessions. Lower timeframes offer higher precision. Higher timeframes are recommended for better visibility. It is also possible t
FREE
AQ XFifteen
HIT HYPERTECH INNOVATIONS LTD
4 (7)
Χ15 indicator is a MetaTrader 4 tool that allows you to BUILD & BACKTEST ON REAL TIME your own strategies quickly, easily and efficiently. It contains 15 of the most popular technical analysis indicators that you can use, each one in a different way. Choose the indicators that you want to use, select how you will use them and you will see on the chart BUY (green) and SELL (red) arrows implementing your strategy. Choose Take Profit and Stop Loss and you will see the results of your strategy with
FREE
Limited-time free release: this indicator is free while we collect real trader feedback. Please leave a comment with your requests, issues, settings ideas, or features you want us to consider for the premium version. SuperTrend ATR Signals MT4 is a chart-window trend indicator that plots a SuperTrend line using ATR volatility and highlights trend flips with optional buy and sell arrows. Use it to spot: Current trend direction. Possible trend-change areas. ATR-based trailing support and resistanc
FREE
MarketProfile EForex
Veridiana Adorno Kendrick
Market Profile Shows where the price has spent more time, highlighting important levels that can be used in trading. It is a powerful tool which is designed to take the fundamental components which comprise every market; price/volume/time, and visually display their relationship in real-time as the market develops for a pre-determined time period. Very powerful tool!
Simple QM Pattern
Suvashish Halder
4.5 (2)
Simple QM Pattern is a powerful and intuitive trading indicator designed to simplify the identification of the Quasimodo (QM) trading pattern. The QM pattern is widely recognized among traders for effectively signaling potential reversals by highlighting key market structures and price action formations. This indicator helps traders easily visualize the QM pattern directly on their charts, making it straightforward even for those who are new to pattern trading. Simple QM Pattern includes dynamic
FREE
Gösterge, tarihsel olanlarla karşılaştırılabilecek güncel teklifler oluşturur ve bu temelde bir fiyat hareketi tahmini yapar. Gösterge, istenen tarihe hızlı navigasyon için bir metin alanına sahiptir. Seçenekler: Sembol - göstergenin göstereceği sembolün seçimi; SymbolPeriod - göstergenin veri alacağı dönemin seçimi; GöstergeRenk - gösterge rengi; Ters - doğru tırnakları tersine çevirir, yanlış - orijinal görünüm; Sonraki, tarihi girebileceğiniz ve 'enter' tuşuna basarak hemen atlayab
The indicator displays price distribution on a horizontal histogram. Horizontal histogram help find out key levels of price so that you can make good decision on setting point of take profit, stop loss... You can improve exist trading strategy or get new trading idea with the histogram of price. Outstanding features Support multiple time frame : you can choose to work with history data in any time frame you want. It does not depend on current display time frame. Support weighting by volume and/
FREE
Pips forex - is a ready trading system . This indicator shows with arrows on the chart when and in what direction you need to open an order. If the arrow is green, then we open a buy deal, and if the arrow is red, then we open a sell deal. Everything is very simple and quite effective. TakeProfit set 15-25 points. StopLoss set at the level of points. When the dots move, we immediately override the StopLoss. Recommended timeframe for trading M1 and M5. This is a scalping strategy and works best
SX Supply Demand Zones accurately identifies and draws high-probability Supply and Demand zones using a sophisticated algorithm. Unlike traditional indicators that clutter your chart, this indicator is designed with a focus on performance and a clean user experience. New Unique Feature: Interactive Legend System What truly sets this indicator apart from everything else is the Interactive Control Legend. You have a professional dashboard directly on your chart that allows you to: Show/Hide: Ins
FREE
This indicator help to mark the high and low of the session Asian,London,Newyork , with custom hour setting This indicator is set to count from minute candle so it will move with the current market and stop at the designated hour and create a accurate line for the day. below is the customization that you can adjust : Input Descriptions EnableAsian Enables or disables the display of Asian session high and low levels. EnableLondon Enables or disables the display of London session high and
FREE
ATR Volatility plots the ATR-based volatility, and triggers alerts when it crosses user-defined upper and lower thresholds (purple and tan lines, please see screenshots). Circles are painted when ATR volatility crosses either above the upper threshold, or below the lower threshold. This is a small tool custom-built by our group, by specific request of one of our customers. We hope you enjoy! Do you have an indicator you would like to see designed? Feel free to send us a message! Click here for m
FREE
BoxProfile MT4
Evgeny Shevtsov
4.92 (12)
The indicator displays volume profiles based on the nesting principle. Profiles periods are pre-set so that each subsequent profile has a length twice as long as the length of the previous profile. In addition to profiles, the indicator displays volume clusters sorted by color, depending on the volume they contain. Indicator operation features The indicator works on typical timeframes from M5 to MN, but for calculations uses historical data from smaller timeframes: M1 - for timeframes from M5
FREE
Symbol Overlay
John Louis Fernando Diamante
5 (2)
This indicator plots another symbol on the current chart. A different timeframe can be used for the symbol, with an option to display in multiple timeframe mode (1 overlay candle per several chart candles). Basic indicators are provided. To adjust scaling of prices from different symbols, the overlay prices are scaled to the visible chart price space. Features symbol and timeframe input MTF display option to vertically invert chart, eg overlay USDJPY, invert to show JPYUSD data window values; o
FREE
Basic Theme Builder
Mehran Sepah Mansoor
5 (1)
Basic Theme Builder: Grafik Özelleştirmeyi Kolaylaştırın Ticaret deneyiminizi   Basic Theme Builder   göstergesi ile dönüştürün; MetaTrader 4'te grafik görünümünüzü basit bir panel aracılığıyla kişiselleştirmenizi sağlayan çok yönlü bir araçtır. Bu sezgisel gösterge, çeşitli temalar ve renk şemaları arasında zahmetsizce geçiş yapmanıza olanak tanır ve ticaret ortamınızın görsel çekiciliğini ve işlevselliğini artırır.    Free MT5 version Basic Theme Builder   göstergesi, MetaTrader 4 grafiklerin
FREE
This indicator will mirror the assets in use in another metatrader, being able to choose the timeframe and a template. This is the Metatrader 4 Client, it needs the Metatrader 4 or 5 Server versions: Metatrader 4 Mirror Chart Server: https://www.mql5.com/en/market/product/88644 Metatrader 5 Mirror Chart Server:   https://www.mql5.com/en/market/product/88652 Details of how it works in the video.
FREE
Highlights trading sessions on the chart The demo version only works on the AUDNZD chart!!! The full version of the product is available at: (*** to be added ***) Trading Session Indicator displays the starts and ends of four trading sessions: Pacific, Asian, European and American. the ability to customize the start/end of sessions; the ability to display only selected sessions; works on M1-H2 timeframes; The following parameters can be configured in the indicator: TIME_CORRECTION = Correct
FREE
The ProfileVolumesMarket indicator calculates tick volume on each price level in a selected range. Volume is vital when determining strength and therefore significance of price levels. The calculation range is set by a trader by means of moving two vertical lines. Thus the indicator allows to track important levels on different steps of a symbol price formation. A histogram of volume profile can be displayed on the chart (or removed from the chart) if you press "ON" ("OFF") button. When you chan
Extremum Reverse Bar
Yurij Izyumov
2.8 (5)
This indicator has been created for finding the probable reversal points of the symbol price. A small candlestick reversal pattern is used it its operation in conjunction with a filter of extremums. The indicator is not redrawn! If the extremum filter is disabled, the indicator shows all points that have a pattern. If the extremum filter is enabled, the condition works – if the history Previous bars 1 candles back contains higher candles and they are farther than the Previous bars 2 candle, such
FREE
Forex Piyasası Profili (kısaca FMP) Bu ne değildir: FMP, klasik harf kodlu TPO ekranı değildir, genel grafik veri profili hesaplamasını görüntülemez ve grafiği periyotlara bölmez ve hesaplamaz. Bu ne yapar : En önemlisi, FMP göstergesi, kullanıcı tanımlı spektrumun sol kenarı ile kullanıcı tanımlı spektrumun sağ kenarı arasında bulunan verileri işleyecektir. Kullanıcı, fare ile göstergenin her iki ucunu çekerek spektrumu tanımlayabilir. Göstergeler sağ kenar canlı çubuğa ve daha uzağa (gelec
FREE
Traditional MACD MT4
Daniel Lewis
4.58 (55)
MACD indicator in MetaTrader 4/5 looks different than MACD does in most other charting software. That is because the MetaTrader 4/5 version of MACD displays the MACD line as a histogram when it is traditionally displayed as a line. Additionally, the MetaTrader 4/5 version computes the Signal line using an SMA, while according to MACD definition it is supposed to be an EMA. The MetaTrader 4/5 version also does not compute a true MACD Histogram (the difference between the MACD/Signal lines). This
FREE
Zig Zag 123
Stephen Reynolds
Zig Zag 123 tells us when a reversal or continuation is more likely by looking at the shift in supply and demand. When this happens a signature pattern appears known as 123 (also known ABC) will often break out in direction of higher low or lower high. Stop loss and take profit levels have been added. There is a panel that shows the overall performance of your trades for if you was to use these stop loss and take profit levels.  We get alerted if a pattern 123 appears and also if the price re
FREE
Volume indicator Effect Volume , in the Forex market volumes are unique (tick). This volume indicator demonstrates the level of financial and emotional involvement. When the indicator forms a new top, it indicates that buyers are stronger than sellers over a certain period of time. If the indicator decreases, this indicates that the bears are stronger. Why is it impossible to track normal volumes in Forex? The fact is that this is an over-the-counter market. Consequently, it is practically imp
Check my paid tools they work great and I share Ea's based on them for free please r ate The Dual Timeframe RSI (Relative Strength Index) indicator is a novel trading tool that allows traders to monitor RSI readings from two different timeframes on a single chart. This dual perspective enables traders to identify potential trend confirmations and divergences more effectively. For instance, a trader might use a 1-hour RSI alongside a daily RSI to ensure that short-term trades align with the broa
FREE
Bu ürünün alıcıları ayrıca şunları da satın alıyor
Gann Made Easy
Oleg Rodin
4.83 (162)
Gann Made Easy , bay teorisini kullanarak ticaretin en iyi ilkelerine dayanan, profesyonel ve kullanımı kolay bir Forex ticaret sistemidir. WD Gann. Gösterge, Zararı Durdur ve Kâr Al Seviyeleri dahil olmak üzere doğru SATIN AL ve SAT sinyalleri sağlar. PUSH bildirimlerini kullanarak hareket halindeyken bile işlem yapabilirsiniz. Satın alma işleminden sonra, alım satım talimatlarını ve harika ek göstergeleri ücretsiz olarak almak için lütfen benimle iletişime geçin! Muhtemelen Gann ticaret yöntem
Genesis Matrix Pro is a professional multi-timeframe trend detection indicator designed to help traders identify high-quality market alignment with clarity and structure. It combines 12 different technical indicators into one visual alignment matrix, allowing traders to quickly see when market conditions are bullish, bearish, or neutral. A signal is generated only when the selected strategies are aligned, helping reduce noise and improve decision-making. PLEASE CONTACT ME AFTER PURCHASE TO GET
The Propfolio Master Suite is the ultimate all-in-one analytical workstation for professional traders. Combining the power of the Beat The Market Maker (BTMM) methodology, Smart Money Concepts (SND/Liquidity), and Advanced Volume Profile, this suite replaces multiple different indicators with one optimized engine. Monitor up to 14 pairs simultaneously from a single chart, instantly identify market cycles, and seamlessly map institutional footprints with the click of a button. The Command Center
Scalper Inside PRO
Alexey Minkov
4.74 (69)
Scalper Inside PRO Scalper Inside PRO is an intraday trend and scalping indicator for MetaTrader 4 that uses an exclusive algorithm to quickly detect market direction and key target levels. It automatically calculates entry, exit and multiple profit targets, and shows detailed performance statistics so you can see how different instruments and strategies performed. This helps you choose the most suitable trading instruments for the current market conditions. Additionally, you can easily integrat
M1 Sniper
Oleg Rodin
5 (23)
M1 SNIPER kullanımı kolay bir işlem göstergesi sistemidir. M1 zaman dilimi için tasarlanmış bir ok göstergesidir. Gösterge, M1 zaman diliminde scalping için bağımsız bir sistem olarak kullanılabilir ve mevcut işlem sisteminizin bir parçası olarak kullanılabilir. Bu işlem sistemi özellikle M1'de işlem yapmak için tasarlanmış olsa da, diğer zaman dilimleriyle de kullanılabilir. Başlangıçta bu yöntemi XAUUSD ve BTCUSD ticareti için tasarladım. Ancak bu yöntemi diğer piyasalarda işlem yaparken de ya
PZ Harmonacci Patterns
PZ TRADING SLU
3.17 (6)
Trade smarter, not harder: Empower your trading with Harmonacci Patterns This is arguably the most complete harmonic price formation auto-recognition indicator you can find for the MetaTrader Platform. It detects 19 different patterns, takes fibonacci projections as seriously as you do, displays the Potential Reversal Zone (PRZ) and finds suitable stop-loss and take-profit levels. [ Installation Guide | Update Guide | Troubleshooting | FAQ | All Products  ] It detects 19 different harmonic pric
PRO Renko Sistemi, RENKO grafikleri ticareti için özel olarak tasarlanmış son derece hassas bir ticaret sistemidir. Bu, çeşitli ticaret araçlarına uygulanabilen evrensel bir sistemdir. Sistemi etkin piyasa sana doğru ters sinyallerine erişim hakkı denilen ses nötralize eder. Göstergenin kullanımı çok kolaydır ve sinyal üretiminden sorumlu tek bir parametreye sahiptir. Aracı, seçtiğiniz herhangi bir ticaret aracına ve renko çubuğunun boyutuna kolayca uyarlayabilirsiniz. Yazılımımla karlı bir
Auto Optimized Parabolic RSI: Gelişmiş 3D Momentum Motoru Çoğu perakende indikatörü, piyasa volatilitesi değiştiği an çöken statik girdilere dayandığı için başarısız olur. Auto Optimized Parabolic RSI, kendi matematiksel avantajını sürekli olarak yeniden hesaplayarak "indikatör körelmesi" (indicator decay) sorununu çözer ve kurumsal düzeyde kantitatif adaptasyonu doğrudan MT5 terminalinize getirir. Temel Avantaj: Özel Bellek İçi (In-Memory) 3D Optimizasyon   Standart otomatik optimize ediciler,
NAM Order Blocks
NAM TECH GROUP, CORP.
3.67 (3)
MT4 Multi-timeframe Order Blocks detection indicator. Features - Fully customizable on chart control panel, provides complete interaction. - Hide and show control panel wherever you want. - Detect OBs on multiple timeframes. - Select OBs quantity to display. - Different OBs user interface. - Different filters on OBs. - OB proximity alert. - ADR High and Low lines. - Notification service (Screen alerts | Push notifications). Summary Order block is a market behavior that indicates order collection
Quants HL Break
Ferhat Mutlu
5 (2)
LH ve HL kesintilerini bulmak için saf fiyat eylemiyle yapılan gelişmiş hesaplama. Piyasada size büyük bir geri dönüş noktası verecektir.LH ve HL sinyalleri trengle çıkışları için de kullanılabilir. Koparma gerçekleştiğinde, güçlü bir geri dönüş olduğunu gösterir.Hareketli Ortalamalar için güzel bir filtre.Bunu trend göstergeleriyle kullanmanızı şiddetle tavsiye ederim. Destek ve direnç, arz talep göstergeleri için ekstra bir onay olarak kullanılabilir. Daha fazla ayrıntı aşağıdaki forex iş p
Dynamic Forex28 Navigator
Bernhard Schweigert
4.43 (7)
Dynamic Forex28 Navigator - Yeni Nesil Forex Ticaret Aracı. ŞU ANDA %49 İNDİRİM. Dynamic Forex28 Navigator, uzun zamandır popüler olan göstergelerimizin evrimidir ve üçünün gücünü tek bir göstergede birleştirir: Gelişmiş Döviz Gücü28 Göstergesi (695 inceleme) + Gelişmiş Döviz İMPULS ve UYARI (520 inceleme) + CS28 Kombo Sinyalleri (Bonus). Gösterge hakkında ayrıntılar https://www.mql5.com/en/blogs/post/758844 Yeni Nesil Güç Göstergesi Ne Sunuyor?  Orijinallerde sevdiğiniz her şey, şimdi yeni
RFI levels PRO
Roman Podpora
5 (1)
Bu gösterge, fiyat dönüş noktalarını ve fiyat geri dönüş bölgelerini doğru bir şekilde gösterir.       Başlıca oyuncular   . Yeni trendlerin nerede oluştuğunu görüyorsunuz ve her işlem üzerinde kontrolü elinizde tutarak, azami hassasiyetle kararlar alıyorsunuz. TREND LINES PRO   göstergesiyle birlikte kullanıldığında maksimum potansiyelini ortaya koyar.  VERSION MT5 Göstergenin gösterdiği şey: Yeni bir trendin başlangıcında aktivasyonla birlikte tersine dönüş yapıları ve tersine dönüş seviyeler
Trend Catcher ind
Ramil Minniakhmetov
TREND YAKALAYICI GÖSTERGE Trend Yakalayıcı Gösterge, yazarın tescilli ve özelleştirilmiş uyarlanabilir trend analiz göstergelerinin bir kombinasyonunu kullanarak piyasa fiyat hareketlerini analiz eder. Kısa vadeli gürültüyü filtreleyerek ve temel momentum gücüne, volatilite genişlemesine ve fiyat yapısı davranışına odaklanarak gerçek piyasa yönünü belirler. Ayrıca, hareketli ortalamalar, RSI ve volatilite filtreleri gibi yumuşatma ve trend filtreleme özelleştirilmiş göstergelerinin bir kombina
Apollo SR Master , Destek/Direnç bölgelerinde alım satımı daha kolay ve güvenilir hale getiren özelliklere sahip bir Destek/Direnç göstergesidir. Gösterge, yerel fiyat zirvelerini ve diplerini tespit ederek Destek/Direnç bölgelerini herhangi bir gecikme olmadan gerçek zamanlı olarak hesaplar. Ardından, yeni oluşan Destek/Direnç bölgesini doğrulamak için, Destek/Direnç bölgesinin dikkate alınabileceğini ve gerçek bir SAT veya AL sinyali olarak kullanılabileceğini gösteren özel bir sinyal gösterir
Bu indikatörü satın alırsanız, Profesyonel Trade Manager’ımı  + EA   ÜCRETSİZ olarak alacaksınız. Öncelikle, bu Ticaret Sistemi'nin Non-Repainting, Non-Redrawing ve Non-Lagging Göstergesi olduğunu vurgulamak önemlidir, bu da hem manuel hem de robot ticareti için ideal hale getirir. Online kurs, kılavuz ve ön ayarları indir. "Smart Trend Trading System MT5", yeni ve deneyimli tüccarlar için özelleştirilmiş kapsamlı bir ticaret çözümüdür. 10'dan fazla premium göstergeyi birleştiriyor ve 7'den faz
GoldRush Trend Ok Sinyali GoldRush Trend Ok Sinyali göstergesi, XAU/USD'de yüksek hızlı, kısa vadeli scalperlar için özel olarak tasarlanmış hassas, gerçek zamanlı trend analizi sağlar. 1 dakikalık zaman dilimi için özel olarak tasarlanan bu araç, net giriş noktaları için yön okları gösterir ve scalper'ların değişken piyasa koşullarında güvenle hareket etmelerini sağlar. Gösterge, PRIMARY ve SECONDARY uyarı oklarından oluşur. PRIMARY sinyalleri, trend yönündeki değişikliği gösteren Beyaz ve
Introduction to Fractal Pattern Scanner Fractal Indicator refers to the technical indicator that makes use of the fractal geometry found in the financial market. Fractal Pattern Scanner is the advanced Fractal Indicator that brings the latest trading technology after the extensive research and development work in the fractal geometry in the financial market. The most important feature in Fractal Pattern Scanner is the ability to measure the turning point probability as well as the trend probabi
ŞU ANDA %40INDIRIMLI Yeni Başlayanlar veya Uzman Tüccarlar için En İyi Çözüm! Bu Gösterge benzersiz, yüksek kaliteli ve uygun fiyatlı bir ticaret aracıdır çünkü bir dizi tescilli özellik ve yeni bir formül ekledik. Sadece BİR grafik ile 28 Forex çifti için Döviz Gücünü okuyabilirsiniz! Yeni bir trendin veya scalping fırsatının tam tetik noktasını belirleyebildiğiniz için ticaretinizin nasıl gelişeceğini hayal edin? Kullanım kılavuzu: buraya tıklayın Bu ilk olan, orijinal! Değersiz bir özent
Market Structure Patterns MT4
Samuel Manoel De Souza
5 (18)
Market Structure Patterns ,   smart money concepts   (akıllı para kavramları) temelinde geliştirilen ve   SMC/ICT   öğelerini grafik üzerinde gösteren bir göstergedir. Bu öğeler, işlem kararlarınızı bir üst seviyeye taşımanıza yardımcı olur. Grafikte bir unsur oluştuğunda, fiyat bir seviyeyi geçtiğinde veya bir kutu/bölgeye girdiğinde,   uyarılar ,   bildirimler   ve   e-posta mesajları   aracılığıyla anında bilgilendirilirsiniz. Geliştiriciler,   global variables   (küresel değişkenler) aracılı
Advanced Supply Demand
Bernhard Schweigert
4.91 (300)
Özel Ticaret –%40 İndirim Yeni Başlayanlar veya Uzman Yatırımcılar İçin En İyi Çözüm! Bu gösterge, bir dizi özel özellik ve yeni bir formül içerdiği için benzersiz, yüksek kaliteli ve uygun fiyatlı bir işlem aracıdır. Bu güncelleme ile çift zaman dilimi bölgeleri gösterebileceksiniz. Sadece daha yüksek bir zaman dilimini değil, hem grafik zaman dilimini hem de daha yüksek zaman dilimini gösterebileceksiniz: İÇ İÇE GEÇMİŞ BÖLGELER GÖSTERİYOR. Tüm Arz Talep yatırımcıları buna bayılacak. :) Önem
Advanced UT BOT ALERTS for MT4 Profesyonel Çok Katmanlı Trend Tespit Sistemi | Geliştirilmiş UT BOT Motoru Yalnızca yüksek kaliteli göstergeler sunuyoruz. Advanced UT BOT , profesyonel kullanım için tasarlanmıştır. Kararlı sinyal mantığı ve güvenli hesaplama yapısı sayesinde gecikme veya hatalı güncelleme olmaz. Geçmiş sinyalleri yeniden çizmez, değiştirmez veya silmez. Tüm BUY ve SELL sinyalleri mum kapanışı gerçekleştikten sonra oluşturulur ve sabitlenir. Canlı işlem sırasında repaint yoktur
Bu göstergeye dayalı bonus EA'yı almak için satın aldıktan sonra benimle iletişime geçin. Self Optimizing Double MA Strategy, parametre tahminlerini ortadan kaldırmak için tasarlanmış profesyonel düzeyde bir ticaret aracıdır. Yerleşik bir otomatik optimizasyon motoruyla desteklenen bu sistem, istatistiksel bir avantajı korumak için arka planda binlerce parametre kombinasyonunu simüle ederek değişen piyasa koşullarına sürekli olarak uyum sağlar. Statik ve güncelliğini yitirmiş ayarlara güvenmek
Eğer Forex piyasasında işlem yapıyorsanız, döviz gücü ve döviz çiftleri arasındaki korelasyon hakkında ayrıntılı bilgi sahibi olmak, işlem performansınızı yeni bir seviyeye taşıyabilir. Korelasyon, riskinizi yarıya indirmenize yardımcı olurken, güç analizi kârınızı maksimize etmenizi sağlar. Bu gösterge, döviz gücü analizi ile döviz çiftleri korelasyonunu birleştirerek en uygun döviz çiftlerini seçmek için hibrit bir yaklaşım sunar. Döviz Gücü Analizi Nasıl Kullanılır Örneğin, işlem stratejiniz
CRT Candle Range Theory HTF MT4.   Ultimate CRT Indicator: Advanced ICT Concepts and Malaysian SnR Trading System Discounted   Price   $50  !!     Secure your lifetime access   now   before it switches to   subscription-only ! Master the Market Maker's Footprints with the Most Advanced Candle Range Theory Indicator Unlock the true power of   Smart Money Concepts (SMC)   and trade precisely like the institutions with the   Ultimate CRT Indicator . Built exclusively for serious traders, this indic
Day Trader Master , günlük tüccarlar için eksiksiz bir ticaret sistemidir. Sistem iki göstergeden oluşmaktadır. Bir gösterge, satın almak ve satmak için bir ok işaretidir. Aldığınız ok göstergesidir. Size ikinci göstergeyi ücretsiz olarak sağlayacağım. İkinci gösterge, bu oklarla birlikte kullanılmak üzere özel olarak tasarlanmış bir trend göstergesidir. GÖSTERGELER TEKRARLAMAYIN VE GEÇ KALMAYIN! Bu sistemi kullanmak çok basittir. İki renkli bir çizgi olarak görüntülenen mevcut trend yönündeki o
KURAMA GOLD SIGNAL PRO (MT4) — 7 Katmanlı Filtre, Otomatik TP/SL ve Kalite Puanı ile Komple XAUUSD Trading Sistemi REPAINT YOK. YENİDEN ÇİZİM YOK. GECİKME YOK. Her sinyal kalıcıdır. Gördüğün, aldığındır. BONUS: Ömür boyu lisansı al ve AI Zone Radar ($59 değerinde) + tam PDF kılavuzunu ÜCRETSİZ al. Satın aldıktan sonra bana mesaj gönder. AI Zone Radar: https://www.mql5.com/en/market/product/175834 TRADERLAR GÜVENİYOR: Aktif bir Altın trader topluluğu tarafından zaten kullanılıyor. Hassasiyet
" Dynamic Scalper System " göstergesi, trend dalgaları içinde işlem yapmak için scalping yöntemi için tasarlanmıştır. Başlıca döviz çiftleri ve altın üzerinde test edilmiştir, diğer işlem araçlarıyla uyumluluğu mümkündür. Ek fiyat hareketi desteğiyle trend boyunca pozisyonların kısa vadeli açılması için sinyaller sağlar. Göstergenin prensibi. Büyük oklar trend yönünü belirler. Küçük oklar şeklinde scalping için sinyaller üreten bir algoritma trend dalgaları içinde çalışır. Kırmızı oklar yüksel
Master head and shoulders patterns for better trading decisions A head and shoulders pattern is a chart formation that resembles a baseline with three peaks, the outside two are close in height and the middle is highest. It predicts a bullish-to-bearish trend reversal and is believed to be one of the most reliable trend reversal patterns. It is one of several top patterns that signal, with varying degrees of accuracy, that a trend is nearing its end. [ Installation Guide | Update Guide | Trouble
Trade double tops and bottoms effectively The PZ Double Top/Bottom Indicator is a technical analysis tool that helps traders identify potential price reversal patterns in the market. These patterns, known as double tops and bottoms, are characterized by two consecutive peaks or valleys in the price of an asset. Double tops and bottoms are often seen as potential reversal patterns because they can signal a change in the direction of the current trend. [ Installation Guide | Update Guide | Troubl
Apex Break PRO, MetaTrader 4 için yeniden çizim yapmayan bir pivot trend çizgisi kırılım göstergesidir. Pivot yükseklerini ve pivot düşüklerini tespit eder, ardışık pivotlar arasında dinamik eğimli trend çizgileri çizer ve fiyat onaylanmış bir bar kapanışında bu trend çizgilerini kırdığında alım ve satım sinyalleri üretir. Her sinyal en fazla dört bağımsız konfluans katmanından geçirilerek filtrelenir — EMA trendi, RSI sınırları, hacim ani artış tespiti ve ADX trend gücü — ve yıldız derecelendir
Yazarın diğer ürünleri
Limited-time free release: this indicator is free while we collect real trader feedback. Please leave a comment with your requests, issues, settings ideas, or features you want us to consider for the premium version. SuperTrend ATR Signals is a chart-window trend indicator that plots a SuperTrend line using ATR volatility and highlights trend flips with optional buy and sell arrows. Use it to spot: Current trend direction. Possible trend-change areas. ATR-based trailing support and resistance. C
FREE
Cyclic RSI Adaptive Bands MT5
Mattia Marco Platania
5 (1)
Limited-time free release: this indicator is free while we collect real trader feedback. Please leave a comment with requests, issues, setting ideas, or features you want us to consider for future versions. Cyclic RSI Adaptive Bands MT5 is a separate-window oscillator that displays a cyclic Relative Strength Index line with adaptive upper and lower bands. The bands adjust to recent oscillator behavior. This helps show when momentum has moved far from its recent range and when it returns toward t
FREE
Limited-time free release: this indicator is free while we collect real trader feedback. Please leave a comment with your requests, issues, settings ideas, or features you want us to consider for the premium version. FVG Imbalance Zones is a free MT5 chart indicator that automatically marks bullish and bearish fair value gap zones. It scans three-candle price imbalances, filters out small gaps, and manages zones as price interacts with them. Use it to spot: Bullish fair value gaps where buyers c
FREE
Limited-time free release: this indicator is free while we collect real trader feedback. Please leave a comment with your requests, issues, settings ideas, or features you want us to consider for the premium version. Opening Range FVG Breakout MT5 marks the opening range, breakout levels, projected targets, and optional Fair Value Gap confluence zones. Use it to: Frame the first range of a trading session. Spot bullish and bearish breakouts beyond the range. Filter breakout arrows with FVG confl
FREE
Limited-time free release: this indicator is free while we collect real trader feedback. Please leave a comment with your requests, issues, settings ideas, or features you want us to consider for the premium version. Inversion FVG Volume Flow MT5 is a free MT5 chart indicator that marks volume-confirmed fair value gaps and highlights inversion FVG zones after price breaks through a gap. Use it to spot: Fair value gaps created by stronger-than-average tick volume. Fresh bullish and bearish FVG zo
FREE
Limited-time free release: this indicator is free while we collect real trader feedback. Please leave a comment with your requests, issues, settings ideas, or features you want us to consider for the premium version. Cumulative Delta Flow MT5 is a separate-window tick-volume flow oscillator for MetaTrader 5. It estimates signed buying and selling pressure from candle position, candle direction, and tick volume, then plots a cumulative delta line with a signal line and divergence markers. Use it
FREE
Limited-time free release: this indicator is free while we collect real trader feedback. Please leave a comment with your requests, issues, settings ideas, or features you want us to consider for the premium version. FVG Imbalance Zones is a free MT4 chart indicator that automatically marks bullish and bearish fair value gap zones. It scans three-candle price imbalances, filters out small gaps, and manages zones as price interacts with them. Use it to spot: Bullish fair value gaps where buyers c
FREE
Limited-time free release: this indicator is free while we collect real trader feedback. Please leave a comment with requests, issues, settings ideas, or features you want us to consider for the premium version. FFT Dominant Cycle Finder estimates the current dominant market cycle length from recent price action using an FFT-based spectrum scan. Use it to: Choose adaptive periods for oscillators, RSI, stochastic, moving averages, or cycle tools. See when the market rhythm is shortening or stretc
FREE
Limited-time free release: this indicator is free while we collect real trader feedback. Please leave a comment with your requests, issues, settings ideas, or features you want us to consider for the premium version. SuperTrend ATR Signals MT4 is a chart-window trend indicator that plots a SuperTrend line using ATR volatility and highlights trend flips with optional buy and sell arrows. Use it to spot: Current trend direction. Possible trend-change areas. ATR-based trailing support and resistanc
FREE
Limited-time free release: this indicator is free while we collect real trader feedback. Please leave a comment with your requests, issues, settings ideas, or features you want us to consider for the premium version. Session VWAP Bands plots the session volume-weighted average price and adaptive deviation bands directly on the chart. It helps you see where price is trading relative to the current session's fair-value area. Use it to spot Price holding above or below session VWAP. Mean-reversion
FREE
Limited-time free release: this indicator is free while we collect real trader feedback. Please leave a comment with your requests, issues, settings ideas, or features you want us to consider for the premium version. Opening Range FVG Breakout MT4 marks the opening range, breakout levels, projected targets, and optional Fair Value Gap confluence zones. Use it to: Frame the first range of a trading session. Spot bullish and bearish breakouts beyond the range. Filter breakout arrows with FVG confl
FREE
Limited-time free release: this indicator is free while we collect real trader feedback. Please leave a comment with your requests, issues, settings ideas, or features you want us to consider for the premium version. Cumulative Delta Flow MT4 is a separate-window tick-volume flow oscillator for MetaTrader 4. It estimates signed buying and selling pressure from candle position, candle direction, and tick volume, then plots a cumulative delta line with a signal line and divergence markers. Use it
FREE
Limited-time free release: this indicator is free while we collect real trader feedback. Please leave a comment with your requests, issues, settings ideas, or features you want us to consider for the premium version. Inversion FVG Volume Flow MT4 is a free MT4 chart indicator that marks volume-confirmed fair value gaps and highlights inversion FVG zones after price breaks through a gap. Use it to spot: Fair value gaps created by stronger-than-average tick volume. Fresh bullish and bearish FVG zo
FREE
Limited-time free release: this indicator is free while we collect real trader feedback. Please leave a comment with requests, issues, setting ideas, or features you want us to consider for future versions. Cyclic RSI Adaptive Bands MT4 is a separate-window oscillator that displays a cyclic Relative Strength Index line with adaptive upper and lower bands. The bands adjust to recent oscillator behavior. This helps show when momentum has moved far from its recent range and when it returns toward t
FREE
Limited-time free release: this indicator is free while we collect real trader feedback. Please leave a comment with requests, issues, settings ideas, or features you want us to consider for the premium version. FFT Dominant Cycle Finder estimates the current dominant market cycle length from recent price action using an FFT-based spectrum scan. Use it to: Choose adaptive periods for oscillators, RSI, stochastic, moving averages, or cycle tools. See when the market rhythm is shortening or stretc
FREE
Price Action Boxes MT4 is a premium MT4 indicator that maps three price-action zones on the chart: wick rejection boxes, FVG/imbalance boxes, and choppiness-based consolidation boxes. The important part is how the boxes interact. Imbalances can trim wick and consolidation zones. Consolidations can trim imbalance and wick zones. Small overlaps are ignored, nested zones can remain visible, and oversized same-type merges are limited so the chart stays focused on areas that still matter. Use it to s
Delta Volume Profile Zones is a compact volume-profile indicator for traders who want price-level context without turning the chart into a crowded footprint screen. It builds a rolling profile from recent candles, separates estimated bullish and bearish participation, and marks the key zones traders usually watch: Point of Control, Value Area High, Value Area Low, high-volume nodes, and low-volume areas. Use it to: Identify where recent trading activity is concentrated. Find the Point of Control
Price Action Boxes MT5 is a premium MT5 indicator that maps three price-action zones on the chart: wick rejection boxes, FVG/imbalance boxes, and choppiness-based consolidation boxes. The important part is how the boxes interact. Imbalances can trim wick and consolidation zones. Consolidations can trim imbalance and wick zones. Small overlaps are ignored, nested zones can remain visible, and oversized same-type merges are limited so the chart stays focused on areas that still matter. Use it to s
Delta Volume Profile Zones is a compact volume-profile indicator for traders who want price-level context without turning the chart into a crowded footprint screen. It builds a rolling profile from recent candles, separates estimated bullish and bearish participation, and marks the key zones traders usually watch: Point of Control, Value Area High, Value Area Low, high-volume nodes, and low-volume areas. Use it to: Identify where recent trading activity is concentrated. Find the Point of Control
Filtrele:
Değerlendirme yok
Değerlendirmeye yanıt