GDS Renko Structure
- Göstergeler
- Sürüm: 1.5
- Güncellendi: 11 Haziran 2026

GDS Renko Structure
Free Renko Structure Indicator for MetaTrader 5
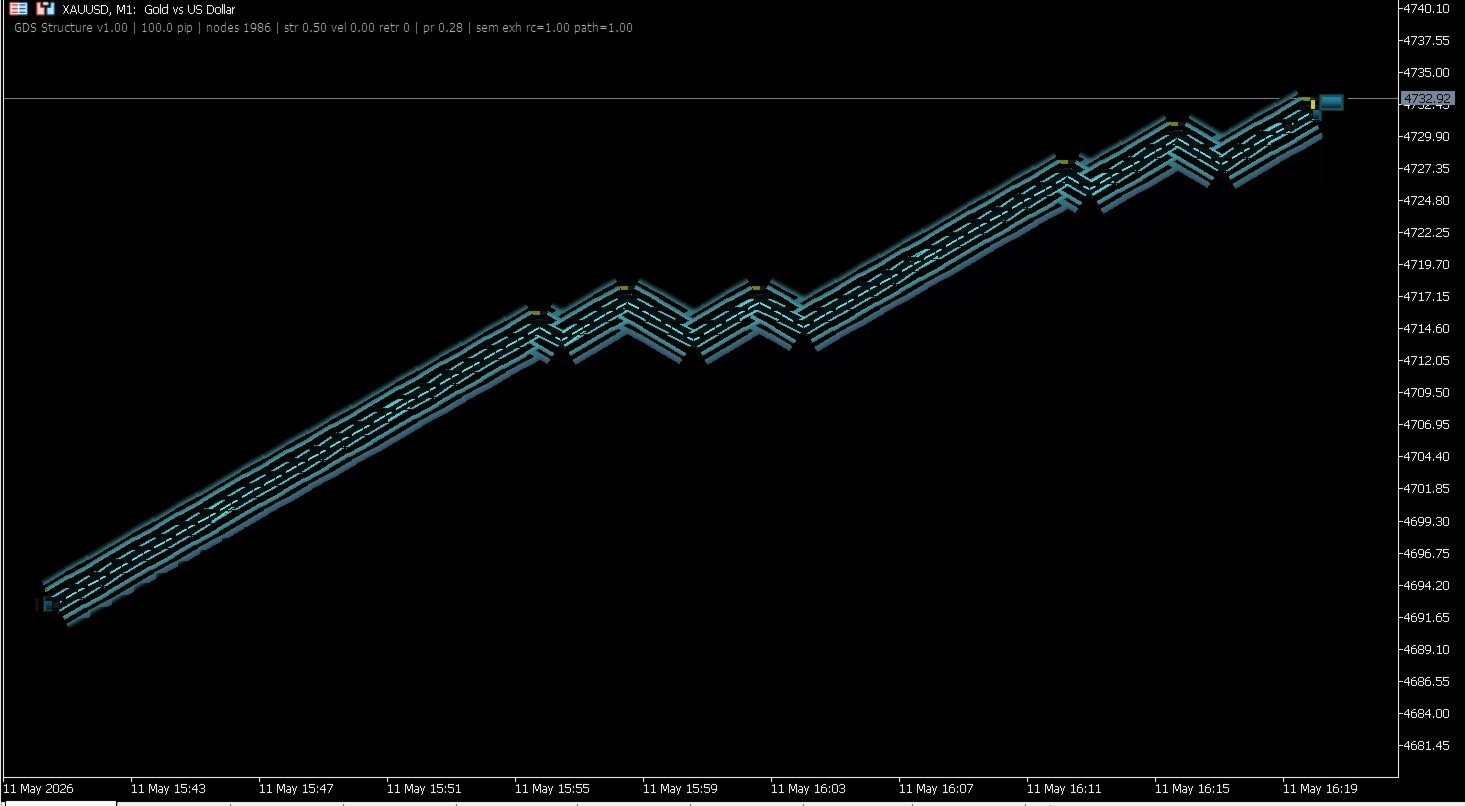
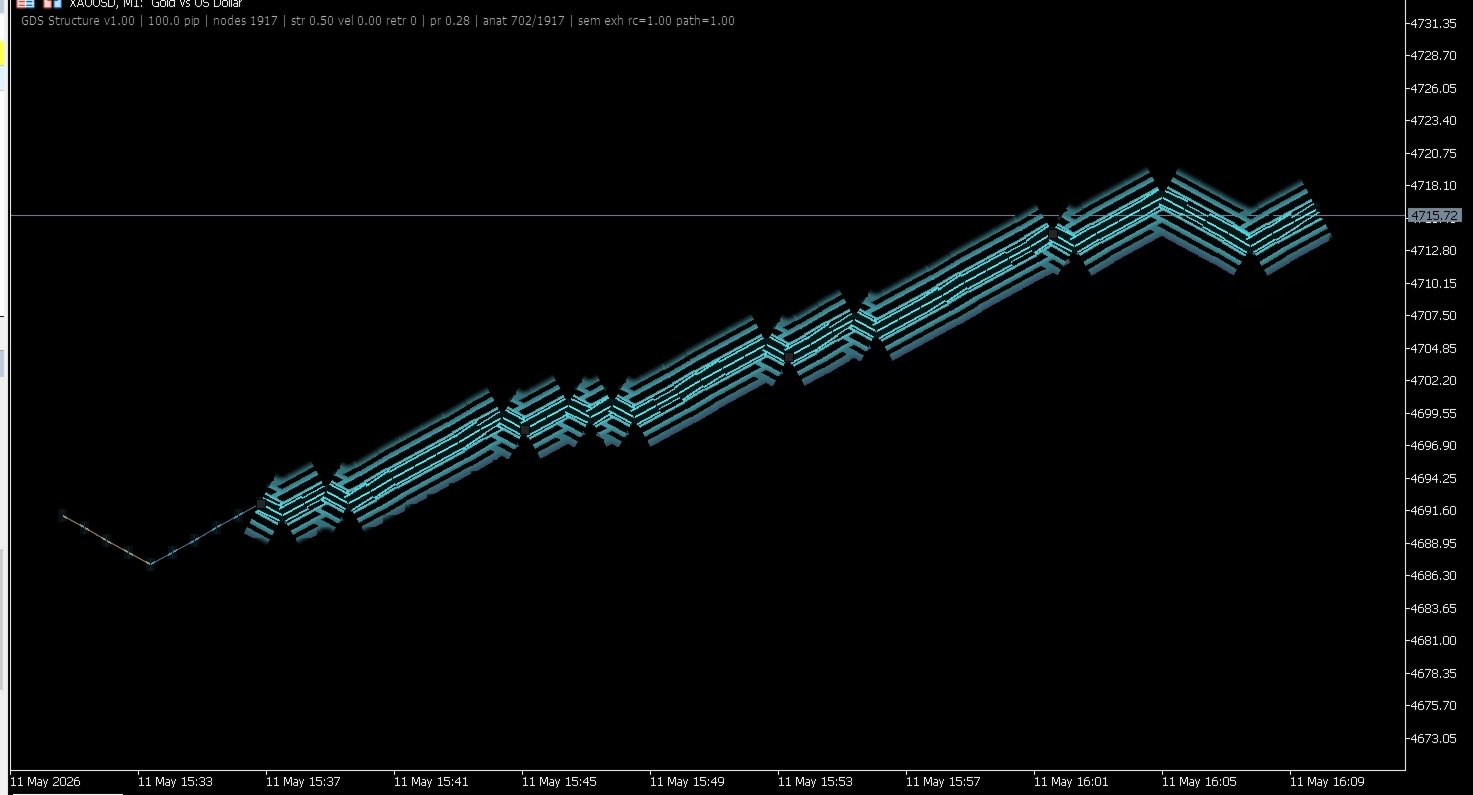
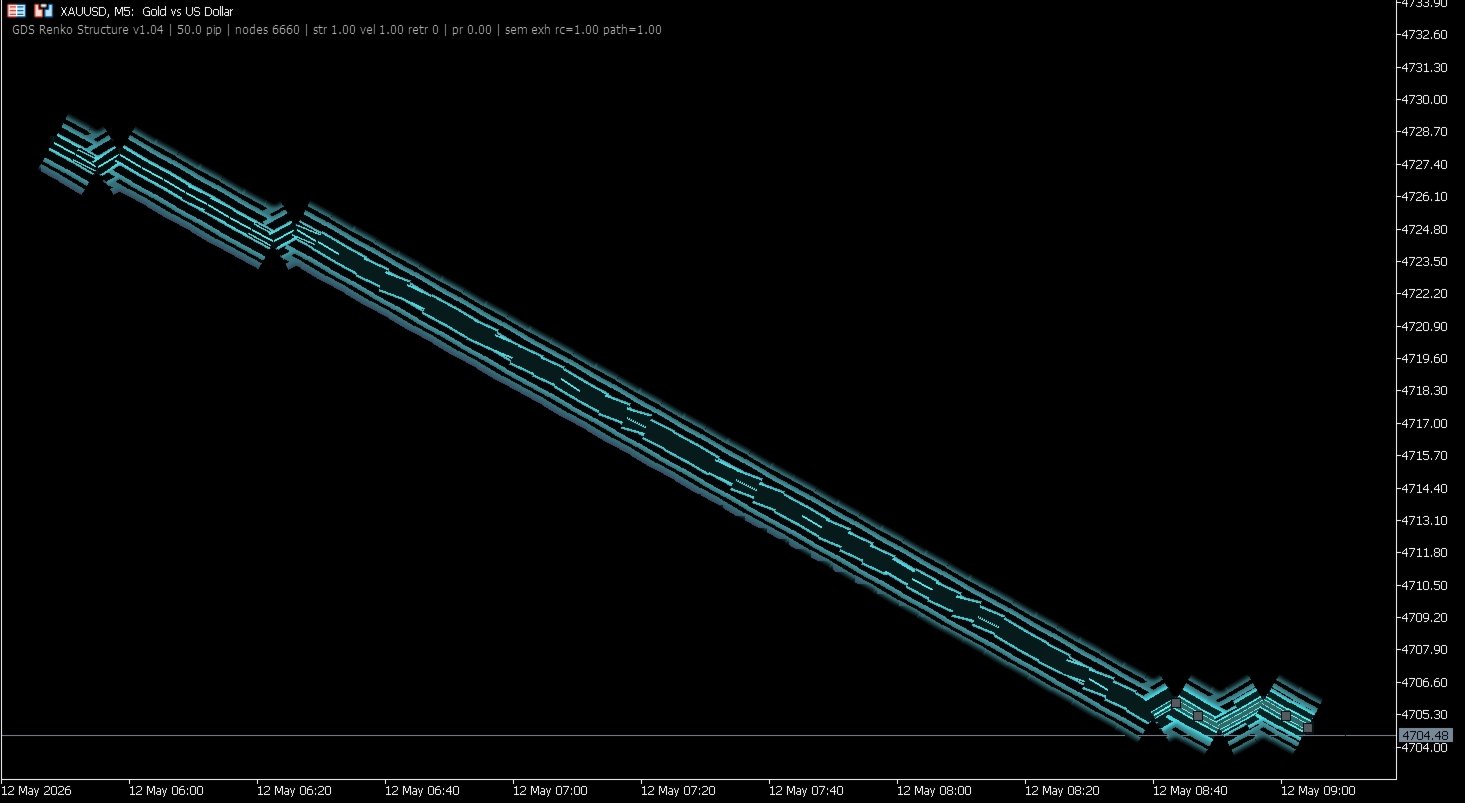
GDS Renko Structure is a free MetaTrader 5 indicator for traders who use Renko charts and want a clearer way to read market structure, movement phases and brick-based behavior.
The indicator helps visualize how Renko structure is forming on the chart: movement legs, pauses, continuation areas, pullback behavior and structural shifts.
It does not give buy or sell signals. It does not predict price movement. It is a visual context tool for manual Renko structure analysis.
The core idea
Renko charts simplify price movement, but structure still needs interpretation.
A sequence of bricks can show trend, pause, pullback, continuation or weakening movement. GDS Renko Structure helps make these phases easier to observe directly on the chart.
What it helps you read
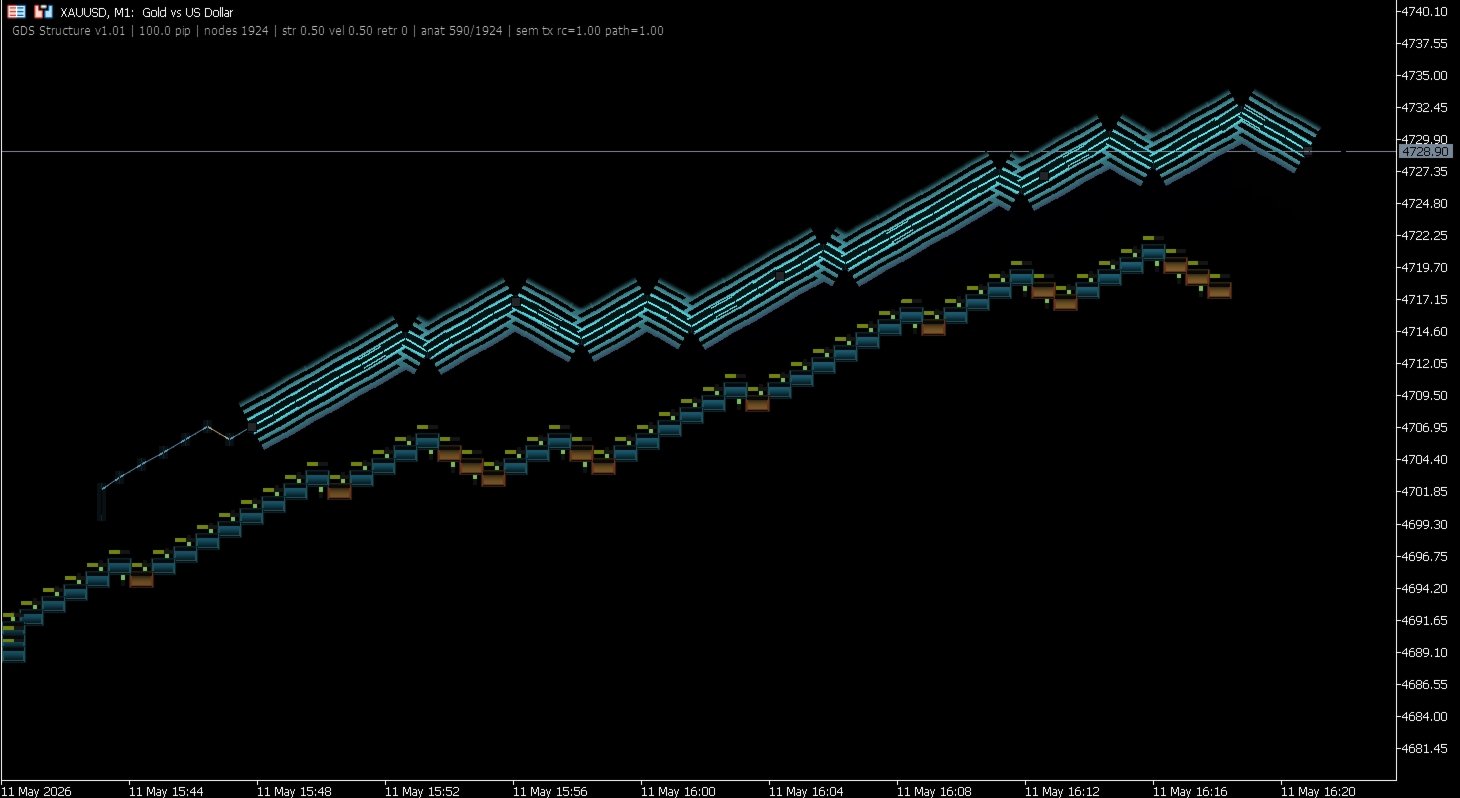
Renko movement structure
Observe how brick movement develops into legs, pauses and continuation areas.
Trend and pullback behavior
Review whether movement is extending, correcting or losing clarity.
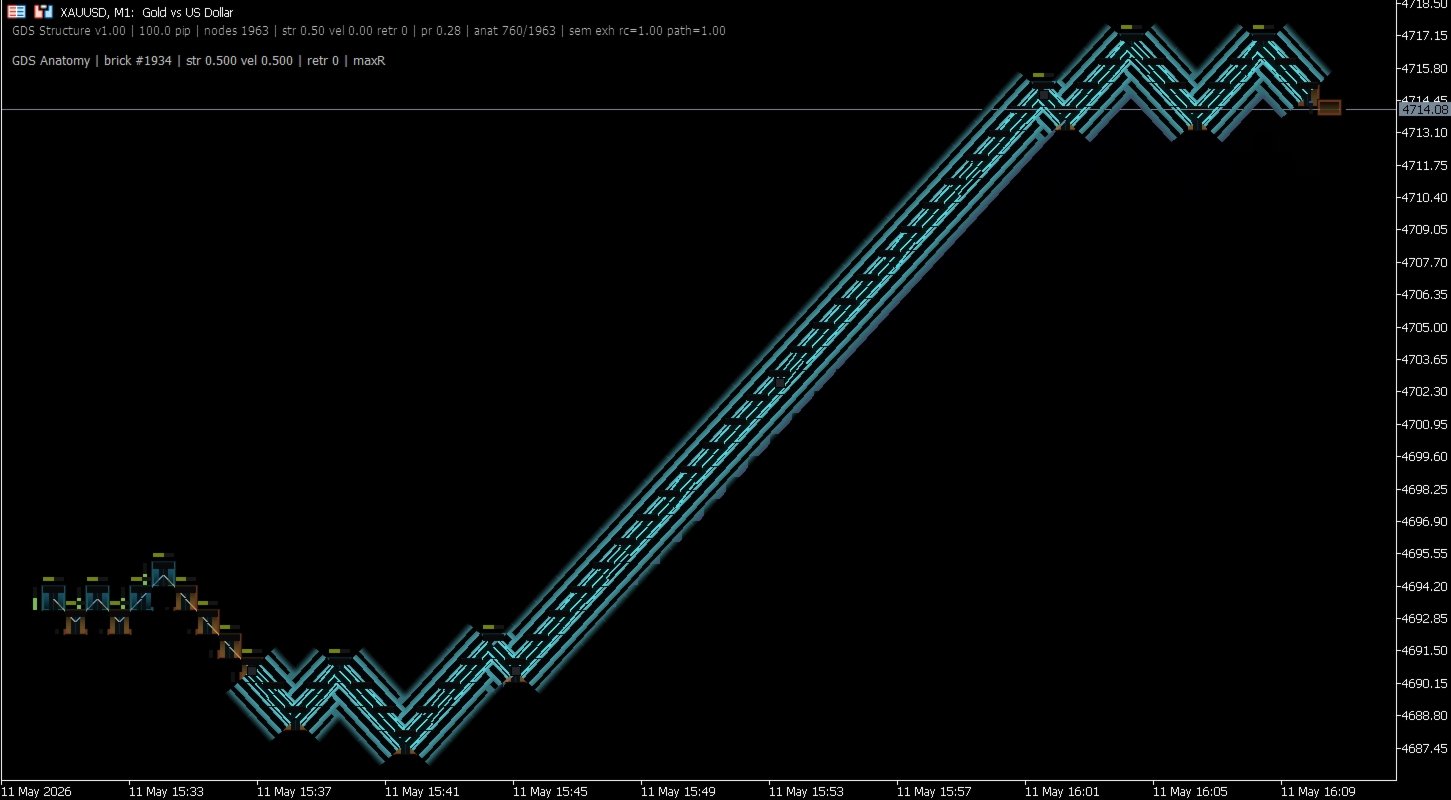
Structure changes
Notice when the current Renko flow begins to change character.
Cleaner chart context
Use structure visualization as a base layer before adding momentum, zones or execution tools.
Manual analysis support
The indicator helps the trader read the chart. It does not decide what trade to take.
Typical workflow
- Build or open a Renko chart in MetaTrader 5.
- Add GDS Renko Structure to the chart.
- Review the current movement phase.
- Compare structure with zones and momentum context.
- Use the information as part of a manual trading plan.
How it fits the Golden Delta ecosystem
- GDS Auto Renko Support and Resistance Zones - free Renko support and resistance zone layer.
- GDS Renko Zones Intelligence - premium zone score, freshness, active verdict and Top Zones context.
- GDS Renko Pulse - free Renko activity and momentum rhythm context.
- GDS Renko Anatomy - free Renko structure and movement anatomy layer.
- GDS Renko Mirror MT5 - premium multi-scale Renko structure comparison.
- GDS RiskLab TradeDesk Renko Pro Edge - advanced manual execution and risk-control cockpit.
Who it is for
- Renko traders who want cleaner structure reading
- MetaTrader 5 users building a Renko analysis workspace
- XAUUSD, forex, index or crypto traders using Renko charts
- manual traders who prefer structure context instead of signal arrows
- users exploring the Golden Delta Renko ecosystem
Useful for
- Renko structure analysis
- trend and pullback review
- movement phase observation
- brick-based chart reading
- building a free Renko workflow in MetaTrader 5
What it is not
- not a buy/sell signal indicator
- not an automatic trading robot
- not a prediction tool
- not financial advice
- not a guarantee of trading results
Important: GDS Renko Structure is a visual context indicator for manual Renko analysis. It does not place trades and does not guarantee any trading result. Always test settings on a demo account before live trading and use proper risk management.
Renko, MT5, Renko Structure, Renko Indicator, XAUUSD, MetaTrader 5, Free Indicator, Market Structure, Renko Trading, Manual Trading, Golden Delta

Kullanıcı değerlendirmeye herhangi bir yorum bırakmadı