Visual Order Book

1

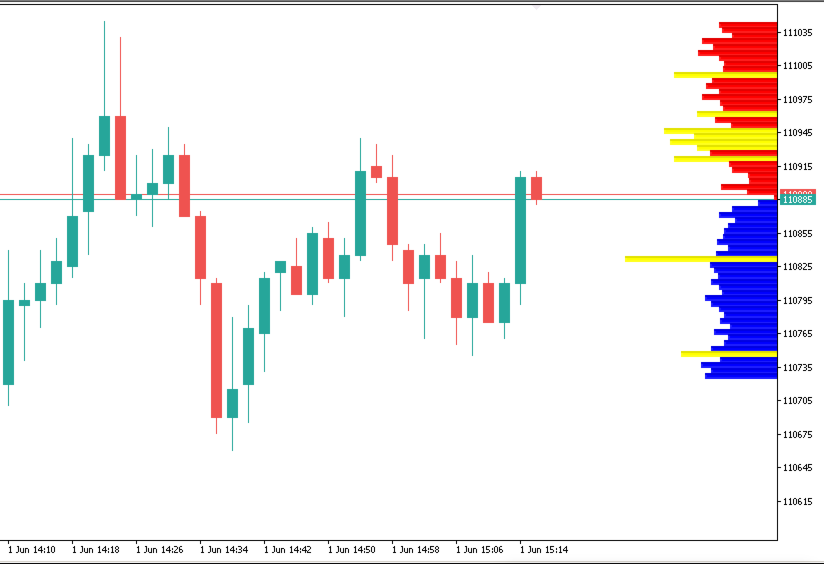
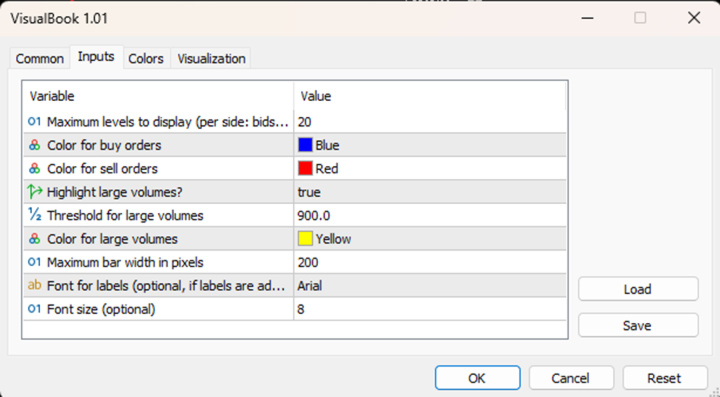
Sblocca potenti intuizioni di mercato con questo indicatore che mostra un libro ordini visivo sul grafico, ispirato al Visual Book di Profit di Nelogica. Visualizza barre orizzontali che rappresentano i volumi di acquisto (blu) e di vendita (rosso), con evidenziatura in giallo per i volumi elevati, facilitando l'identificazione delle zone ad alta liquidità. Il prezzo tende a muoversi verso le aree con le maggiori concentrazioni di ordini, rendendolo uno strumento essenziale per individuare livelli di supporto e resistenza. Le impostazioni personalizzabili si adattano a qualsiasi stile di trading, e gli aggiornamenti in tempo reale ti tengono al passo con le dinamiche di mercato. Ideale per forex, azioni e altri mercati su MetaTrader 5. Richiede dati di profondità di mercato (libro ordini) forniti dal broker. Scaricalo ora per migliorare le tue decisioni di trading con analisi chiare e pratiche!


Prodotti consigliati
FT ADX Color Candles
FELIPE MISAEL MORAES KRUGER
5 (7)
Trading can be quite tiring when you need to look at several things at the same time. Format of candles, supports, resistances, schedules, news and indicators. This tool aims to facilitate the analysis of the ADX indicator. It colors the candles based on the levels of the indicator and the DI lines. The period, the limit of the indicator and the colors of the candles are customizable. You can also place a visual aid on the lower right side of the graph to view the values of ADX, DI + and DI-
FREE
Daily HiLo
Nicanor Jr Cagape Layco
DailyHiLo Indicator Master the daily range like a pro. This indicator automatically plots the previous day’s high and low levels —a core element in the (Beat The Market Maker) trading approach—directly on your chart. These levels act as natural boundaries for intraday price action, helping traders identify potential reversal zones, breakout points, and liquidity targets. Key Features Accurate plotting of yesterday’s high and low for any symbol and timeframe. Works seamlessly with BTMM-inspired
FREE
TilsonT3
Jonathan Pereira
5 (1)
Tillson's T3 moving average was introduced to the world of technical analysis in the article ''A Better Moving Average'', published in the American magazine Technical Analysis of Stock Commodities. Developed by Tim Tillson, analysts and traders of futures markets soon became fascinated with this technique that smoothes the price series while decreasing the lag (lag) typical of trend-following systems.
FREE
Smart Flow Bands
Mohamad Sami Taleb
How the Sell Signal Works 1. Bollinger Band condition The current candle must close at or above the Upper Bollinger Band . This signals potential overbought conditions. 2. OBV confirmation (On Balance Volume) OBV must be falling → OBV_now < OBV_prev . Stronger confirmation: OBV decreasing for 2–3 consecutive bars. This shows that buying pressure is weakening . 3. ATR filter (Average True Range) Current ATR must be below its moving average (e.g., ATR_now < ATR_SMA(14) * 1.2 ). Purpose: avoid ente
FREE
Donchian Pro
Paulo Henrique Faquineli Garcia
5 (3)
The Donchian Channel Channels are among the most popular tools of technical analysis, as they visually convey to the analyst the limits within which most price movement tends to occur. Channel users know that valuable information can be obtained at any time, whether prices are in the central region of a band or close to one of the border lines. One of the best known techniques to explore these concepts is Bollinger Bands. However, John Bollinger was not the only one to research the application
FREE
Market Momentum
Flavio Javier Jarabeck
4.33 (6)
The Market Momentum indicator is based on the Volume Zone Oscillator (VZO), presented by Waleed Aly Khalil in the 2009 edition of the International Federation of Technical Analysts journal, and presents a fresh view of this market valuable data that is oftenly misunderstood and neglected: VOLUME. With this new approach of "seeing" Volume data, traders can infer more properly market behavior and increase their odds in a winning trade. "The VZO is a leading volume oscillator; its basic usefulness
FREE
Bollinger colorido
Sergio Domingues
5 (1)
Funciona como bandas de bollinger normais. Criado por Joe Ross, é um setup de maior risco por ser contra-tendência. Pode ser usado para Day Trade, Swing Trade e Position. Para identificar, é necessário inserir no gráfico as Bandas de Bollinger, com uma Média Móvel Simples de 20 períodos e largura (desvio) 2. Verifica-se um fechamento de determinado candle abaixo da banda inferior de Bollinger. Se o próximo candle fechar dentro das Bandas, marca-se a máxima dele. O rompimento dessa máxima será o
FREE
Quantitative Candlesticks Qstick
Flavio Javier Jarabeck
4 (2)
Qstick is a way to objectively quantify candlestick analysis and improve the interpretation of candlestick patterns. Qstick was developed by Tushar Chande and published in his book " The New Technical Trader - Boost Your Profit by Plugging Into the Latest Indicators (1994) ". Qstick is built based on a moving average of the difference between the Open and Close prices. The basis of the idea is that the Opening and Closing prices are the heart of candlestick analysis. We strongly recommend the re
FREE
Swing BOS Structure is a market structure indicator for MetaTrader 5. The indicator automatically detects: • Swing High (SH) • Swing Low (SL) • Break of Structure (BOS) • Change of Character (CHoCH) Swings are confirmed only after a defined number of candles, ensuring no repainting. BOS signals indicate trend continuation. CHoCH signals indicate a potential change in market structure and may appear less frequently depending on market conditions and timeframe. The indicator is lightweight, fa
FREE
Candle Zones
Flavio Javier Jarabeck
You probably heard about Candlesticks behaviors, which in most of the times could denote and trace Volume behaviors even if you are not watching Volume itself... Well, this indicator will do this. Naked traders love to rely solely on candlesticks patterns and with Candle Zones you can trap special patterns and DRAW THEM on your chart. As simple as that. There are several filters you can tweak in order to achieve the analysis you want. Just give it a try. After several months of testing, we think
FREE
Wave Box Market Frenquency
Jean Jacques Huve Ribeiro
4.75 (4)
Totally linked to the result of a movement and the duration he had. Its height records how many ticks the asset walked during a given movement, its width shows us the duration that movement had. Its configuration must be in line with the Weis Wave Indicator configuration to observe the movement force and can indicate a possible accumulation or distribution of the movement;
FREE
VolumesWithMedia
Jonathan Pereira
5 (1)
Volume is a widely used indicator in technical analysis, however there is a variation that is even more useful than Volume alone: the Moving Average of Volume. It is nothing more than a moving average applied to the popular Volume indicator. As the name says, Volume + MA serves to display the transacted volume (purchases and sales executed) of a certain financial asset at a given point of time together with the moving average of that same volume over time. What is it for? With the Volume + M
FREE
(Special New Year promotion - free price!) The indicator displays the actual 'Scale in points per bar' (identical to the manual setting in the Terminal, see screenshot) in the upper right corner of the chart. The displayed value changes INSTANTLY whenever the chart scale is changed! (This is very convenient when planning screenshots). In Settings: Change language (Russian/English), font size of the displayed text, text label offset coefficient from the graph corner, equally in X and Y directi
FREE
Stackable VWAP
Flavio Javier Jarabeck
3.5 (4)
Volume Weighted Average Price (VWAP) is a trading benchmark commonly used by Big Players that gives the average price a Symbol has traded throughout the day. It is based on both Volume and price. Additionally we put in this indicator the MVWAP (Moving Volume Weighted Average Price). For those who do not know the usage and the importance od this indicator I recommend a great article about this subject at Investopedia ( https://www.investopedia.com/articles/trading/11/trading-with-vwap-mvwap.asp
FREE
Ratio X Trend Watcher – Advanced Trendline Breakout Indicator Ratio X Trend Watcher is a professional indicator designed to analyze price action, draw trendlines on the current chart timeframe, and detect meaningful breakouts. Built for traders who rely on support and resistance levels, this tool offers clear visual cues and optional automated actions to help improve your trading decisions. Developed by Mauricio Vellasquez, it is part of the Ratio X suite of trading systems. Key Features Real‑t
FREE
Strong movement levels
Nikolay Mitrofanov
5 (2)
Looks for strong price movements and draws levels upon their completion. You determine the strength of the movement yourself by specifying in the settings the number of points and the number of candles of the same color in a row in one direction. There are 2 types of building in the settings: extrenum - high / low close - close price You can also adjust the number of displayed levels and the number of candles for calculations. By default, the settings indicate 5 levels for 360 candles. That
FREE
Steady Bands3
Roberto Tavares
Equidistant bands indicator with calculated moving average, allows you to configure the band size and can be used freely as an entry / exit indicator. Buffer 0 = price, buffer 1 = upper band, buffer 2 = lower band. you can also configure the periods of moving averages used in the calculations and also the shift to previous bars in addition to the price that can CLOSE (default) or OPEN. Excellent for fast daily moving pairs and frequent returns.
FREE
Rejection Zones
Paulo Henrique Faquineli Garcia
Este poderoso indicador analisa o gráfico e mostra zonas de Rejeição de Preços! Isto é, locais onde o preço foi, mas não foi aceito pelo mercado! A visualização desta zona de Rejeição, facilita o entendimento do trader na tomada de decisões de onde operar e como operar! O indicador é composto por 4 linhas, sendo classificadas em 2 grupos: Linhas Vermelha e Amarela: Denotam os extremos onde o preço conseguiu chegar, mas não foi aceito! Linhas Laranja e Azul: A partir delas, denotam o Início da z
FREE
Descrizione generale Questo indicatore è una versione avanzata del classico Donchian Channel , arricchita con funzioni operative per il trading reale. Oltre alle tre linee tipiche (massimo, minimo e linea centrale), il sistema rileva i breakout e li segnala graficamente con frecce sul grafico, mostrando solo la linea opposta alla direzione del trend per semplificare la lettura. L’indicatore include: Segnali visivi : frecce colorate al breakout Notifiche automatiche : popup, push e email Filtro R
FREE
Il Tenet Support & Resistance Pro è un indicatore avanzato per MetaTrader 5, progettato per aiutare i trader a identificare con precisione le principali aree di supporto e resistenza del mercato. Basandosi sulla cronologia dei prezzi, l'indicatore traccia automaticamente linee orizzontali che evidenziano zone strategiche. Inoltre, evidenzia in tempo reale l'area attuale in cui la candela viene negoziata , fornendo una visione chiara delle aree critiche di decisione. Una caratteristica esclusi
FREE
Quarter EMA
Jithin Sajan Sajan
5 (2)
Kindly rate and comment about the product for upgradation & Support The 5 EMA is plotted in green color ( Lime ). The 14 EMA is plotted in red color ( Red ). The 20 EMA is plotted in blue color ( Blue ). The 200 EMA is plotted in yellow color ( Yellow ). The Quarter EMA that provided calculates and plots four Exponential Moving Averages (EMAs) on the chart using different periods: 5, 14, 20, and 200. Each EMA is represented by a different color on the chart. Here's a description of each EMA:
FREE
Quintet EMA
Jithin Sajan Sajan
Kindly rate and comment about the product for upgradation & Support The   5 EMA   is plotted in   green   color ( Lime ). The  14 EMA  is plotted in  red  color ( Red ). The   20 EMA   is plotted in   blue   color ( Blue ). The  200 EMA  is plotted in  black  color ( Black ). The   200 EMA   is plotted in   yellow   color ( Yellow ). The Quarter EMA that provided calculates and plots four Exponential Moving Averages (EMAs) on the chart using different periods: 5, 14, 20, and 200. Each EMA is
FREE
RSI abcd
Francisco Gomes Da Silva
3 (1)
RSI ABCD Pattern Finder: Strategia Tecnica 1. Come Funziona l'Indicatore Combina il RSI classico con il rilevamento automatico di pattern armonici ABCD . Componenti Principali RSI standard (periodo regolabile) Marcatori di massimi e minimi (frecce) Pattern ABCD (linee verdi/rosse) Filtri ipercomprato (70) e ipervenduto (30) 2. Configurazione su MT5 period = 14 ; // Periodo RSI size = 4 ; // Dimensione massima del pattern OverBought = 70 ; // Livello ipercomprato OverSold = 30 ; // Livello iperve
FREE
Volume Profile Density V2.40 Mostra la distribuzione del volume per livello di prezzo, evidenziando le zone di interesse istituzionale. A differenza del volume tradizionale (nel tempo), indica dove il volume si è realmente concentrato. Principi base: Barre orizzontali = volume scambiato a ciascun prezzo Barra più lunga → volume maggiore Zone rosse = principali supporti/resistenze Utilizzi principali: Identificare supporti e resistenze reali Determinare il POC (Point of Control) Definire la Value
FREE
Spike Catch Pro
Amani Fungo
4.14 (7)
Spike Catch Pro 22:03 release updates Advanced engine for searching trade entries in all Boom and Crash pairs (300,500 and 1000) Programmed strategies improvements Mx_Spikes (to combine Mxd,Mxc and Mxe), Tx_Spikes,   RegularSpikes,   Litho_System,   Dx_System,   Md_System,   MaCross,   Omx_Entry(OP),  Atx1_Spikes(OP),   Oxc_Retracement (AT),M_PullBack(AT) we have added an arrow on strategy identification, this will help also in the visual manual backtesting of the included strategies and see ho
FREE
Indicatore Calendario Economico Avanzato Questo indicatore mostra direttamente sul grafico tutti gli eventi economici futuri rilevanti per la coppia o lo strumento selezionato, permettendo di anticipare i momenti di maggiore volatilità e pianificare le proprie strategie con precisione. Funzionalità principali Visualizzazione degli eventi futuri fino a 5 giorni avanti (configurabile). Filtraggio per impatto della notizia (alto, medio, basso). Possibilità di scegliere se mostrare linee verticali s
FREE
Coral Indi
Dinh Duong Luong
Coral trend is   a trend-following indicator that is widely popular among FOREX traders . It is usually used as a confluence with other indicators. It uses combinations of moving averages with complex smoothing formulas! It has two configurable parameters: Coefficient   - smoothing ratio (*) Applied price Calculation: Coral = (-0.064) * B6 + 0.672 * B5 - 2.352 * B4 + 2.744 * B3
FREE
MIDAS Super VWAP
Flavio Javier Jarabeck
4.4 (10)
Imagine VWAP, MVWAP and MIDAS in one place... Well, you found it! Now you can track the movement of Big Players in various ways, as they in general pursue the benchmarks related to this measuring, gauging if they had good execution or poor execution on their orders. Traders and analysts use the VWAP to eliminate the noise that occurs throughout the day, so they can measure what prices buyers and sellers are really trading. VWAP gives traders insight into how a stock trades for that day and deter
FREE
Cybertrade Keltner Channels
Emanuel Andriato
4.75 (4)
Cybertrade Keltner Channels - MT5 Created by Chester Keltner, this is a volatility indicator used by technical analysis. It is possible to follow the trend of financial asset prices and generate support and resistance patterns. In addition, envelopes are a way of tracking volatility in order to identify opportunities to buy and sell these assets. It works on periods longer than the period visible on the chart. All values ​​are available in the form of buffers to simplify possible automations.
FREE
The indicator highlights the points that a professional trader sees in ordinary indicators. VisualVol visually displays different volatility indicators on a single scale and a common align. Highlights the excess of volume indicators in color. At the same time, Tick and Real Volume, Actual range, ATR, candle size and return (open-close difference) can be displayed. Thanks to VisualVol, you will see the market periods and the right time for different trading operations. This version is intended f
FREE
Gli utenti di questo prodotto hanno anche acquistato
ARIPoint
Temirlan Kdyrkhan
1 (1)
ARIPoint is a powerful trading companion designed to generate high-probability entry signals with dynamic TP/SL/DP levels based on volatility. Built-in performance tracking shows win/loss stats, PP1/PP2 hits, and success rates all updated live. Key Features: Buy/Sell signals with adaptive volatility bands Real-time TP/SL/DP levels based on ATR Built-in MA Filter with optional ATR/StdDev volatility Performance stats panel (Success, Profit/Loss, PP1/PP2) Alerts via popup, sound, push, or email Cu
Se acquisti questo indicatore, riceverai il mio Trade Manager Professionale + EA  GRATUITAMENTE. Innanzitutto è importante sottolineare che questo sistema di trading è un indicatore Non-Repainting, Non-Redrawing e Non-Lagging, il che lo rende ideale sia per il trading manuale che per quello automatico. Corso online, manuale e download di preset. Il "Sistema di Trading Smart Trend MT5" è una soluzione completa pensata sia per i trader principianti che per quelli esperti. Combina oltre 10 indicat
Divergence Bomber
Ihor Otkydach
4.9 (81)
Ogni acquirente dell’indicatore riceverà inoltre gratuitamente: L’utilità esclusiva “Bomber Utility”, che gestisce automaticamente ogni operazione, imposta i livelli di Stop Loss e Take Profit e chiude le posizioni secondo le regole della strategia I file di configurazione (set file) per adattare l’indicatore a diversi asset I set file per configurare il Bomber Utility in tre modalità: “Rischio Minimo”, “Rischio Bilanciato” e “Strategia di Attesa” Una guida video passo-passo per installare, conf
Power Candles MT5
Daniel Stein
5 (5)
Power Candles – Segnali di ingresso basati sulla forza per tutti i mercati Power Candles porta l’analisi di forza collaudata di Stein Investments direttamente sul grafico dei prezzi. Invece di reagire solo al prezzo, ogni candela viene colorata in base alla reale forza di mercato, consentendo di identificare immediatamente accumuli di momentum, accelerazioni della forza e transizioni di trend pulite. Un’unica logica per tutti i mercati Power Candles funziona automaticamente su tutti i simboli di
Entry In The Zone and SMC Multi Timeframe è uno strumento di analisi di mercato in tempo reale sviluppato sulla base degli Smart Money Concepts (SMC). È progettato per aiutare i trader ad analizzare la struttura del mercato in modo sistematico e ottenere una visione più chiara della direzione generale del mercato. Il sistema analizza automaticamente i Punti di Inversione, le Zone Chiave e la Market Structure su più timeframe, mostrando Point of Interest (POI), segnali No Repaint e Auto Fibonacci
SuperScalp Pro
Van Minh Nguyen
5 (1)
SuperScalp Pro – Sistema avanzato di indicatore per scalping con filtri multipli SuperScalp Pro è un sistema avanzato di indicatore per scalping che combina il classico Supertrend con molteplici filtri di conferma intelligenti. L’indicatore funziona in modo efficiente su tutti i timeframe da M1 a H4 ed è particolarmente adatto per XAUUSD, BTCUSD e le principali coppie Forex. Può essere utilizzato come sistema stand-alone o integrato in modo flessibile nelle strategie di trading esistenti. L’indi
Azimuth Pro
Ottaviano De Cicco
5 (1)
LAUNCH PROMO Azimuth Pro price is initially set at 299$ for the first 100 buyers. Final price will be 499$ . THE DIFFERENCE BETWEEN RETAIL AND INSTITUTIONAL ENTRIES ISN'T THE INDICATOR — IT'S THE LOCATION. Most traders enter at arbitrary price levels, chasing momentum or reacting to lagging signals. Institutions wait for price to reach structured levels where supply and demand actually shift. Azimuth Pro maps these levels automatically: swing-anchored VWAP, multi-timeframe structure lines, an
Ottieni l’indicatore AUX GRATUITO e il supporto EA Download diretto — Clicca qui [ D.I.C.E ] The DICE Indicator  Divergence in Chaos Environment è uno strumento MT5 specializzato per trader che applicano la Teoria delle Onde di Elliott nel contesto delle tecniche di Trading Chaos. Identifica divergenze nascoste e regolari nell’azione dei prezzi, sincronizzate con l’ambiente di mercato caotico descritto da Bill Williams. Caratteristiche principali Divergenza allineata alle Onde di Elliott: rilev
Game Changer è un indicatore di tendenza rivoluzionario, progettato per essere utilizzato su qualsiasi strumento finanziario, per trasformare il tuo Metatrader in un potente analizzatore di trend. L'indicatore non ridisegna e non subisce ritardi. Funziona su qualsiasi intervallo temporale e aiuta a identificare i trend, segnala potenziali inversioni, funge da meccanismo di trailing stop e fornisce avvisi in tempo reale per risposte tempestive del mercato. Che tu sia un trader esperto, un profess
Trend Screener Pro MT5
STE S.S.COMPANY
4.84 (100)
Indicatore di tendenza, soluzione unica rivoluzionaria per il trading di tendenze e il filtraggio con tutte le importanti funzionalità di tendenza integrate in un unico strumento! È un indicatore multi-timeframe e multi-valuta al 100% non ridipingibile che può essere utilizzato su tutti i simboli/strumenti: forex, materie prime, criptovalute, indici e azioni. Trend Screener è un indicatore di tendenza che segue un indicatore efficiente che fornisce segnali di tendenza a freccia con punti nel gra
Smart Stop Indicator – Precisione intelligente dello stop-loss direttamente sul grafico Panoramica Smart Stop Indicator è la soluzione ideale per i trader che desiderano posizionare il loro stop-loss in modo chiaro e metodico, senza dover indovinare o affidarsi all’intuizione. Questo strumento combina la logica classica del price action (massimi e minimi strutturali) con un moderno riconoscimento dei breakout per identificare il prossimo livello di stop realmente logico. In trend, in range o i
Atomic Analyst MT5
Issam Kassas
4.07 (28)
Innanzitutto, vale la pena sottolineare che questo indicatore di trading non è repaint, non è ridisegno e non presenta ritardi, il che lo rende ideale sia per il trading manuale che per quello automatico. Manuale utente: impostazioni, input e strategia. L'Analista Atomico è un indicatore di azione del prezzo PA che utilizza la forza e il momentum del prezzo per trovare un miglior vantaggio sul mercato. Dotato di filtri avanzati che aiutano a rimuovere rumori e segnali falsi, e aumentare il pote
FX Power MT5 NG
Daniel Stein
5 (30)
FX Power: Analizza la Forza delle Valute per Decisioni di Trading Più Intelligenti Panoramica FX Power è lo strumento essenziale per comprendere la reale forza delle principali valute e dell'oro in qualsiasi condizione di mercato. Identificando le valute forti da comprare e quelle deboli da vendere, FX Power semplifica le decisioni di trading e rivela opportunità ad alta probabilità. Che tu segua le tendenze o anticipi inversioni utilizzando valori estremi di Delta, questo strumento si adatta
Top indicator for MT5   providing accurate signals to enter a trade without repainting! It can be applied to any financial assets:   forex, cryptocurrencies, metals, stocks, indices .  Watch  the video  (6:22) with an example of processing only one signal that paid off the indicator! MT4 version is here It will provide pretty accurate trading signals and tell you when it's best to open a trade and close it. Most traders improve their trading results during the first trading week with the help of
Super Signal – Skyblade Edition Sistema professionale di segnali di tendenza senza repaint / senza ritardo con tasso di vincita eccezionale | Per MT4 / MT5 Funziona meglio su timeframe più bassi, come 1 minuto, 5 minuti e 15 minuti. Caratteristiche principali: Super Signal – Skyblade Edition è un sistema intelligente di segnali progettato specificamente per il trading di tendenza. Utilizza una logica di filtraggio multilivello per identificare esclusivamente i movimenti direzionali forti, supp
L’indicatore evidenzia le zone in cui viene dichiarato interesse sul mercato , per poi mostrare la zona di accumulo degli ordini . Funziona come un book degli ordini su larga scala . Questo è l’indicatore per i grandi capitali . Le sue prestazioni sono eccezionali. Qualsiasi interesse ci sia nel mercato, lo vedrai chiaramente . (Questa è una versione completamente riscritta e automatizzata – non è più necessaria un’analisi manuale.) La velocità di transazione è un indicatore concettualmente nuo
FX Levels MT5
Daniel Stein
5 (12)
FX Levels: Supporti e Resistenze di Precisione Eccezionale per Tutti i Mercati Panoramica Rapida Cercate un modo affidabile per individuare livelli di supporto e resistenza in ogni mercato—coppie di valute, indici, azioni o materie prime? FX Levels fonde il metodo tradizionale “Lighthouse” con un approccio dinamico all’avanguardia, offrendo una precisione quasi universale. Basato sulla nostra esperienza reale con i broker e su aggiornamenti automatici giornalieri più quelli in tempo reale, FX
Innanzitutto, vale la pena sottolineare che questo Strumento di Trading è un Indicatore Non-Ridipingente, Non-Ridisegnante e Non-Laggante, il che lo rende ideale per il trading professionale. Corso online, manuale utente e demo. L'Indicatore Smart Price Action Concepts è uno strumento molto potente sia per i nuovi che per i trader esperti. Racchiude più di 20 utili indicatori in uno solo, combinando idee di trading avanzate come l'Analisi del Trader del Circolo Interno e le Strategie di Tradin
Grabber System MT5
Ihor Otkydach
4.82 (22)
Ti presento un eccellente indicatore tecnico: Grabber, che funziona come una strategia di trading "tutto incluso", pronta all’uso. In un solo codice sono integrati strumenti potenti per l’analisi tecnica del mercato, segnali di trading (frecce), funzioni di allerta e notifiche push. Ogni acquirente di questo indicatore riceve anche gratuitamente: L’utility Grabber: per la gestione automatica degli ordini aperti Video tutorial passo dopo passo: per imparare a installare, configurare e utilizzare
Shock Pullback
Suleiman Alhawamdah
5 (1)
Semplicemente, puoi iniziare a fare trading quando il movimento dei numeri bianchi — noti come "pips" — inizia ad apparire accanto alla candela corrente. I "pips" bianchi indicano che un'operazione di acquisto o vendita è attualmente attiva e si sta muovendo nella direzione corretta, come indicato dal colore bianco. Quando il movimento dei pips bianchi si interrompe e diventa di colore verde statico, questo segnala la fine della spinta attuale. Il colore verde dei numeri rappresenta il profitto
Market Structure Patterns
Samuel Manoel De Souza
4.47 (19)
Disponibile per   MT4   e   MT5 . Unisciti al canale Market Structure Patterns per scaricare materiale di studio e/o informazioni aggiuntive. Pubblicazioni correlate: Market Structure Patterns - Introduzione Acquistalo ora con 50% di sconto | Prezzo precedente $90 | Offerta valida fino al 31 dicembre | Un importante aggiornamento è in arrivo e il prezzo originale verrà adeguato. Market Structure Patterns   è un indicatore basato sui   Smart Money Concepts   che mostra gli   elementi SMC/ICT  
Trend indicator AI mt5
Ramil Minniakhmetov
5 (13)
Trend Ai indicator è un ottimo strumento che migliorerà l'analisi di mercato di un trader combinando l'identificazione della tendenza con punti di ingresso utilizzabili e avvisi di inversione. Questo indicatore consente agli utenti di navigare nelle complessità del mercato forex con fiducia e precisione Oltre ai segnali primari, l'indicatore Ai di tendenza identifica i punti di ingresso secondari che si presentano durante i pullback o i ritracciamenti, consentendo ai trader di capitalizzare le
Quantum TrendPulse
Bogdan Ion Puscasu
5 (20)
Ecco   Quantum TrendPulse   , lo strumento di trading definitivo che combina la potenza di   SuperTrend   ,   RSI   e   Stocastico   in un unico indicatore completo per massimizzare il tuo potenziale di trading. Progettato per i trader che cercano precisione ed efficienza, questo indicatore ti aiuta a identificare con sicurezza le tendenze di mercato, i cambiamenti di momentum e i punti di entrata e uscita ottimali. Caratteristiche principali: Integrazione SuperTrend:   segui facilmente l'andame
IX Power MT5
Daniel Stein
4.92 (12)
IX Power: Scopri approfondimenti di mercato per indici, materie prime, criptovalute e forex Panoramica IX Power è uno strumento versatile progettato per analizzare la forza di indici, materie prime, criptovalute e simboli forex. Mentre FX Power offre la massima precisione per le coppie di valute utilizzando i dati di tutte le coppie disponibili, IX Power si concentra esclusivamente sui dati di mercato del simbolo sottostante. Questo rende IX Power una scelta eccellente per mercati non correlat
ARICoins
Temirlan Kdyrkhan
ARICoin is a powerful trading companion designed to generate high-probability entry signals with dynamic TP/SL/DP levels based on volatility. Built-in performance tracking shows win/loss stats, PP1/PP2 hits, and success rates all updated live. Key Features: Buy/Sell signals with adaptive volatility bands Real-time TP/SL/DP levels based on ATR Built-in MA Filter with optional ATR/StdDev volatility Performance stats panel (Success, Profit/Loss, PP1/PP2) Alerts via popup, sound, push, or email Cust
Gold Sniper Scalper Pro
Ich Khiem Nguyen
3.5 (8)
Gold Sniper Scalper Pro è un indicatore professionale per MetaTrader 5, progettato per supportare i trader nell'identificare punti di ingresso e gestire il rischio in modo efficace. L'indicatore fornisce un set completo di strumenti analitici che include un sistema di rilevamento dei segnali, gestione automatica di Entry/SL/TP, analisi del volume e statistiche delle performance in tempo reale. Guida utente per comprendere il sistema   |   Guida utente per altre lingue CARATTERISTICHE PRINCIPALI
FX Dynamic MT5
Daniel Stein
5 (5)
FX Dynamic: Monitora volatilità e trend con un’analisi ATR personalizzabile Panoramica FX Dynamic è uno strumento potente che sfrutta i calcoli di Average True Range (ATR) per fornire ai trader informazioni impareggiabili sulla volatilità, sia giornaliera che intraday. Impostando soglie di volatilità chiare—ad esempio 80%, 100%, 130%—puoi individuare rapidamente opportunità di profitto o ricevere avvisi quando il mercato supera i range abituali. FX Dynamic si adatta al fuso orario del tuo brok
PZ Swing Trading MT5
PZ TRADING SLU
5 (5)
Protect against whipsaws: revolutionize your swing trading approach Swing Trading is the first indicator designed to detect swings in the direction of the trend and possible reversal swings. It uses the baseline swing trading approach, widely described in trading literature. The indicator studies several price and time vectors to track the aggregate trend direction and detects situations in which the market is oversold or overbought and ready to correct. [ Installation Guide | Update Guide | Tro
Introduction to X3 Chart Pattern Scanner X3 Cherart Pattern Scanner is the non-repainting and non-lagging indicator detecting X3 chart patterns including Harmonic pattern, Elliott Wave pattern, X3 patterns, and Japanese Candlestick patterns. Historical patterns match with signal patterns. Hence, you can readily develop the solid trading strategy in your chart. More importantly, this superb pattern scanner can detect the optimal pattern of its kind. In addition, you can switch on and off individu
ARIScalping
Temirlan Kdyrkhan
ARIScalp is a powerful trading companion designed to generate high-probability entry signals with dynamic TP/SL/DP levels based on volatility. Built-in performance tracking shows win/loss stats, PP1/PP2 hits, and success rates all updated live. Key Features: Buy/Sell signals with adaptive volatility bands Real-time TP/SL/DP levels based on ATR Built-in MA Filter with optional ATR/StdDev volatility Performance stats panel (Success, Profit/Loss, PP1/PP2) Alerts via popup, sound, push, or email Cus
Altri dall’autore
NakaTrend
Ricardo De Andrade Nakano
2 (1)
"Presentiamo NakaTrend: il vostro rivelatore di tendenze definitivo per MetaTrader 5! Pronti a rivoluzionare la vostra esperienza di trading? Conosciuto NakaTrend, il vostro affidabile indicatore per identificare con precisione e facilità i cambiamenti di tendenza. Con NakaTrend, non perderete mai più un'opportunità di sfruttare le fluttuazioni del mercato. Quando si sviluppa un trend rialzista, NakaTrend lo segnala con un simbolo del dollaro verde e vi incoraggia a effettuare un ordine di ac
FREE
NakaSide
Ricardo De Andrade Nakano
Vi presentiamo NakaSide - Il vostro indicatore definitivo di opportunità di mercato! Stanco di perdere opportunità di trading redditizie? Pronto a portare il tuo trading al livello successivo? Non cercare oltre, perché NakaSide è qui per rivoluzionare il tuo modo di fare trading! NakaSide non è solo un altro indicatore ordinario; è la tua arma segreta per navigare con fiducia e precisione nel complesso mondo dei mercati finanziari. Con i suoi algoritmi avanzati e la tecnologia all'avanguardia
NakaTrendBot
Ricardo De Andrade Nakano
Vi presentiamo NakaTrendBot - Il vostro partner definitivo per il trading di tendenza! Siete stanchi di perdere opportunità quando il mercato cambia? Non cercate oltre, perché NakaTrendBot è qui per aiutarvi a navigare nel mondo dinamico del trading di tendenza. NakaTrendBot è molto più di un semplice robot; è una sofisticata macchina algoritmica progettata per rilevare con precisione i cambiamenti di tendenza e le consolidazioni. Utilizzando algoritmi avanzati di apprendimento automatico e a
NakaSideBot
Ricardo De Andrade Nakano
Presentiamo il NakaSideBot - Il tuo Campione Definitivo sul Mercato Laterale! Sei stanco di perdere opportunità quando il mercato cambia direzione? Conosci il NakaSideBot, il tuo campione definitivo sul mercato laterale! Questo robot all'avanguardia è progettato per prosperare in condizioni di mercato in continua evoluzione, rendendolo perfetto sia per i mercati in tendenza che per quelli laterali. Il NakaSideBot si distingue quando il mercato attraversa transizioni o si consolida, cogliendo
Filtro:
pauloideriha
14
pauloideriha 2026.01.16 14:43 
 

L'utente non ha lasciato alcun commento sulla valutazione.

Jonilton Silva De Barros Santos
136
Jonilton Silva De Barros Santos 2025.11.05 02:29 
 

Não funciounou na conta DEMO! em nenhum tempo grafico!

Ricardo De Andrade Nakano
2205
Risposta dello sviluppatore Ricardo De Andrade Nakano 2025.11.10 15:30
Funciona somente se seu broker fornece os dados de book. Se importa em me dizer qual seu broker para eu poder arrumar o indicador, por favor?
Rispondi alla recensione