Fibonacci Confluence Toolkit

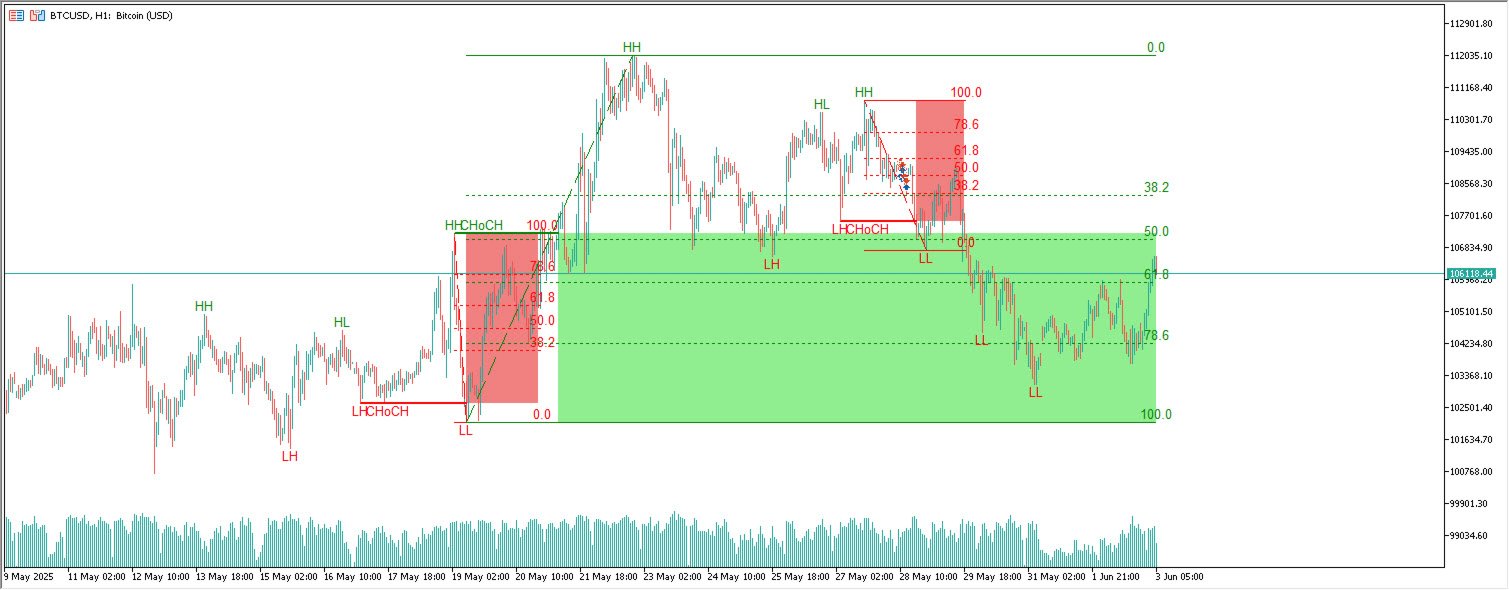
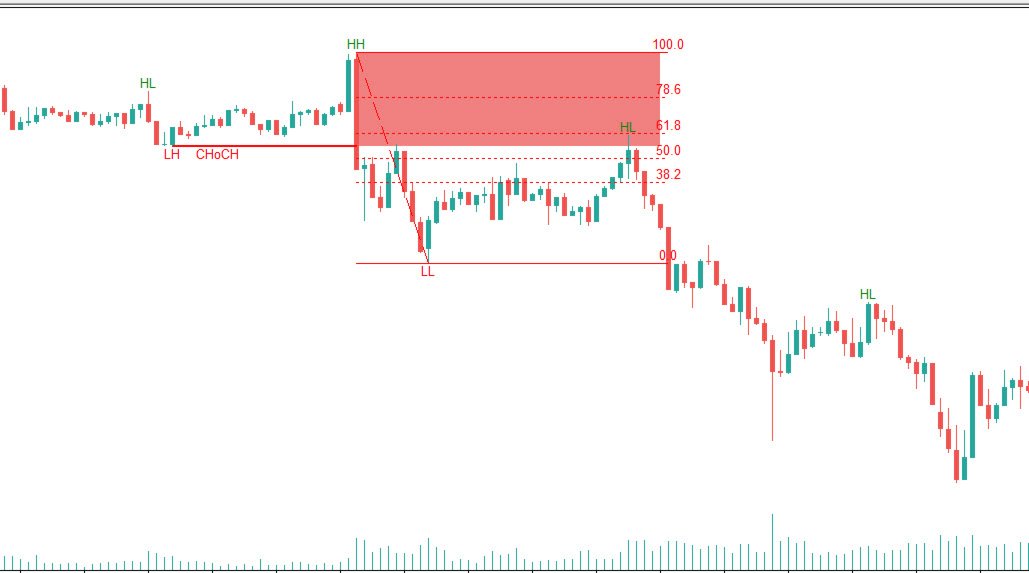
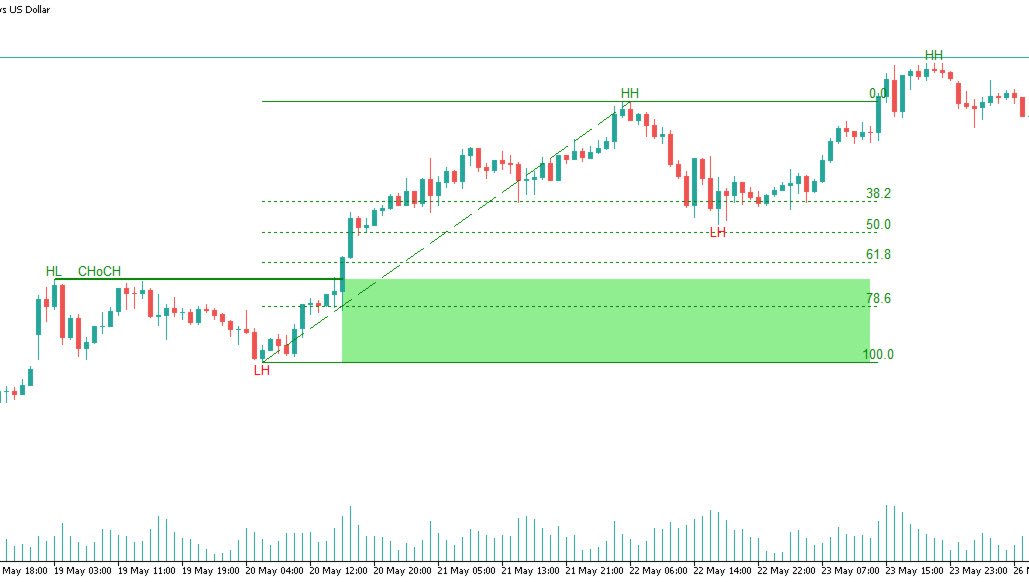
The Fibonacci Confluence Toolkit is a powerful indicator designed to highlights areas of interest where significant price action or reactions are anticipated, automatically applies Fibonacci retracement levels to outline potential pullback zones, and detects engulfing candle patterns.. This tool automates the detection and visualization of key market structures and potential reversal zones.

Key Features:

  • CHoCH Detection (Change of Character):
    Automatically identifies structural shifts in market direction, highlighting early signs of trend reversals.

  • Area of Interest (AOI) Definition:
    Dynamically marks zones of importance where price action is likely to react, based on recent market structure and liquidity behavior.

  • Fibonacci Retracement Overlay:
    Applies Fibonacci retracement levels directly on the defined AOIs, helping traders identify high-probability pullback and entry zones.

  • Visual Confluence Mapping:
    Merges structural shifts and Fibonacci levels to clearly outline potential trade opportunities with improved accuracy.

The Fibonacci Confluence Toolkit is ideal for traders who seek to combine the precision of Fibonacci with market structure analysis for smarter and more confident trading decisions.

SETTINGS:

 Market Patterns
  • Bullish Structures: Enable or disable all bullish components of the indicator.
  • Bearish Structures: Enable or disable all bearish components of the indicator.
  • Highlight Area of Interest: Toggle the option to highlight the Areas of Interest (enabled or disabled).
  • CHoCH Line: Choose the line style for the CHoCH (Solid, Dashed, or Dotted).
  • Width: Adjust the width of the CHoCH line.
  • Alert: Alert when CHoCH created
Retracement Levels
  • Choose which Fibonacci retracement levels to display (e.g., 0, 0.236, 0.382, etc.).
Swing Levels & Engulfing Patterns
  • Swing Levels: Select swing levels are show/hide.
  • Engulfing Candle Patterns: Choose which engulfing candle patterns to detect (All, Structure-Based, or Disabled).


Önerilen ürünler
Mine Farm is one of the most classic and time-tested scalping strategies based on the breakdown of strong price levels. Mine Farm is the author's modification of the system for determining entry and exit points into the market... Mine Farm - is the combination of great potential with reliability and safety. Why Mine Farm?! - each order has a short dynamic Stop Loss - the advisor does not use any risky methods (averaging, martingale, grid, locking, etc.) - the advisor tries to get the most
Fibonacci Auto
Makarii Gubaydullin
Belirtilen zaman dilimindeki Yüksek ve Düşük fiyatlara dayanarak otomatik olarak Fibo seviyelerini çizer Çoklu çubuklar   birleştirilebilir: örneğin, 10 günlük Yüksek ve Düşük fiyatlara dayalı bir Fibo elde edebilirsiniz Benim   #1   Aracım : 66+ özellik, bu gösterge dahil  |   Sorularınız için  iletişime geçin  |    MT4 sürümü Potansiyel dönüş seviyelerini görmeye yardımcı olur; Fibo seviyelerinde oluşan formasyonlar genellikle daha güçlüdür; Manuel   çizim   için   harcanan   zamanı   önemli  
Overview Harmonic Patterns MT5 is a technical analysis indicator designed for the MetaTrader 5 platform. It identifies and displays harmonic price patterns, such as Butterfly, Cypher, Crab, Bat, Shark, and Gartley, in both bullish and bearish directions. The indicator calculates key price levels, including entry, stop loss, and three take-profit levels, to assist traders in analyzing market movements. Visual elements and customizable alerts enhance usability on the chart. Features Detects six ha
Two-way Fibonacci indicator. The function is to facilitate traders to find their retracement and entry and exit points. The principle of the workpiece of this indicator: First, draw a V shape for the high and low points formed by the fractal indicator, and then draw a golden section proportional line for the V line, which can be applied to any period and currency pair.
The indicator automatically plots and tracks buy and sell Fibo levels at any symbol and timeframe. FiboPlus displays: Fibo levels of the probable upward or downward price movements. entry points are shown using "up arrow", "down arrow" icons. The data is doubled on SELL and BUY buttons. rectangle area limited by levels 0-100. Trading is performed from one level to another (no trend). Features price movement forecast, market entry points, stop loss and take profit for orders. ready-made trading
Weekly Levels Pro
N'da Lemissa Kouame
Türkçe (Turc) – Weekly Levels Pro Weekly Levels Pro – Haftalık Ana Seviyeler MetaTrader 5 için basit ama güçlü bir göstergedir ve her haftanın en önemli dört işlem seviyesini otomatik olarak gösterir: Haftalık Zirve (Weekly High) → doğal direnç seviyesi Haftalık Dip (Weekly Low) → doğal destek seviyesi Haftalık Açılış (Weekly Open) → trend referans noktası Haftalık Kapanış (Weekly Close) → boğa veya ayı gücünün göstergesi Ana Özellikler: Yeni haftanın başında otomatik güncelleme Grafik
Camarilla Pivot
Philip Thakadiyil George
Camarilla Pivot Pro EA is a fully automated trading robot built around the powerful Camarilla Pivot Point formula. The EA calculates intraday pivot levels (H1–H6 & L1–L6) and trades based on price reactions at major Camarilla reversal and breakout zones. It is designed for traders who want a clean, mechanical, and proven pivot-based strategy without repainting signals or complicated indicators.
**   All Symbols   x   All Timeframes   scan just by pressing scanner button ** Discount: The price is $50$, But now it is just $39, Limited time offer is active. *** Contact me  to send you instruction and add you in "Trend Reversal group" for sharing or seeing experiences with other users. Introduction: Trendlines are the most famous technical analysis in trading . Trendlines continually form on the charts of markets across all the different timeframes providing huge opportunities for traders
Automatic fibonacci with alerts is an indicator that automatically plots a fibonacci retracement based on the number of bars you select on the BarsToScan setting in the indicator. The fibonacci is automatically updated in real time as new highest and lowest values appear amongst the selected bars. You can select which level values to be displayed in the indicator settings. You can also select the color of the levels thus enabling the trader to be able to attach the indicator several times with d
Unlock powerful breakout opportunities The 123 Pattern is one of the most popular, powerful and flexible chart patterns. The pattern is made up of three price points: a bottom, a peak or valley, and a Fibonacci retracement between 38.2% and 71.8%. A pattern is considered valid when the price breaks beyond the last peak or valley, moment at which the indicator plots an arrow, rises an alert, and the trade can be placed. [ Installation Guide | Update Guide | Troubleshooting | FAQ | All Products ]
Special offer : ALL TOOLS , just $35 each! New tools   will be   $30   for the   first week   or the   first 3 purchases !  Trading Tools Channel on MQL5 : Join my MQL5 channel to update the latest news from me Fibonacci Confluence Toolkit Multi-Timeframe , profesyonel traderlar için tasarlanmış gelişmiş bir teknik analiz aracıdır ve ana piyasa sinyalleri ile kalıplarını birleştirerek potansiyel fiyat dönüş bölgelerini belirlemenize yardımcı olur. Timeframe Selector panosu üzerinden çok zaman d
Pivot_Point_Weekly — clear, uncluttered weekly pivots for MT5 Pivot_Point_Weekly plots one thing and does it exceptionally well: the classic weekly pivot (P) calculated from the previous week’s high, low, and close. It renders each week’s pivot as a clean horizontal “step,” with short, perfectly vertical joins from week to week so you can see the regime shifts at a glance—without cluttering your chart with a forest of levels. This indicator is intentionally minimalist: no S1/R1 ladders, no fib v
Description : Rainbow EA MT5 is a simple Expert advisor based on   Rainbow MT5 indicator witch is based on Moving average with period 34. The indicator is incorporated in the EA, therefore, it is not required for the EA to operate, but if you wish, you can download it from   my product page . The Expert Advisor settings are as follows : Suitable for Timeframes up to H1 The parameters below can be set according to your trading rules. StopLoss ( Stop Loss in pips) TakeProfit ( Take Profit in pips
What was IFM created for Our goal in creating IFM was to provide the tool to manage your Fibonacci Retrecements and other Fibo tools in MetaTrader 5. This indicator allows you to edit all of the settings without getting into it by right click on the tool. That is faster and easiest way to manage objects on your chart. Inputs Font size - change font size of texts on the IFM panel. This is necessary, because some of users change font size in Windows settings Description of the Fibo levels (variab
Welcome to the Ultimate Harmonic Patterns recognition indicator that is focused to detect advanced patterns. The Gartley pattern, Bat pattern, and Cypher pattern  are popular technical analysis tools used by traders to identify potential reversal points in the market. Our Ultimate Harmonic Patterns recognition Indicator is a powerful tool that uses advanced algorithms to scan the markets and identify these patterns in real-time. With our Ultimate Harmonic Patterns recognition Indicator, you ca
Auto Fib Retracements
Ross Adam Langlands Nelson
4.2 (5)
Automatic Fibonacci Retracement Line Indicator. This indicator takes the current trend and if possible draws Fibonacci retracement lines from the swing until the current price. The Fibonacci levels used are: 0%, 23.6%, 38.2%, 50%, 61.8%, 76.4%, 100%. This indicator works for all charts over all timeframes. The Fibonacci levels are also recorded in buffers for use by other trading bots. Any comments, concerns or additional feature requirements are welcome and will be addressed promptly. 
FREE
MSnR Lines
Pierre Paul Amoussou
MSnR Lines , bir grafikte destek ve direnç seviyelerini göstermek için tasarlanmış özel bir göstergedir. Bu seviyeler, Malezya Destek ve Direnç teorisine dayanarak, alanlar olarak değil, belirli fiyat seviyeleri olarak tanımlanan zirve ve vadilerden türetilmiştir. Özellikler: Üç tür seviye: A-Level, V-Level ve Boşluk Seviyesi. Seviyeler için tazelik göstergesi: Taze seviyeler taze olmayan seviyelerden daha önemlidir. Taze ve taze olmayan seviyeler için özelleştirilebilir renk ve stil. Yalnızca t
This indicator is a   technical tool based on harmonic approximations   of solar and lunar cycles. It   does not use exact astronomical positions. This indicator uses   mathematical waves to approximate daily solar and monthly lunar cycles   for trading purposes. It captures general market rhythms influenced by day/night and moon phases, but it   does not track exact astronomical positions . Do your analysis and study on back test before purchase.  The   Advanced Astrological Indicator   is a m
Premium seviye, %80'den fazla doğru tahmin doğruluğuna sahip benzersiz bir göstergedir! Bu gösterge en iyi Ticaret Uzmanları tarafından iki aydan uzun süredir test edilmiştir! Yazarın göstergesini başka hiçbir yerde bulamazsınız! Ekran görüntülerinden bu aracın doğruluğunu kendiniz görebilirsiniz! 1, sona erme süresi 1 mum olan ikili opsiyon ticareti için harikadır. 2 tüm döviz çiftleri, hisse senetleri, emtialar, kripto para birimleri üzerinde çalışır Talimatlar: Kırmızı ok göründüğü an
INDICATOR: GEN Support and Resistance Pro Developer: gedeegi General Description GEN Support and Resistance Pro is a technical indicator for MetaTrader that automatically identifies support and resistance (S&R) levels using price pivot logic. It supports multi-timeframe analysis and includes a trend momentum detection system that helps traders understand current market bias with additional visual and alert tools. Main Features Automatic S&R Detection: Identifies key support and resistance levels
It is an analogue of the indicator of levels at https://www.mql5.com/en/market/product/24273 for the MetaTrader 5 platform. The indicator shows the levels of the past month, week and day. In addition, it draws a level in percentage relative to the difference between the High and Low of the past month and week. For the daily levels of the past day, the Close levels are additionally displayed. All you need to do is to configure the display parameters of the levels to your liking. In some cases, af
RM Divergence Pro
Mohammadreza Mahdi Mavaddat
RM Divergence Pro - Advanced RSI Divergence and Inability Indicator, It is a professional, non-repainting RSI divergence indicator based on real market structure. It detects Regular Divergence, Hidden Divergence, Inability, and Potential Divergence using confirmed RSI swings, price behavior, and advanced filters for clean and reliable analysis. ================================================== OVERVIEW ================================================== RM Divergence Pro is an advanced RSI-base
Harmonic Pattern Suite Pro Introduction Harmonic Pattern Suite Pro is an indicator designed to identify and display harmonic structures on the chart based on X-A-B-C-D sequences. Its purpose is to present pattern formations that meet geometric and proportional criteria, providing a clear visual representation directly on the chart. The indicator automates the detection process, removing the need for manual measurement of ratios and allowing the user to review the structural configuration withou
FREE
Trend Master Chart MT5
Frederic Jacques Collomb
Trend Master Chart ihtiyacınız olan trend göstergesidir. Grafiği kaplar ve farklı pazar trendlerini/hareketlerini tanımlamak için renk kodlamasını kullanır. İki hareketli ortalamayı ve farklı osilatörleri birleştiren bir algoritma kullanır. Bu üç elementin periyotları değiştirilebilir. Herhangi bir zaman diliminde ve herhangi bir Çiftte çalışır. Bir bakışta yükseliş veya düşüş trendini ve bu trende farklı giriş noktalarını tespit edebileceksiniz. Örneğin, belirgin bir yükseliş eğilimi sırasında
Sigma Indicator is used by Sigma Expert advisor for plotting the zones but now its available for members to apply their stratagies on Sigma supply and demand levels. Instructions:  1- Donot Change time frames instead run several pairs with different time frames with sigma indicator 2- For exness : Search for smaller zone = True For other brokers keep it False 3- Maximum zone size = 0 4- Minimum zone size = 0  5 - Back candles = 300
L'indicatore SMC Venom Model BPR è uno strumento professionale per i trader che operano nell'ambito del concetto di Smart Money (SMC). Identifica automaticamente due modelli chiave sul grafico dei prezzi: FVG   (Fair Value Gap) è una combinazione di tre candele, in cui c'è un gap tra la prima e la terza candela. Forma una zona tra livelli in cui non c'è supporto di volume, il che spesso porta a una correzione dei prezzi. BPR   (Balanced Price Range) è una combinazione di due modelli FVG che for
Heikin Ashi candlesticks are a powerful tool for traders, offering a clear and smooth visualization of market trends. Unlike traditional candlesticks, they filter out market noise, providing a cleaner view of the market's direction and strength, which helps traders make more informed decisions. The Hull Heikin Ashi Smoothed indicator from Minions Labs takes this a step further by integrating the Hull Moving Average for enhanced smoothing and precision. This indicator not only simplifies trend id
Trend Channel is a Forex trend arrow indicator for identifying potential entry points. I like it, first of all, because it has a simple operating mechanism, adaptation to all time periods and trading tactics. Created based on a regression channel with filters. We display the signals of the Trend Channel indicator on the price function chart using a mathematical approach. How it works: when the price breaks through the overbought/oversold zone (channel levels), a buy or sell signal is generated
Indicator Monthly Levels + Pin Bar Pro Description The Monthly Levels + Pin Bar Pro indicator combines the power of monthly key levels (High, Low, Open, Close) with automatic detection of Price Action reversal patterns (Pin Bars) . Designed for technical and institutional traders, it helps anticipate market reaction zones and generates clear visual signals directly on the chart. Main Features Automatic monthly levels : High, Low, Open, Close. Pin Bar detection (bullish & bearish) in r
Master head and shoulders patterns for better trading decisions A head and shoulders pattern is a chart formation that resembles a baseline with three peaks, the outside two are close in height and the middle is highest. It predicts a bullish-to-bearish trend reversal and is believed to be one of the most reliable trend reversal patterns. It is one of several top patterns that signal, with varying degrees of accuracy, that a trend is nearing its end.  [ Installation Guide | Update Guide | Troub
Bu ürünün alıcıları ayrıca şunları da satın alıyor
Bu indikatörü satın alırsanız, Profesyonel Trade Manager’ımı  + EA ÜCRETSİZ olarak alacaksınız. Öncelikle, bu Ticaret Sistemi'nin Non-Repainting, Non-Redrawing ve Non-Lagging Göstergesi olduğunu vurgulamak önemlidir, bu da hem manuel hem de robot ticareti için ideal hale getirir. Online kurs, kılavuz ve ön ayarları indir. "Smart Trend Trading System MT5", yeni ve deneyimli tüccarlar için özelleştirilmiş kapsamlı bir ticaret çözümüdür. 10'dan fazla premium göstergeyi birleştiriyor ve 7'den fazla
Divergence Bomber
Ihor Otkydach
4.96 (78)
Bu göstergeyi satın alan herkese aşağıdaki ekstra içerikler ücretsiz olarak sunulmaktadır: Her işlemi otomatik olarak yöneten, Stop Loss ve Take Profit seviyelerini ayarlayan ve işlemleri strateji kurallarına göre kapatan özel yardımcı araç: "Bomber Utility" Göstergenin farklı varlıklar üzerinde kullanılmasına yönelik ayar dosyaları (set dosyaları) Bomber Utility için 3 farklı modda kullanım sunan ayar dosyaları: "Minimum Risk", "Dengeli Risk" ve "Bekle-Gör Stratejisi" Bu ticaret stratejisini hı
Power Candles – Tüm Piyasalar İçin Güce Dayalı Giriş Sinyalleri Power Candles , Stein Investments’ın kanıtlanmış güç analizini doğrudan fiyat grafiğinize taşır. Sadece fiyata tepki vermek yerine, her mum gerçek piyasa gücüne göre renklendirilir. Bu sayede momentum birikimleri, güç hızlanmaları ve net trend geçişleri anında görülebilir. Tüm Piyasalar İçin Tek Mantık Power Candles tüm işlem sembollerinde otomatik olarak çalışır. Gösterge, mevcut sembolün Forex mi yoksa Forex dışı bir piyasa mı old
Azimuth Pro
Ottaviano De Cicco
5 (1)
LAUNCH PROMO Azimuth Pro price is initially set at 299$ for the first 100 buyers. Final price will be 499$ . THE DIFFERENCE BETWEEN RETAIL AND INSTITUTIONAL ENTRIES ISN'T THE INDICATOR — IT'S THE LOCATION. Most traders enter at arbitrary price levels, chasing momentum or reacting to lagging signals. Institutions wait for price to reach structured levels where supply and demand actually shift. Azimuth Pro maps these levels automatically: swing-anchored VWAP, multi-timeframe structure lines, an
ARICoins
Temirlan Kdyrkhan
ARICoin is a powerful trading companion designed to generate high-probability entry signals with dynamic TP/SL/DP levels based on volatility. Built-in performance tracking shows win/loss stats, PP1/PP2 hits, and success rates all updated live. Key Features: Buy/Sell signals with adaptive volatility bands Real-time TP/SL/DP levels based on ATR Built-in MA Filter with optional ATR/StdDev volatility Performance stats panel (Success, Profit/Loss, PP1/PP2) Alerts via popup, sound, push, or email Cust
AriX
Temirlan Kdyrkhan
1 (4)
AriX Indicator for MT5 A powerful trend-following and signal-evaluation tool AriX is a custom MT5 indicator that combines Moving Averages and ATR-based risk/reward logic to generate clear buy/sell signals. It visualizes dynamic SL/TP levels, evaluates past trade outcomes, and displays win/loss statistics in a clean on-chart panel. Key features include: Buy/Sell signals based on MA crossovers ATR-based SL/TP1/TP2/TP3 levels with visual lines and labels Signal outcome tracking with real-time stat
*** Entry In The Zone ve SMC Multi Timeframe, Smart Money Concepts (SMC) çerçevesine dayalı olarak geliştirilmiş gerçek zamanlı bir piyasa analiz aracıdır. Entry In The Zone ve SMC Multi Timeframe, yatırımcıların piyasa yapısını daha sistematik ve net bir şekilde analiz etmelerine yardımcı olmak, işlem verimliliğini artırmak ve stratejiniz için uzun vadeli sürdürülebilirlik yaratmak amacıyla geliştirilmiştir. Bu araç, Smart Money Concepts (SMC) çerçevesine dayanmaktadır. Birden fazla zaman dilim
ARIScalping
Temirlan Kdyrkhan
ARIScalp is a powerful trading companion designed to generate high-probability entry signals with dynamic TP/SL/DP levels based on volatility. Built-in performance tracking shows win/loss stats, PP1/PP2 hits, and success rates all updated live. Key Features: Buy/Sell signals with adaptive volatility bands Real-time TP/SL/DP levels based on ATR Built-in MA Filter with optional ATR/StdDev volatility Performance stats panel (Success, Profit/Loss, PP1/PP2) Alerts via popup, sound, push, or email Cus
Atomic Analyst MT5
Issam Kassas
4.19 (27)
Öncelikle belirtmek gerekir ki bu Ticaret Göstergesi Yeniden Çizim Yapmaz, Gecikmez ve Gecikme Göstermez, bu da hem manuel hem de robot ticareti için ideal hale getirir. Kullanıcı kılavuzu: ayarlar, girişler ve strateji. Atom Analisti, Piyasada Daha İyi Bir Avantaj Bulmak İçin Fiyatın Gücünü ve Momentumunu Kullanan PA Fiyat Hareketi Göstergesidir. Gürültüleri ve Yanlış Sinyalleri Kaldırmaya ve Ticaret Potansiyelini Artırmaya Yardımcı Olan Gelişmiş Filtrelerle Donatılmıştır. Birden fazla katmanl
FX Power MT5 NG
Daniel Stein
5 (28)
FX Power: Daha Akıllı Ticaret Kararları için Para Birimlerinin Gücünü Analiz Edin Genel Bakış FX Power , her piyasa koşulunda başlıca para birimlerinin ve altının gerçek gücünü anlamak için vazgeçilmez bir araçtır. Güçlü para birimlerini alıp zayıf olanları satarak, FX Power ticaret kararlarınızı basitleştirir ve yüksek olasılıklı fırsatları ortaya çıkarır. İster trendlere sadık kalın ister Delta'nın aşırı değerlerini kullanarak tersine dönüşleri öngörün, bu araç ticaret tarzınıza mükemmel bir
Smart Stop Indicator – Stop-loss düzeylerini doğrudan grafikte akıllı ve hassas şekilde belirleyin Genel Bakış Smart Stop Indicator, stop-loss seviyesini tahmin ederek veya sezgilere güvenerek değil, net ve sistematik bir şekilde belirlemek isteyen traderlar için özel olarak geliştirilmiştir. Bu araç, klasik price-action mantığını (yükselen tepeler, düşen dipler) modern breakout algılama ile birleştirerek bir sonraki mantıklı stop seviyesini belirler. Trendlerde, yatay piyasalarda veya hızlı k
Game Changer, metatrader'ınızı güçlü bir trend analiz aracına dönüştürmek için herhangi bir finansal enstrümanda kullanılmak üzere tasarlanmış devrim niteliğinde bir trend göstergesidir. Gösterge, yeniden çizim yapmaz ve gecikmez. Herhangi bir zaman diliminde çalışır ve trend tanımlamasına yardımcı olur, olası geri dönüşleri işaret eder, takip eden bir durdurma mekanizması görevi görür ve anında piyasa tepkileri için gerçek zamanlı uyarılar sağlar. İster deneyimli, ister profesyonel, ister avant
Gold Sniper Scalper Pro
Ich Khiem Nguyen
3.29 (7)
Gold Sniper Scalper Pro, trader'ların giriş noktalarını belirlemesine ve riski etkili bir şekilde yönetmesine destek olmak için tasarlanmış MetaTrader 5 için profesyonel bir göstergedir. Gösterge, sinyal tespit sistemi, otomatik Entry/SL/TP yönetimi, hacim analizi ve gerçek zamanlı performans istatistikleri içeren kapsamlı bir analiz araçları seti sunar. Sistemi anlamak için kullanım kılavuzu   |   Diğer diller için kullanım kılavuzu ANA ÖZELLİKLER Sinyal tespit sistemi Gösterge, price action a
Trend Screener Pro MT5
STE S.S.COMPANY
4.84 (99)
Trend Göstergesi, Trend Alım Satım ve Filtreleme için Çığır Açan Benzersiz Çözüm, Tüm Önemli Trend Özellikleriyle Tek Bir Araç İçinde Yerleştirildi! Forex, emtialar, kripto para birimleri, endeksler ve hisse senetleri gibi tüm sembollerde/araçlarda kullanılabilen %100 yeniden boyamayan çoklu zaman çerçevesi ve Çoklu para birimi göstergesidir. Trend Screener, grafikte noktalarla ok trend sinyalleri sağlayan etkili bir trend trend göstergesidir. Trend analizörü göstergesinde bulunan özellikler: 1.
FX Levels MT5
Daniel Stein
5 (12)
FX Levels: Tüm Piyasalar İçin Son Derece Hassas Destek ve Direnç Hızlı Bakış Döviz kurları, endeksler, hisseler veya emtialar gibi herhangi bir piyasada güvenilir destek ve direnç seviyeleri belirlemek mi istiyorsunuz? FX Levels geleneksel “Lighthouse” yöntemini ileri düzey bir dinamik yaklaşımla birleştirerek neredeyse evrensel bir doğruluk sağlar. Gerçek broker deneyimimize ve otomatik günlük güncellemeler ile gerçek zamanlı güncellemelerin birleşimine dayalı olarak, FX Levels size dönüş nok
Weis Wave with Alert MT5
Trade The Volume Waves Single Member P.C.
4.94 (17)
Rental/Lifetime Package Options and Privileges  Rent Monthly Six Months   Yearly/Lifetime Weis Wave with Speed with Alert+Speed Index x x x Manual  x x x Quick Set up Video x x x Blog x x x Lifetime Updates x x x Setup and Training Material x x Discord Access Channel "The SI traders"          x Rectangle Break Alert Tool      x How to trade with it:    http://www.tradethevolumewaves.com   ** If you purchase please contact me to setup your  : Training Room and  complete manual access.  Wei
Protect against whipsaws: revolutionize your swing trading approach Swing Trading is the first indicator designed to detect swings in the direction of the trend and possible reversal swings. It uses the baseline swing trading approach, widely described in trading literature. The indicator studies several price and time vectors to track the aggregate trend direction and detects situations in which the market is oversold or overbought and ready to correct. [ Installation Guide | Update Guide | Tro
Öncelikle, bu Ticaret Aracının Non-Repainting, Non-Redrawing ve Non-Lagging Gösterge olduğunu vurgulamakta fayda var, bu da onu profesyonel ticaret için ideal hale getiriyor. Çevrimiçi kurs, kullanıcı kılavuzu ve demo. Akıllı Fiyat Hareketi Kavramları Göstergesi, hem yeni hem de deneyimli tüccarlar için çok güçlü bir araçtır. İleri ticaret fikirlerini, Inner Circle Trader Analizi ve Smart Money Concepts Ticaret Stratejileri gibi 20'den fazla kullanışlı göstergeyi bir araya getirerek bir araya
Trade smarter, not harder: Empower your trading with Harmonacci Patterns This is arguably the most complete harmonic price formation auto-recognition indicator you can find for the MetaTrader Platform. It detects 19 different patterns, takes fibonacci projections as seriously as you do, displays the Potential Reversal Zone (PRZ) and finds suitable stop-loss and take-profit levels. [ Installation Guide | Update Guide | Troubleshooting | FAQ | All Products ] It detects 19 different harmonic pri
Trend indicator AI mt5
Ramil Minniakhmetov
5 (13)
Trend Ai göstergesi, trend tanımlamasını işlem yapılabilir giriş noktaları ve geri dönüş uyarılarıyla birleştirerek bir yatırımcının piyasa analizini geliştirecek harika bir araçtır. Bu gösterge, kullanıcıların forex piyasasının karmaşıklıklarında güvenle ve hassasiyetle yol almalarını sağlar. Birincil sinyallerin ötesinde, Trend Ai göstergesi geri çekilmeler veya düzeltmeler sırasında ortaya çıkan ikincil giriş noktalarını belirleyerek, yatırımcıların belirlenen trend içindeki fiyat düzeltmele
Advanced Supply Demand MT5
Bernhard Schweigert
4.5 (14)
Herhangi bir Acemi veya Uzman Tüccar için En İyi Çözüm! Bu gösterge benzersiz, yüksek kaliteli ve uygun fiyatlı bir ticaret aracıdır çünkü bir dizi tescilli özelliği ve yeni bir formülü bir araya getirdik. Bu güncelleme ile çift zaman dilimi dilimlerini gösterebileceksiniz. Yalnızca daha yüksek bir TF gösteremeyeceksiniz, aynı zamanda TF grafiğini ve ARTIK daha yüksek TF'yi de gösterebileceksiniz: YUVARLAK BÖLGELERİ GÖSTERMEK. Tüm Arz Talebi tüccarları buna bayılacak. :) Önemli Bilgiler Açıkland
- Real price is 80$ - 45% Discount (It is 45$ now) Contact me for extra bonus   indicator, instruction or any questions! - Lifetime update free - Non-repaint - Related product: Gann Gold EA - I just sell my products in Elif Kaya Profile, any other websites are stolen old versions, So no any new updates or support. Advantages of  M1 Scalper Pro  Profitability: M1 Scalper Pro is highly profitable with a strict exit strategy. Frequent Opportunities: M1 Scalper Pro  takes advantage of numerous smal
Berma Bands
Muhammad Elbermawi
5 (7)
Berma Bantları (BB'ler) göstergesi, piyasa trendlerini belirlemeyi ve bunlardan yararlanmayı amaçlayan yatırımcılar için değerli bir araçtır. Fiyat ile BB'ler arasındaki ilişkiyi analiz ederek, yatırımcılar bir piyasanın trend veya aralıklı fazda olup olmadığını ayırt edebilir. Daha fazla bilgi edinmek için [ Berma Home Blog ] adresini ziyaret edin. Berma Bantları üç belirgin çizgiden oluşur: Üst Berma Bandı, Orta Berma Bandı ve Alt Berma Bandı. Bu çizgiler fiyatın etrafına çizilir ve genel tren
Grabber System MT5
Ihor Otkydach
4.81 (21)
Size mükemmel bir teknik gösterge olan Grabber’ı tanıtıyorum. Bu araç, kullanıma hazır bir “her şey dahil” işlem stratejisi olarak çalışır. Tek bir yazılım kodu içinde güçlü piyasa teknik analiz araçları, işlem sinyalleri (oklar), uyarı işlevleri ve push bildirimleri entegre edilmiştir. Bu göstergeyi satın alan herkes aşağıdaki hediyeleri ücretsiz olarak alır: Açık emirleri otomatik yönetmek için Grabber Yardımcı Aracı Kurulum, yapılandırma ve nasıl işlem yapılacağını adım adım anlatan video kıl
MetaForecast M5
Vahidreza Heidar Gholami
5 (3)
MetaForecast, fiyat verilerindeki harmonileri kullanarak herhangi bir piyasanın geleceğini tahmin eder ve görselleştirir. Piyasa her zaman tahmin edilemezken, fiyatlarda bir desen varsa, MetaForecast geleceği mümkün olduğunca doğru bir şekilde tahmin edebilir. Benzer ürünlere göre, MetaForecast piyasa eğilimlerini analiz ederek daha kesin sonuçlar üretebilir. Giriş Parametreleri Past size (Geçmiş boyut) MetaForecast'ın gelecekteki tahminler oluşturmak için kullandığı çubuk sayısını belirtir. Mo
IX Power MT5
Daniel Stein
4.92 (12)
IX Power: Endeksler, Emtialar, Kripto Paralar ve Forex Piyasaları için İçgörüler Genel Bakış IX Power , endeksler, emtialar, kripto paralar ve forex sembollerinin gücünü analiz etmek için tasarlanmış çok yönlü bir araçtır. FX Power , tüm kullanılabilir döviz çiftlerinin verilerini kullanarak döviz çiftleri için maksimum doğruluk sağlarken, IX Power yalnızca temel sembolün piyasa verilerine odaklanır. Bu, IX Power 'ı forex dışındaki piyasalar için ideal ve daha basit forex analizleri için güven
Quantum TrendPulse
Bogdan Ion Puscasu
5 (20)
SuperTrend   ,   RSI   ve   Stochastic'in   gücünü tek bir kapsamlı göstergede birleştirerek işlem potansiyelinizi en üst düzeye çıkaran nihai işlem aracı olan   Quantum TrendPulse'u   tanıtıyoruz. Hassasiyet ve verimlilik arayan yatırımcılar için tasarlanan bu gösterge, piyasa trendlerini, momentum değişimlerini ve en uygun giriş ve çıkış noktalarını güvenle belirlemenize yardımcı olur. Temel Özellikler: SuperTrend Entegrasyonu:   Güncel piyasa trendlerini kolayca takip edin ve karlılık dalgası
ARIPoint
Temirlan Kdyrkhan
1 (1)
ARIPoint is a powerful trading companion designed to generate high-probability entry signals with dynamic TP/SL/DP levels based on volatility. Built-in performance tracking shows win/loss stats, PP1/PP2 hits, and success rates all updated live. Key Features: Buy/Sell signals with adaptive volatility bands Real-time TP/SL/DP levels based on ATR Built-in MA Filter with optional ATR/StdDev volatility Performance stats panel (Success, Profit/Loss, PP1/PP2) Alerts via popup, sound, push, or email Cu
Ne kadar harika geriye dönük testler, canlı hesap performans kanıtları ve her yerde fantastik istatistikler sunan bir alım satım göstergesi aldınız, ancak onu kullandıktan sonra hesabınızı **patlatmakla mı sonuçlandınız?** Bir sinyale tek başına güvenmemelisiniz, öncelikle neden ortaya çıktığını bilmeniz gerekir ve RelicusRoad Pro bunu en iyi şekilde yapar! Kullanım Kılavuzu + Stratejiler + Eğitim Videoları + VIP Erişimli Özel Grup + Mobil Sürüm Mevcut Piyasaya Bakmanın Yeni Bir Yolu RelicusR
Elliott Wave Trend was designed for the scientific wave counting. This tool focuses to get rid of the vagueness of the classic Elliott Wave Counting using the guideline from the template and pattern approach. In doing so, firstly Elliott Wave Trend offers the template for your wave counting. Secondly, it offers Wave Structural Score to assist to identify accurate wave formation. It offers both impulse wave Structural Score and corrective wave Structure Score. Structural Score is the rating to sh
Yazarın diğer ürünleri
Fair Value Gaps
Cao Minh Quang
4.88 (60)
Fair Value Gap (FVG) Indicator Overview The Fair Value Gap (FVG) Indicator identifies inefficiencies in price action where an imbalance occurs due to aggressive buying or selling. These gaps are often created by institutional traders and smart money, leaving areas where price may later return to "fill" the imbalance before continuing its trend. Key Features: Automatic Detection of FVGs – The indicator highlights fair value gaps across different timeframes. Multi-Timeframe Support – View FVGs fr
FREE
Market Sessions Pre
Cao Minh Quang
4.75 (4)
The Market Sessions indicator is a popular tool among forex and stock traders for visually representing global trading sessions on a price chart. It highlights the time periods for major trading sessions — such as the Asian (Tokyo) , European (London) , and American (New York) sessions — directly on the chart. This helps traders identify when markets open and close, allowing for better decision-making based on session-specific trading behavior. - Asian Session (Default: 00:00-09:00) - London Se
FREE
Fair Value Gaps MT4
Cao Minh Quang
3.88 (8)
The Fair Value Gap (FVG) is a price range where one side of the market liquidity is offered, typically confirmed by a liquidity void on the lower time frame charts in the same price range. Price can "gap" to create a literal vacuum in trading, resulting in an actual price gap. Fair Value Gaps are most commonly used by price action traders to identify inefficiencies or imbalances in the market, indicating that buying and selling are not equal. If you're following the ICT Trading Strategy or Smart
FREE
MACD Indicator It has MACD line, Signal line, and Histogram. The Histogram has 4 colors based on Direction Above and Below the Zero Line, showing its movement direction as simple as possible. Allows Show MACD & Signal Line, Show Change In color of MACD   Line based on cross of Signal Line. Show Dots at Cross of MacD and Signal Line, Turn on and off Histogram. Enjoy your trading experience, and feel free to share your comments and reviews. If you are interested in this indicator, you might be i
FREE
The Market Sessions indicator is a popular tool among forex and stock traders for visually representing global trading sessions on a price chart. It highlights the time periods for major trading sessions — such as the   Asian (Tokyo) ,   European (London) , and   American (New York)   sessions — directly on the chart. This helps traders identify when markets open and close, allowing for better decision-making based on session-specific trading behavior. - Asian Session (Default: 00:00-09:00) - Lo
FREE
MACD Indicator It has MACD line, Signal line, and Histogram. The Histogram has 4 colors based on Direction Above and Below the Zero Line, showing its movement direction as simple as possible. Allows Show MACD & Signal Line, Show Change In color of   MACD     Line based on cross of Signal Line. Show Dots at Cross of MacD and Signal Line, Turn on and off Histogram. Enjoy your trading experience, and feel free to share your comments and reviews. If you are interested in this indicator, you might
FREE
I've combined two trading strategies, the Order Block Strategy and the FVG Trading Strategy, by utilizing a combination of the FVG indicators and Order Blocks. The results have been surprisingly effective. This is a two-in-one solution that makes it easy for traders to identify critical trading zones. I've optimized the settings so that all you need to do is install and trade; it's not overly complex to explain further. No need for any usage instructions regarding the trading method. You shoul
The latest version of Indicator is fully integrated into an all-in-one package, including: Fair Value Gaps (FVG).  Implied Fair Value Gap (IFVG).  OrderBlock (OB).  The options in the settings section are relatively easy to navigate, and you can even use them right away upon activation without encountering difficulties when using the default configuration. The indicator utilizes an algorithm to automatically draw and identify Order Blocks (OB), Fair Value Gaps (FVGs), and Implied Fair Value Gap
The Trend Duration Forecast MT5 indicator is designed to estimate the probable lifespan of a bullish or bearish trend. Using a Hull Moving Average (HMA) to detect directional shifts, it tracks the duration of each historical trend and calculates an average to forecast how long the current trend is statistically likely to continue. This allows traders to visualize both real-time trend strength and potential exhaustion zones with exceptional clarity. KEY FEATURES Dynamic Trend Detection:   Utiliz
SMC Analyzer Multi-Timeframe is a powerful tool designed to help traders apply Smart Money Concepts (SMC) across multiple timeframes. This indicator identifies key structural points such as market structure shifts (Break of Structure and Change of Character), order blocks, fair value gaps (FVG), and liquidity zones from higher timeframes and overlays them onto the current chart. By aligning these critical SMC signals across multiple timeframes, traders gain a more comprehensive view of instituti
The Pure Price Action ICT Tools indicator is designed for pure price action analysis, automatically identifying real-time market structures, liquidity levels, order & breaker blocks, and liquidity voids. Its unique feature lies in its exclusive reliance on price patterns, without being constrained by any user-defined inputs, ensuring a robust and objective analysis of market dynamics. Key Features Market Structures A Market Structure Shift, also known as a Change of Character (CHoCH), is a pivot
The   Market Structure Signal   indicator is designed to detect   Change of Character (CHoCH) and Break of Structure (BOS) in price action, helping traders identify potential trend reversals or continuations. It combines market structure analysis with volatility (ATR) to highlight possible risk/reward zones, while also supporting multi-channel alerts so that no trading signal is missed. Interpretation Trend Analysis : The indicator’s trend coloring, combined with BOS and CHoCH detection, provide
Simple ICT Concepts
Cao Minh Quang
5 (2)
The Simple ICT Concepts Indicator is a powerful tool designed to help traders apply the principles of the Inner Circle Trader (ICT) methodology. This indicator focuses on identifying key zones such as liquidity levels, support and resistance, and market structure, making it an invaluable asset for price action and smart money concept traders. Key Features Market Structure: Market structure labels are constructed from price breaking a prior swing point. This allows a user to determine the curren
Supertrend Targets Signal is a powerful trend-following and breakout confirmation indicator designed to help traders identify high-probability entry points , visualize dynamic target zones , and receive clean, reliable signals across various market conditions. The core trend logic is built on a custom Supertrend that uses an ATR-based band structure with long smoothing chains—first through a WMA, then an EMA—allowing the trend line to respond to major shifts while ignoring noise. A key addition
The   Simple  ICT Concepts Indicator   is a powerful tool designed to help traders apply the principles of the   Inner Circle Trader (ICT)   methodology. This indicator focuses on identifying key zones such as liquidity levels, support and resistance, and market structure, making it an invaluable asset for price action and smart money concept traders. Key Features Market Structure : Market structure labels are constructed from price breaking a prior swing point. This allows a user to determine t
The ICT Anchored Market Structures with Validation trading indicator is  designed to bring precision, objectivity, and automation to price action analysis. It helps traders visualize real-time market structure shifts, trend confirmations, and liquidity sweeps across short, intermediate, and long-term market phases — all anchored directly to price, without relying on any external or user-defined inputs.  Uses Market structure is one of the most critical foundations of price action trading strate
Automatically detect bullish or bearish order blocks to optimize your trade entries with our powerful indicator. Ideal for traders following ICT (The Inner Circle Trader). Works with any asset type, including cryptocurrencies, stocks, and forex. Displays order blocks on multiple timeframes, from M2 to W1. Alerts you when an order block is detected, migrated, or a higher timeframe order block is created/migrated. Perfect for both scalping and swing trading in Smart Money Concepts.  Enhanced by st
The Market Structure Signal indicator is designed to detect Change of Character (CHoCH) and Break of Structure (BOS) in price action, helping traders identify potential trend reversals or continuations. It combines market structure analysis with volatility (ATR) to highlight possible risk/reward zones, while also supporting multi-channel alerts so that no trading signal is missed. Interpretation Trend Analysis : The indicator’s trend coloring, combined with BOS and CHoCH detection, provides an i
The SMC Analyzer STF is a powerful, single-timeframe Smart Money Concepts (SMC) analysis tool designed for precision trade confirmations based on core SMC components. It evaluates market structure across four levels of confirmation using elements such as Break of Structure (BOS), Change of Character (CHoCH), Order Blocks (OB), Fair Value Gaps (FVGs), Liquidity Zones, and Higher Timeframe Trend Bias. Each level has configurable elements (BOS, OB, FVG, Liquidity Zones, Higher Timeframe Trend). The
The   Linear Regression Oscillator (LRO)   is a technical indicator based on linear regression analysis, commonly used in financial markets to assess the momentum and direction of price trends. It measures the distance between the current price and the value predicted by a linear regression line, which is essentially the best-fit line over a specified period. Here’s a breakdown of how it works and its components: Key Components of the Linear Regression Oscillator Linear Regression Line (Best-Fit
This Simple Smart Money Concepts indicator displays real-time market structure (internal & swing BOS / CHoCH), order blocks, premium & discount zones, equal highs & lows, and much more...allowing traders to automatically mark up their charts with widely used price action methodologies. "Smart Money Concepts" (SMC) is used term amongst price action traders looking to more accurately navigate liquidity & find more optimal points of interest in the market. Trying to determine where institutional
The Pure Price Action ICT Tools indicator is designed for pure price action analysis, automatically identifying real-time market structures, liquidity levels, order & breaker blocks, and liquidity voids. Its unique feature lies in its exclusive reliance on price patterns, without being constrained by any user-defined inputs, ensuring a robust and objective analysis of market dynamics. Key Features Market Structures A Market Structure Shift, also known as a Change of Character (CHoCH), is a pivot
Multiple Non-Linear Regression MT4 This indicator is designed to perform multiple non-linear regression analysis using four independent variables: close, open, high, and low prices. Here's a components and functionalities: Inputs: Normalization Data Length: Length of data used for normalization. Learning Rate: Rate at which the algorithm learns from errors. Show data points: Show plotting of normalized input data(close, open, high, low) Smooth?: Option to smooth the output. Smooth Length: Lengt
The Market Structure with Inducements & Sweeps indicator is a unique take on Smart Money Concepts related market structure labels that aims to give traders a more precise interpretation considering various factors. Compared to traditional market structure scripts that include Change of Character (CHoCH) & Break of Structures (BOS) -- this script also includes the detection of Inducements (IDM) & Sweeps which are major components of determining other structures labeled on the chart. SMC & pri
Smart Market Structure Simple   is a powerful indicator that helps traders identify   market structure   based on the   Smart Money Concept (SMC) . This indicator automatically detects   Break of Structure (BOS), Change of Character (CHoCH), Fair Value Gaps (FVG), Order Blocks (OB), Liquidity Zones (LQZ),   and key swing points   Higher High (HH), Higher Low (HL), Lower High (LH), Lower Low (LL) . Main Objective:   Assist traders in tracking institutional flow ( Smart Money ) and finding high-p
Unicorn Model ICT Indicator — Smart Trading with Precision The   Unicorn Model ICT Indicator   is a powerful and intelligent tool designed for traders who follow   Smart Money Concepts (SMC)   and   Inner Circle Trader (ICT)   methodologies. This indicator simplifies complex price action by visually identifying key market structures and providing high-probability trade setups. Key Features: A Bullish Unicorn Pattern A Lower Low (LL), followed by a Higher High (HH) A Fair Value Gap (FVG), overla
The   Quasimodo Pattern Indicator  is no more difficult than the Head and Shoulders. Still, only a few traders know about it, and some even confuse one with the other. However, this is not a reason to avoid this tool in your forex trading strategy.    Features: Automatic Detection:   The indicator automatically scans for valid QM patterns across any timeframe, reducing the need for manual chart analysis. Visual Highlights:   Clear and customizable on-chart drawing of shoulders, heads, and breako
Order Block Multi Timeframe The   Order Block Multi Timeframe   is a powerful tool for Smart Money Concept (SMC) traders, combining high-accuracy   Order Block detection   with real-time   Break of Structure (BOS)   and   Change of Character (CHoCH)   analysis across multiple timeframes. Smart Money Insight, Multi-Timeframe Precision This indicator automatically identifies   institutional Order Blocks —key price zones where large players have entered the market—and plots them directly on your ch
Rectangle Trading Custom   is a powerful technical analysis tool designed for price action and range-based traders. It allows users to define consolidation zones and receive alerts when the price breaks out of these zones or approaches trendlines drawn on the chart. Rectangles and Trendlines will be extended into future with one click. Rectangle point size, name and prices will be displayed around rectangle. Key Features: Draw Trading Zones (Rectangle Zones) Users can manually draw rectangles t
SMC Analyzer Single-Timeframe (STF) for MT4 The   SMC Analyzer STF  MT4  is a powerful, single-timeframe Smart Money Concepts (SMC) analysis tool designed for precision trade confirmations based on core SMC components. It evaluates market structure across four levels of confirmation using elements such as   Break of Structure (BOS), Change of Character (CHoCH), Order Blocks (OB), Fair Value Gaps (FVGs), Liquidity Zones , and   Higher Timeframe Trend Bias . Each level has configurable elements (
Filtrele:
İnceleme yok
İncelemeye yanıt