Bayesian Trend Indicator

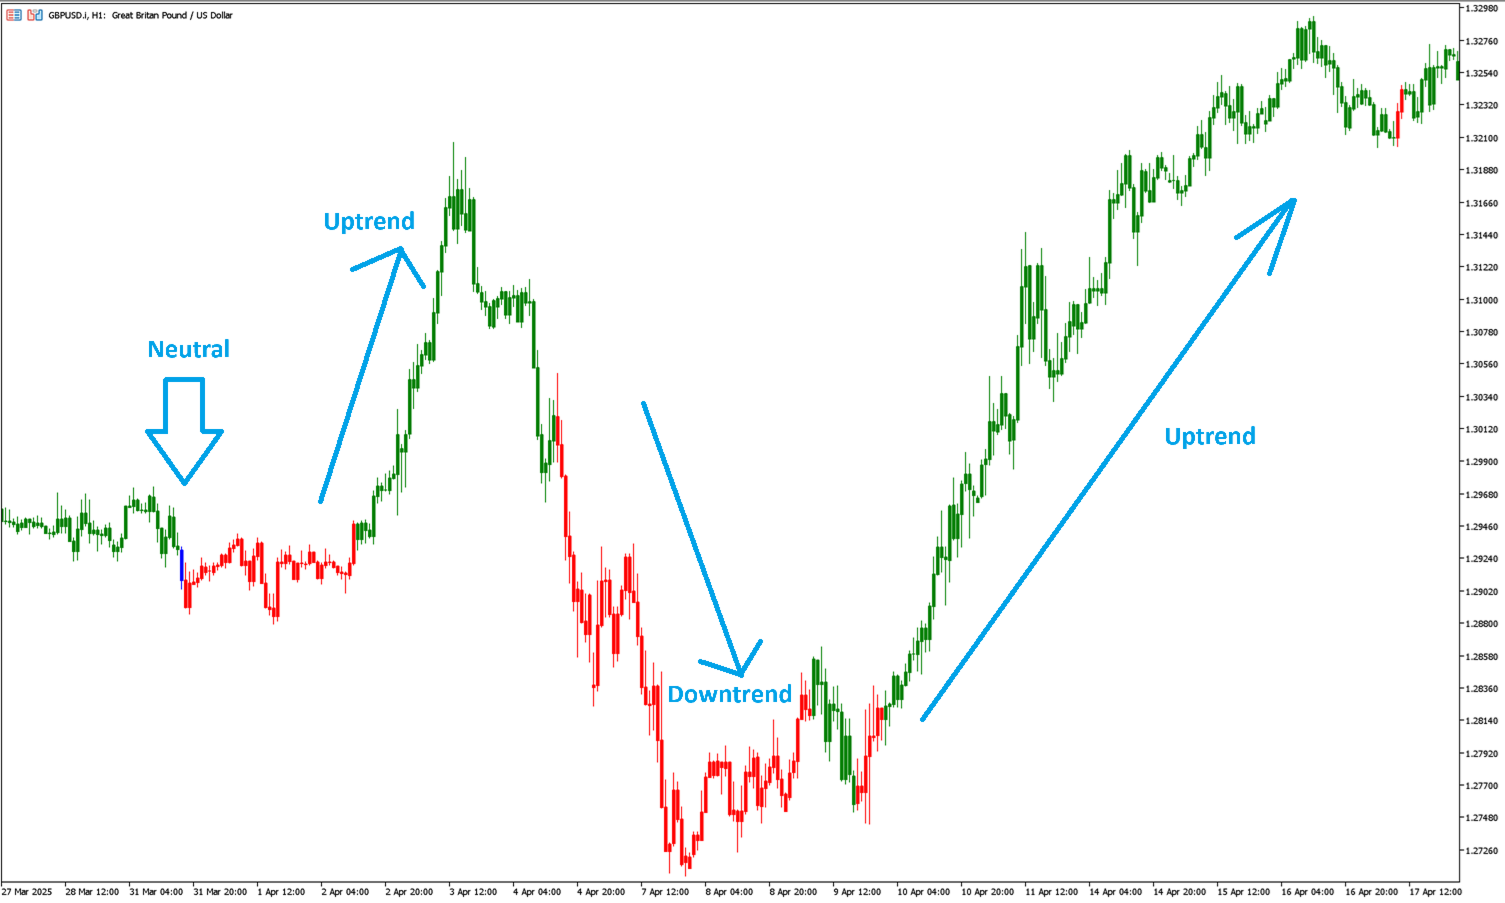
The Bayesian Trend Indicator colors each candle according to a Bayesian‐inference of trend direction. It computes “prior” trend strength from four standard moving averages (EMA, SMA, DEMA, VWMA) of your chosen length, then computes a “likelihood” from faster versions of those same MAs (shortened by a “gap”). It combines them to produce a posterior probability of an uptrend. Candles are colored:

  • Green when posterior indicates a strong uptrend.

  • Red when posterior indicates a strong downtrend.

  • Blue when posterior is neutral/uncertain.

This indicator combines the principles of Bayesian probability theory with moving average analysis to provide traders with a comprehensive understanding of market sentiment and potential trend reversals. The Bayesian Trend Indicator begins by calculating the trend for both fast and slow moving averages using a Smoothed Gradient Signal Function. This function assigns a numerical value to each data point based on its relationship with historical data, indicating the strength and direction of the trend.

You can read here more about the Bayes' Theorem: https://en.wikipedia.org/wiki/Bayes%27_theorem


Key Features

  • Bayesian-Based Trend Detection
    Combines a “prior” trend estimate (from standard-length MAs) with a “likelihood” estimate (from faster MAs) via Bayes’ theorem to produce a robust posterior trend probability.

  • Multi-MA Ensemble
    Uses four different moving-average types—EMA, SMA, (pseudo-)DEMA, VWMA—for both slow and fast lengths, smoothing out idiosyncratic noise of any single MA.

  • Candle-Color Visualization
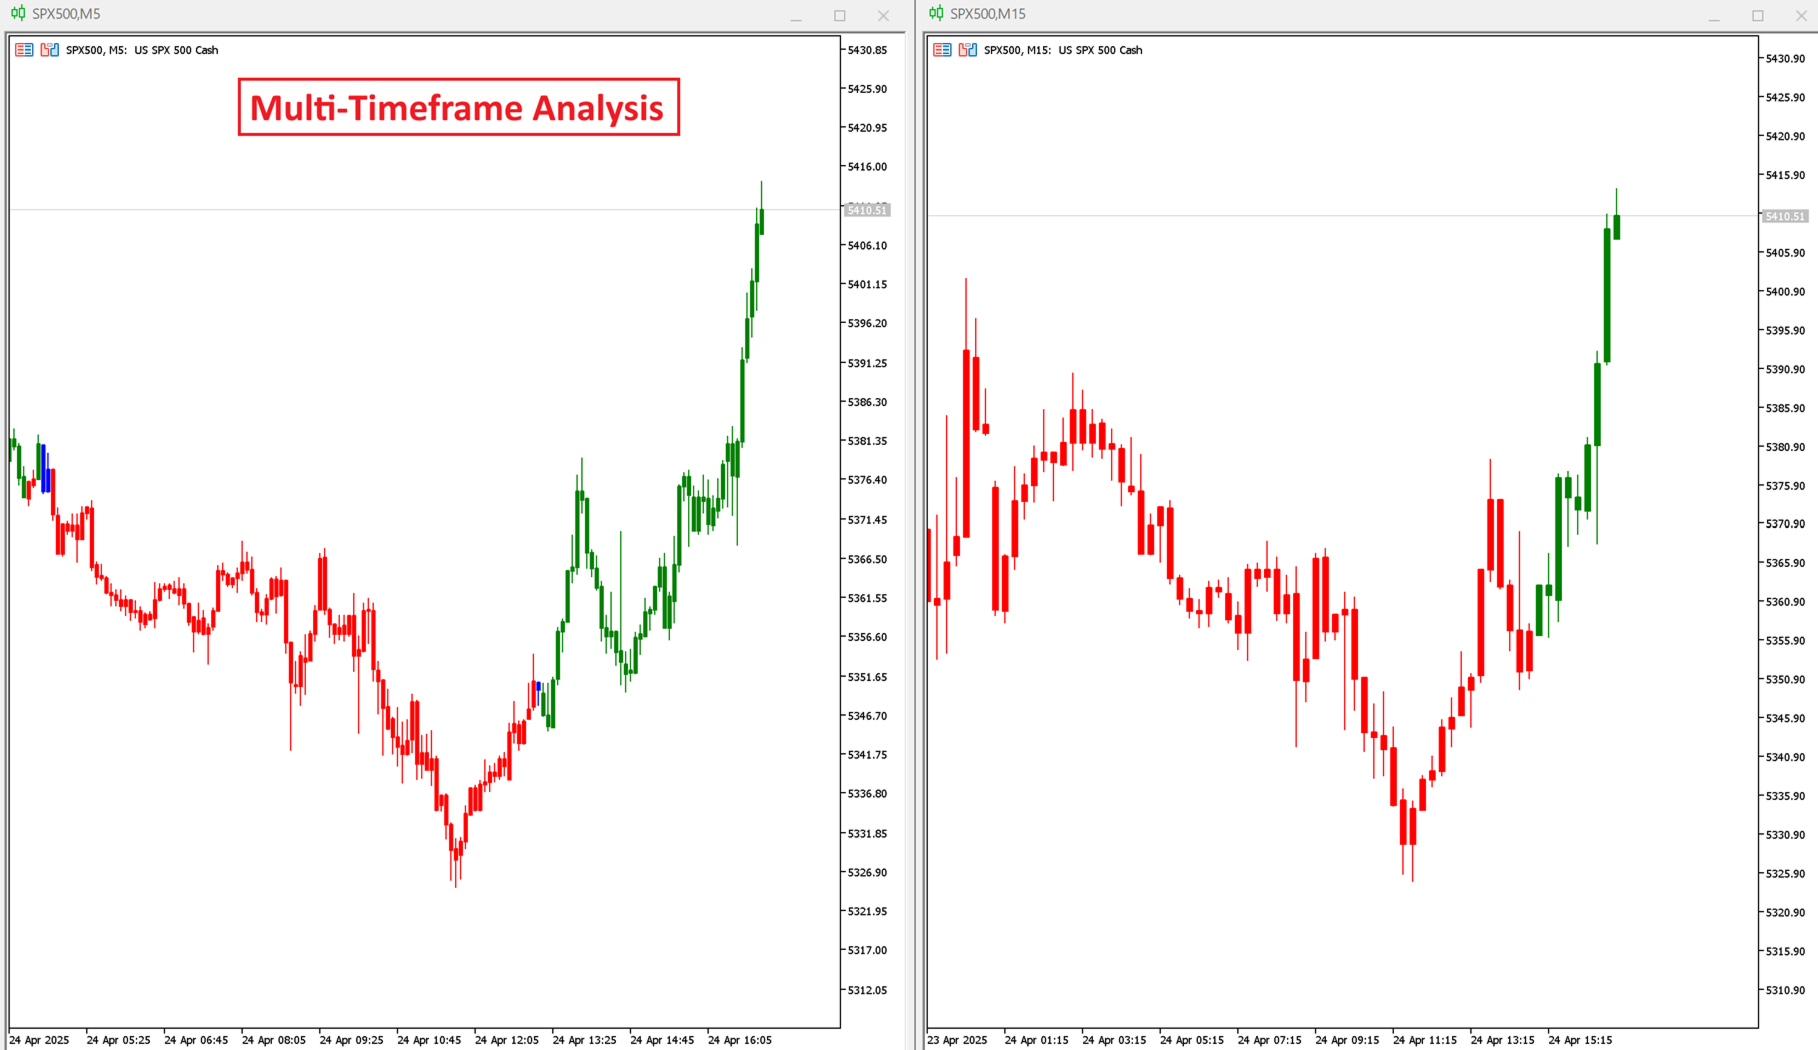
    Paints chart candles in three distinct colors—uptrend (green), downtrend (red), neutral (blue)—making trend shifts immediately visible.
  • Lightweight & Real-Time
    All calculations occur on‐chart in real-time, with minimal performance overhead, suitable for any timeframe.


Indicator Parameters

  • MA Lenght: Base MA length for prior probability calculation.
  • Gap Lenght between fast and slow MA: Difference between base and fast MA lengths.
  • Gap signals: Number of bars to look back when smoothing the signal.
  • Short SMA Lenght: Length of short SMA (used internally).
  • Long SMA Lenght: Length of long SMA (used internally).


Interpretation & Usage

  • Strong Uptrend (Green): Consider long entries or holding existing longs. Confirmation from other tools (e.g. RSI divergence) can improve reliability.

  • Strong Downtrend (Red): Consider short entries or exit longs. Use stops above recent swing highs.

  • Neutral (Blue): Market indecision. Best to stay flat or use range-trading strategies until trend clarifies.


This is not financial advice! This is a realtime indicator and doesn't repaint.


    Önerilen ürünler
    Bollinger Bands Max Free MT5
    John Louis Fernando Diamante
    5 (2)
    A flexible BB indicator You're no longer limited to the built in default of using BB off a SMA method, now you can choose from: SMA - SMMA - EMA - LWMA - ADAPTIVE - FRACTAL ADAPTIVE - DEMA - TEMA - VARIABLE INDEX DYNAMIC You now also have 2 standard deviation levels. A more featured version is available with 5 deviation levels, color gradients to lines and filling as well as candles, with full alerts too: Bollinger Bands Max MT5 Options: - MTF - 9 choices of MA to base the BB off -  2 adjustabl
    FREE
    Multi-timeframe trend indicator based on the ADX / ADXWilder indicator with Fibonacci levels The indicator shows trend areas using ADX or ADXWilder indicator data from multiple timeframes. The impulse mode of the indicator allows you to catch the beginning of a trend, and several "Screens" with different timeframes allow you to filter out market noise. Fibonacci levels are added to the price chart, which have flexible settings. How the indicator works: if PDI is greater than NDI, then   it`s
    FREE
    This is simple indicator for displaying Multi Moving Average line in chart, with one single Indicator. Just place the indicator in your chart, select how many MAs you want to display.  And you are ready to go. Parameters can be changed on the fly by the control panel provided by the Indicator. And you can show/hide the Moving Average line just with check/unchecked in the Panel. This indicator are still in development, if you have any further feature request, please let me know in the comment.
    FREE
    Pure View
    Siarhei Vashchylka
    5 (2)
    The " Pure View " indicator is designed to quickly display and hide indicators on the chart. Description 1. Currently Pure View works with Stochastic, MACD, RSI indicators 2. Displaying and hiding indicators occurs using hot keys 3. The key combination Shift + C will display or hide the "Stochastic" indicator on the chart 4. The key combination Shift + V will display or hide the "RSI" indicator on the chart 5. The key combination Shift + B will display or hide the "MACD" indicator on the chart A
    FREE
    Madx Cobra   Madx Cobra Indicator. Create to traders both experienced and inexperienced to use it because it is a basic indicator How to use : Setting Indicator 1. MA Fast  : Moving Average fast (10) 2. MA Slow :  Moving Average Slow control trend markets.(200) 3. ADX : Control trend(5) 4. For alert you can set to alert Next bar or instant bars.  When arrow sky blue show or arrow up, you can entry order "Buy" or "Long" and arrow red show or arrow down, you can entry order "Sell" or "Short" S
    PFKBreakOut
    Stanislav Korotky
    This indicator displays breakouts on Point-And-Figure-like or Kagi-like custom symbol charts, generated by special expert advisers, such as PointFigureKagiCharts . This indicator is applicable only for custom instruments generated in appropriate way (with time-invariant bars which are multiples of a predefined box size). It makes no sense to apply it to other charts. The breakouts in up or down direction are marked by arrows. The breakout price is found at crossing of one of imaginary lines of
    FREE
    VBOT CORE SIGNAL — Multi-Timeframe Trend + ADR Context for Forex, Gold, and Crypto CFDs Trade with clarity. Avoid low-quality trades. VBOT CORE SIGNAL identifies BUY, SELL, and NO TREND conditions. NO TREND — NO TRADE Launch Price: $39 (limited to the first 30 days) The price will increase to $59 after this period. Introduction VBOT CORE SIGNAL is not a simple indicator like RSI, ADX, or MA used in isolation. It is designed as a multi-layered system that combines market data, trend evaluation, a
    The   Heikin Ashi indicator   is our version of the Heikin Ashi chart. Unlike competitor products, this indicator offers extensive options for calculating Heikin Ashi candles. In addition, it can be displayed as a classic or smoothed version. The indicator can calculate Heikin Ashi with moving average by four methods: SMA  - Simple Moving Average SMMA  - Smoothed Moving Average EMA  - Exponential Moving Average LWMA  - Linear Weighted Moving Average Main features The indicator shows Heikin As
    FREE
    Технический индикатор Trend Moving Average позволяет определить глобальное направление рынка. Данный технический индикатор создан для того, чтобы определить «линию наименьшего сопротивления» рынка и понять в какую сторону направлен тренд. Помимо классического использования МА, индикатор позволяет понять направленность рынка на основе динамики его значений. Так, если значение индикатора демонстрируют переход с нисходящего значения в восходящее (и наоборот) - это является дополнительным торговым с
    FREE
    HMA5
    Sergey Sapozhnikov
    4.3 (10)
    Hull Moving Average is more sensitive to the current price activity than a traditional Moving Average. It faster responds to trend change and more shows the price movement more accurately. This is a color version of the indicator. This indicator has been developed based in the original version created by Sergey <wizardserg@mail.ru>. Suitable for all timeframes. Parameters Period - smoothing period, recommended values are 9 to 64. The larger the period, the softer the light. Method - smoothing m
    FREE
    Macd Alpha Candles
    Aiman Saeed Salem Dahbag
    5 (1)
    MACD Alpha Candles – Advanced MACD Visualization Using OHLC Candlestick Format This is a demo version of the indicator, intended for evaluation purposes. MACD Alpha Candles is a powerful and innovative indicator that transforms the traditional MACD into a dynamic candlestick (OHLC) representation within a separate window. Instead of displaying standard lines or histograms, this indicator calculates MACD values based on Open, High, Low, and Close prices, then converts them into candles, providin
    FREE
    LT Force
    Thiago Duarte
    5 (5)
    For those who like trend the Force will be a very useful indicator. This is because it is based on the famouse ADX, which measure the strenght of a trend, but without its 3 confusing lines. Force has its very simple interpretation: if the histogram is above zero level the trend is up, otherwise it is down. You can use it to find divergences too, which is very profitable. Thanks to Andre Sens for the version 1.1 idea. If you have any doubt or suggestion, please, contact me. Enjoy! MT4 version: 
    FREE
    Phoenix Moving Average Meter
    PHOENIX GLOBAL INVESTMENTS LTD
    Phoenix Hareketli Ortalama Ölçer (MT5) MetaTrader 5 için profesyonel hareketli ortalama trend analizi ve görselleştirme aracı. Akıllı eğim analizi, bulut genişliği ölçümü ve rejim sınıflandırmasını temiz, gerçek zamanlı bir gösterge panosunda birleştirir. Genel Bakış Phoenix Hareketli Ortalama Ölçer, trend yönünü, gücünü ve olgunluğunu belirlemek için hızlı ve yavaş hareketli ortalamalar arasındaki ilişkiyi analiz eder. Gösterge, mevcut piyasa rejimini gerçek zamanlı olarak sınıflandırmak içi
    FREE
    MAs crossing
    Roman Ogorodnikov
    5 (1)
    The indicator draws three Moving Averages. Two short ones cross a long one. At the same time, the long MA changes color: If both short MAs are above the long one - first color; If both short MAs are below the long one - second color; If the two short MAs are on opposite sides of the long one - third color. All three MAs are based on closing prices with a smoothing method of "simple." cross MA cross 3 MA cross three Moving Average across Moving cross Moving crossing  MA crossing MA across MA
    FREE
    This indicator is a zero-lag indicator and displays  strength of trend change . True Trend  Oscillator Pro works best in combination with True Trend Moving Average Pro that displays exact trend as is. Oscillator value is exact price change in given direction of the trend. True Trend Moving Average Pro: https://www.mql5.com/en/market/product/103586 If you set PERIOD input parameter to 1 this indicator becomes a sharpshooter for binary options. Developers can use True Trend Oscillator in Exper
    FREE
    Colored MACD Indicator
    Claudio Jean-claude Spillmann
    A beutiful, multi colored MACD indicator. It offers the possibility to change the colors of the "main line" and the "signal line" and uses four different colors for the "histogram" It also returns the buffer-values from the "main line", "signal line", "histogram" and "color" to acess it from an EA If you need some changes, or additional buffers -> send me a message
    SMA ReEntry
    Mattia Impicciatore
    1 (1)
    SMA Reentry Nedir? SMA Reentry , biri hızlı biri yavaş olmak üzere iki basit hareketli ortalama (SMA) kullanarak trend yönünde yeniden giriş noktalarını gösteren profesyonel bir indikatördür. Bu indikatör, fiyatın yavaş SMA ile tanımlanan bir trendde, hızlı SMA’nın üzerine (veya altına) tekrar geçtiği anları net bir şekilde gösterir. Pullback, breakout ve trend yeniden giriş sinyalleri arayanlar için ideal bir araçtır. Nasıl Çalışır? Hızlı ve yavaş SMA’nın kesişimiyle ana trendi belirler. Fiyat
    FREE
    Hi Traders, The THV EMA Distance Monitor is a lightweight and flexible MT5 indicator designed to display the real-time distance between price and multiple Exponential Moving Averages (EMA) directly on the chart. The indicator allows traders to enable or disable up to five EMAs, each with a customizable period, making it adaptable to different trading strategies and market conditions. For each selected EMA, the distance from the current price is calculated and displayed in a clear on-chart panel.
    FREE
    Multi-timeframe trend indicator, based on the ADX / ADXWilder indicator The indicator shows trend areas using ADX or ADXWilder indicator data from multiple timeframes. The impulse mode of the indicator allows you to catch the beginning of a trend, and several "Screens" with different timeframes allow you to filter out market noise. How the indicator works: if PDI is greater than NDI, then it`s bullish movement; if PDI is less than NDI, then it`s bearish movement; to determine any trend, it is
    FREE
    Indicador Monte Carlo Simulation Indicador faz uma regressão linear nos preços de fechamento do ativo escolhido e gera uma simulação de Monte Carlo de N preços aleatórios para definir 3 níveis de sobrecompra e 3 níveis de sobrevenda. O primeiro processo é a Regressão Linear dos preços de fechamento do ativo, no qual é regido pela equação: Y = aX + b + R Onde   Y   é o valor do ativo escolhido,  X   é o tempo,   a   é a inclinação da reta,   b   é a intersecção da reta e   R   é o resíduo. O resí
    FREE
    The   Liquidation Estimates (Real-Time)   experimental indicator attempts to highlight real-time long and short liquidations on all timeframes. Here with liquidations, we refer to the process of forcibly closing a trader's position in the market. By analyzing liquidation data, traders can gauge market sentiment, identify potential support and resistance levels, identify potential trend reversals, and make informed decisions about entry and exit points. USAGE (Img 1)  Liquidation refers to
    Main Indicator Description: RosMaFin Triple Insight CCI Navigator is an advanced technical indicator that combines the power of three popular indicators - CCI (Commodity Channel Index), Bollinger Bands, and Moving Average - in one comprehensive window. This versatile tool provides traders with a complex view of market conditions and helps identify potential trading opportunities with greater precision. Key Features: Display of all three indicators in one window for efficient analysis Fully custo
    FREE
    Bu MQL5 indikatoru, grafik pəncərəsində 4 ədəd Exponential Moving Average (EMA) xəttini göstərir: 21, 50, 100 və 200 . EMA 21 xüsusi olaraq rəngi dəyişən xətt kimi çəkilir, EMA 50, 100 və 200 isə standart tək rəngli xətlərdir. EMA 21-in rəngi qiymətin mövqeyinə görə avtomatik dəyişir. Əgər bağlanış qiyməti EMA 21-dən yuxarıdırsa , xətt mavi rəngdə göstərilir və bu, yüksəliş meylini ifadə edir. Əgər bağlanış qiyməti EMA 21-dən aşağıdırsa , xətt sarı rəngdə göstərilir və bu, eniş meylini göstərir.
    FREE
    Bu İndikatörün Avantajları: Bu, Akıllı Para Kavramları (SMC) tarzı ticaret için tasarlanmış, fiyat sıkışmalarını (Yatay seyir/Range) ve Kırılımları (Breakout) derinlemesine hacim analizi ile birlikte bulan bir araçtır. Otomatik Aralık Tespiti (Automated Range Detection): Elle çizmeye gerek yok: Piyasa yataya bağladığında kutuları/kanalları otomatik çizer. Önemli Bölgeler: SMC'nin temeli olan Birikim (Accumulation) ve Dağıtım (Distribution) bölgelerini netleştirir. Hacim Detay Analizi (Volume Bre
    TANIN ICHIMOKU CLOUD (EA20): The Ultimate Trend Rider & Prop Firm Shield Trading the Ichimoku Kinko Hyo system manually can be complex and emotionally draining. Are you tired of getting shaken out of massive trends by market noise? Meet EA20 Tanin Ichimoku Cloud , a fully automated trend-following system. It takes the guesswork out of Ichimoku by executing sniper entries and riding the mega trends with zero emotions.   ENTER YOUR KEY HERE:   [  EA20_99999D_TANINCODER_598259741005 ] --
    FREE
    Indicator Description 4 Hull MA Color + Envelopes is a powerful trend-following indicator for MetaTrader 5 that combines four Hull Moving Averages (HMA) with Moving Average Envelopes to clearly identify market direction, trend strength, and potential reversal or pullback zones. This indicator is designed to reduce noise, react quickly to price movement, and provide a clean visual structure for professional trading.   Key Features   4 Hull Moving Averages (20, 50, 100, 200) Automatic color change
    FREE
    H Line
    Tomas Lucena De Oliveira
    The moving average applied to the price chart is one of the most used technical analysis methods. There are several ways to use averages, among them, through the analysis of crossings. The method consists of using two moving averages, one fast period and one slow period. The concept is very simple, when there is a crossing of the fast moving average upwards it indicates a high market trend  and when the fast moving average crosses downwards it indicates a low  trend in the market, combining th
    Let us introduce the Heikin Ashi RSI Oscillator! This indicator combines the concepts of Heikin Ashi candles with the RSI (Relative Strength Index) to produce an oscillator-like format that can be used to filter out some of the noise associated with standard RSI readings. This provides traders with a smoother representation of market conditions. Here are some articles to read more about the RSI and Heikin Ashi candles: https://www.investopedia.com/terms/r/rsi.asp https://www.investopedia.com/ter
    Infinity Predictor MA
    Murtadha Majid Jeyad Al-Khuzaie
    Infinity Predictor MA Infinity Predictor MA is a next‑generation forecasting indicator that transforms the traditional Moving Average into a powerful predictive tool. Unlike standard MAs that only smooth past data, this indicator projects the moving average line up to 40 bars into the future, giving traders a unique perspective on potential market direction. The engine behind Infinity Predictor MA combines multiple advanced regression models to capture both smooth trends and sudden market shi
    FREE
    The standard Bollinger Bands indicator has been improved by integrating additional indications from the Standard Deviation indicator (StdDev), which gives an additional filter for confirming trading signals. In addition, the color of the indicator's lines shows the beginning of a trend, its development and exhaustion. This indicator has a signal block that notifies the trader of the beginning of the trend on any time frame to which it is attached. Settings Type of messages - select the type of
    FREE
    Bu ürünün alıcıları ayrıca şunları da satın alıyor
    SuperScalp Pro
    Van Minh Nguyen
    4.57 (21)
    SuperScalp Pro – Gelişmiş Çoklu Filtre Scalping Gösterge Sistemi SuperScalp Pro, işlem fırsatlarını belirlemeye yardımcı olmak için klasik Supertrend ile birden fazla akıllı onay filtresini birleştiren gelişmiş bir scalping göstergesidir. M1’den H4’e kadar farklı zaman dilimlerinde verimli şekilde çalışır ve XAUUSD, BTCUSD ile majör Forex pariteleri için optimize edilmiştir. Gösterge, net Al ve Sat sinyalleri sunar ve ATR tabanlı otomatik giriş fiyatı, stop loss ve take profit seviyeleri hesapla
    Divergence Bomber
    Ihor Otkydach
    4.9 (86)
    Bu göstergeyi satın alan herkese aşağıdaki ekstra içerikler ücretsiz olarak sunulmaktadır: Her işlemi otomatik olarak yöneten, Stop Loss ve Take Profit seviyelerini ayarlayan ve işlemleri strateji kurallarına göre kapatan özel yardımcı araç: "Bomber Utility" Göstergenin farklı varlıklar üzerinde kullanılmasına yönelik ayar dosyaları (set dosyaları) Bomber Utility için 3 farklı modda kullanım sunan ayar dosyaları: "Minimum Risk", "Dengeli Risk" ve "Bekle-Gör Stratejisi" Bu ticaret stratejisini hı
    Entry In The Zone and SMC Multi Timeframe is a real-time 2-in-1 market analysis tool that combines market structure analysis and a No Repaint BUY / SELL signal system into a single indicator, built on Smart Money Concepts (SMC) — a widely adopted framework used by professional traders to understand market structure. This indicator helps you see the market more clearly, make decisions based on structure rather than guesswork, and focus on high-probability zones where price is more likely to react
    Azimuth Pro
    Ottaviano De Cicco
    5 (6)
    Azimuth Pro V2: Synthetic Fractal Structure and Confirmed Entries for MT5 Overview Azimuth Pro is a multi-level swing structure indicator by Merkava Labs . Four nested swing layers, swing-anchored VWAP, ABC pattern detection, three-timeframe structural filtering, and closed-bar confirmed entries — one chart, one workflow from micro-swings to macro-cycles. This is not a blind signal product. It is a structure-first workflow for traders who care about location, context, and timing. V2 Launch Offe
    Gann Made Easy , bay teorisini kullanarak ticaretin en iyi ilkelerine dayanan, profesyonel ve kullanımı kolay bir Forex ticaret sistemidir. WD Gann. Gösterge, Zararı Durdur ve Kâr Al Seviyeleri dahil olmak üzere doğru SATIN AL ve SAT sinyalleri sağlar. PUSH bildirimlerini kullanarak hareket halindeyken bile işlem yapabilirsiniz. Satın alma işleminden sonra, alım satım talimatlarını ve harika ek göstergeleri ücretsiz olarak almak için lütfen benimle iletişime geçin! Muhtemelen Gann ticaret yöntem
    Quantum TrendPulse
    Bogdan Ion Puscasu
    5 (23)
    SuperTrend   ,   RSI   ve   Stochastic'in   gücünü tek bir kapsamlı göstergede birleştirerek işlem potansiyelinizi en üst düzeye çıkaran nihai işlem aracı olan   Quantum TrendPulse'u   tanıtıyoruz. Hassasiyet ve verimlilik arayan yatırımcılar için tasarlanan bu gösterge, piyasa trendlerini, momentum değişimlerini ve en uygun giriş ve çıkış noktalarını güvenle belirlemenize yardımcı olur. Temel Özellikler: SuperTrend Entegrasyonu:   Güncel piyasa trendlerini kolayca takip edin ve karlılık dalgası
    Bu indikatörü satın alırsanız, Profesyonel Trade Manager’ımı  + EA ÜCRETSİZ olarak alacaksınız. Öncelikle, bu Ticaret Sistemi'nin Non-Repainting, Non-Redrawing ve Non-Lagging Göstergesi olduğunu vurgulamak önemlidir, bu da hem manuel hem de robot ticareti için ideal hale getirir. Online kurs, kılavuz ve ön ayarları indir. "Smart Trend Trading System MT5", yeni ve deneyimli tüccarlar için özelleştirilmiş kapsamlı bir ticaret çözümüdür. 10'dan fazla premium göstergeyi birleştiriyor ve 7'den fazla
    OmniSync Projection
    Antonio-alin Teculescu
    5 (1)
    Chronos Fractal Engine is an innovative price projection indicator for MetaTrader 5, designed to transform your technical analysis by intelligently identifying and projecting historical price patterns. Built upon an advanced correlation algorithm and the fractal principles of the market, this powerful tool visualizes potential future price movements, giving you a unique edge in your trading decisions. What is Chronos Fractal Engine? At its core, the Chronos Fractal Engine employs a sophisticat
    Power Candles MT5
    Daniel Stein
    4.75 (8)
    Power Candles – Tüm Piyasalar İçin Güce Dayalı Giriş Sinyalleri Power Candles , Stein Investments’ın kanıtlanmış güç analizini doğrudan fiyat grafiğinize taşır. Sadece fiyata tepki vermek yerine, her mum gerçek piyasa gücüne göre renklendirilir. Bu sayede momentum birikimleri, güç hızlanmaları ve net trend geçişleri anında görülebilir. Tüm Piyasalar İçin Tek Mantık Power Candles tüm işlem sembollerinde otomatik olarak çalışır. Gösterge, mevcut sembolün Forex mi yoksa Forex dışı bir piyasa mı old
    FX Trend MT5 NG
    Daniel Stein
    5 (4)
    FX Trend NG: Yeni Nesil Çoklu Piyasa Trend Zekâsı Genel Bakış FX Trend NG , çoklu zaman dilimlerinde çalışan profesyonel bir trend analiz ve piyasa izleme aracıdır. Piyasanın yapısını saniyeler içinde anlamanızı sağlar. Birden fazla grafik arasında geçiş yapmak yerine, hangi enstrümanların trendde olduğunu, momentumun nerede zayıfladığını ve hangi zaman dilimlerinin uyumlu olduğunu anında görebilirsiniz. Lansman Teklifi – FX Trend NG sadece $30 (6 Ay) veya $80 Ömür Boyu Lisans ile edinin. Zate
    Tanıtım       Quantum Breakout PRO   , Breakout Bölgeleri ile ticaret yapma şeklinizi değiştiren çığır açan MQL5 Göstergesi! 13 yılı aşkın ticaret tecrübesine sahip deneyimli tüccarlardan oluşan bir ekip tarafından geliştirilmiştir.       Kuantum Breakout PRO       yenilikçi ve dinamik koparma bölgesi stratejisiyle ticaret yolculuğunuzu yeni zirvelere taşımak için tasarlanmıştır. Kuantum Breakout Göstergesi, size 5 kar hedefi bölgesi ile kırılma bölgelerinde sinyal okları ve kırılma kutusuna da
    Grabber System MT5
    Ihor Otkydach
    4.83 (23)
    Size mükemmel bir teknik gösterge olan Grabber’ı tanıtıyorum. Bu araç, kullanıma hazır bir “her şey dahil” işlem stratejisi olarak çalışır. Tek bir yazılım kodu içinde güçlü piyasa teknik analiz araçları, işlem sinyalleri (oklar), uyarı işlevleri ve push bildirimleri entegre edilmiştir. Bu göstergeyi satın alan herkes aşağıdaki hediyeleri ücretsiz olarak alır: Açık emirleri otomatik yönetmek için Grabber Yardımcı Aracı Kurulum, yapılandırma ve nasıl işlem yapılacağını adım adım anlatan video kıl
    Önce dürüst olalım. Hiçbir gösterge tek başına sizi kârlı yapmaz. Eğer biri size aksini söylüyorsa, size bir hayal satıyordur. Mükemmel al/sat okları gösteren her gösterge, kusursuzmuş gibi görünecek şekilde yapılabilir — sadece geçmişin doğru bir bölümünü yakınlaştırıp kazanan işlemleri ekran görüntüsü almanız yeterlidir. Biz bunu yapmıyoruz.  SMC Intraday Formula bir araçtır. Piyasa yapısını sizin için okur, en yüksek olasılıklı fiyat bölgelerini belirler ve şu anda akıllı paranın izinin nası
    CGE Trading Suite
    Carl Gustav Johan Ekstrom
    5 (2)
    Institutional-Grade Analytics for MT5 C GE Trading Suite delivers the analytical edge typically reserved for professional trading desks. The platform integrates a full suite of analytical tools into one seamless workflow: dynamic grid mapping, liquidity behavior analysis, ECM, trend lines, MIDAS, trade cycles, and directional channel projections. Together, these provide a unified view of market structure and momentum. Directional clarity is further enhanced by the capital flow index, which meas
    Hangi stratejinin sizin sembolunuzde gercekten calistigini gorun - gercek paranizi riske atmadan once. Power Bar, herhangi bir sembol ve herhangi bir zaman diliminde asiri fiyat barlarini tespit eder, ardindan 3 farkli islem stratejisini aninda geriye donuk test eder. Boylece kazanma oranlarini, kar faktorlerini ve P&L'yi yan yana karsilastirabilirsiniz. Tek bir interaktif panelde. Tahmin yok. Esriye uydurma yok. Sadece veri. Power Bar'i benzersiz yapan nedir? Cogu indikator size bir sinyal ver
    Atomic Analyst MT5
    Issam Kassas
    3.94 (31)
    Öncelikle belirtmek gerekir ki bu Ticaret Göstergesi Yeniden Çizim Yapmaz, Gecikmez ve Gecikme Göstermez, bu da hem manuel hem de robot ticareti için ideal hale getirir. Kullanıcı kılavuzu: ayarlar, girişler ve strateji. Atom Analisti, Piyasada Daha İyi Bir Avantaj Bulmak İçin Fiyatın Gücünü ve Momentumunu Kullanan PA Fiyat Hareketi Göstergesidir. Gürültüleri ve Yanlış Sinyalleri Kaldırmaya ve Ticaret Potansiyelini Artırmaya Yardımcı Olan Gelişmiş Filtrelerle Donatılmıştır. Birden fazla katmanl
    Trend Screener Pro MT5
    STE S.S.COMPANY
    4.85 (104)
    Trend Göstergesi, Trend Alım Satım ve Filtreleme için Çığır Açan Benzersiz Çözüm, Tüm Önemli Trend Özellikleriyle Tek Bir Araç İçinde Yerleştirildi! Forex, emtialar, kripto para birimleri, endeksler ve hisse senetleri gibi tüm sembollerde/araçlarda kullanılabilen %100 yeniden boyamayan çoklu zaman çerçevesi ve Çoklu para birimi göstergesidir. Trend Screener, grafikte noktalarla ok trend sinyalleri sağlayan etkili bir trend trend göstergesidir. Trend analizörü göstergesinde bulunan özellikler: 1.
    Meridian Pro
    Ottaviano De Cicco
    5 (1)
    Meridian Pro: Professional Multi-Timeframe Trend Matrix for MT5 Overview Meridian Pro is a multi-timeframe trend matrix by Merkava Labs that compresses directional state, strength, momentum condition and matrix agreement into one compact panel. One adaptive engine, applied consistently from M1 to W1. No per-symbol tuning. No indicator stacking. One structured readout across every asset and every timeframe. Launch Offer — Get Meridian Pro for USD 99 (introductory). Regular price: USD 149. 1. Why
    Btmm state engine pro
    Garry James Goodchild
    5 (4)
    BTMM State Engine Pro is a MetaTrader 5 indicator for traders who use the Beat The Market Maker approach: Asian session context, kill zone timing, level progression, peak formation detection, and a multi-pair scanner from a single chart. It combines cycle state logic with a built-in scanner dashboard so you do not need the same tool on many charts at once. What it does Draws the Asian session range; session times can follow broker server offset or be set in inputs. Tracks level progression (L
    Crystal Heikin Ashi Signals
    Muhammad Jawad Shabir
    5 (2)
    Crystal Heikin Ashi Signals - Professional Trend & Signal Detection Indicator Advanced Heikin Ashi Visualization with Intelligent Signal System for Manual & Automated Trading Final Price: $149 ---------> Price goes up $10 after every 10 sales . Limited slots available — act fast . Overview Crystal Heikin Ashi Signals is a professional-grade MetaTrader 5 indicator that combines pure Heikin Ashi candle visualization with an advanced momentum-shift detection system. Designed for both manual traders
    Smart Stop Indicator – Stop-loss düzeylerini doğrudan grafikte akıllı ve hassas şekilde belirleyin Genel Bakış Smart Stop Indicator, stop-loss seviyesini tahmin ederek veya sezgilere güvenerek değil, net ve sistematik bir şekilde belirlemek isteyen traderlar için özel olarak geliştirilmiştir. Bu araç, klasik price-action mantığını (yükselen tepeler, düşen dipler) modern breakout algılama ile birleştirerek bir sonraki mantıklı stop seviyesini belirler. Trendlerde, yatay piyasalarda veya hızlı k
    Auto Optimized Parabolic RSI: Gelişmiş 3D Momentum Motoru Çoğu perakende indikatörü, piyasa volatilitesi değiştiği an çöken statik girdilere dayandığı için başarısız olur. Auto Optimized Parabolic RSI, kendi matematiksel avantajını sürekli olarak yeniden hesaplayarak "indikatör körelmesi" (indicator decay) sorununu çözer ve kurumsal düzeyde kantitatif adaptasyonu doğrudan MT5 terminalinize getirir. Temel Avantaj: Özel Bellek İçi (In-Memory) 3D Optimizasyon Standart otomatik optimize ediciler, te
    FX Power MT5 NG
    Daniel Stein
    5 (31)
    FX Power: Daha Akıllı Ticaret Kararları için Para Birimlerinin Gücünü Analiz Edin Genel Bakış FX Power , her piyasa koşulunda başlıca para birimlerinin ve altının gerçek gücünü anlamak için vazgeçilmez bir araçtır. Güçlü para birimlerini alıp zayıf olanları satarak, FX Power ticaret kararlarınızı basitleştirir ve yüksek olasılıklı fırsatları ortaya çıkarır. İster trendlere sadık kalın ister Delta'nın aşırı değerlerini kullanarak tersine dönüşleri öngörün, bu araç ticaret tarzınıza mükemmel bir
    Market Structure Order Block Dashboard MT5, piyasa yapısını ve fiyatın ana tepki bölgelerini doğrudan grafik üzerinde okumak isteyen yatırımcılar için tasarlanmış bir MT5 göstergesidir. BOS, ChoCH, Order Blocks, Fair Value Gaps (FVG), Liquidity, Kill Zones, Volume Profile ve hızlı analiz için kompakt bir dashboard yapısını bir araya getirir. Bu gösterge, piyasa yapısını, ICT kavramlarını ve Smart Money kavramlarını karar verme çerçevesi olarak kullanan yatırımcılar için geliştirilmiştir. Trend d
    ARICoins
    Temirlan Kdyrkhan
    ARICoin is a powerful trading companion designed to generate high-probability entry signals with dynamic TP/SL/DP levels based on volatility. Built-in performance tracking shows win/loss stats, PP1/PP2 hits, and success rates all updated live. Key Features: Buy/Sell signals with adaptive volatility bands Real-time TP/SL/DP levels based on ATR Built-in MA Filter with optional ATR/StdDev volatility Performance stats panel (Success, Profit/Loss, PP1/PP2) Alerts via popup, sound, push, or email Cust
    ARIPoint
    Temirlan Kdyrkhan
    ARIPoint is a powerful trading companion designed to generate high-probability entry signals with dynamic TP/SL/DP levels based on volatility. Built-in performance tracking shows win/loss stats, PP1/PP2 hits, and success rates all updated live. Key Features: Buy/Sell signals with adaptive volatility bands Real-time TP/SL/DP levels based on ATR Built-in MA Filter with optional ATR/StdDev volatility Performance stats panel (Success, Profit/Loss, PP1/PP2) Alerts via popup, sound, push, or email Cu
    SignalTech MT5 is a trading system for EURUSD, USDCHF, USDJPY, AUDUSD, NZDUSD, EURJPY, AUDJPY, NZDJPY, CADJPY H2 and H3 Timeframe.  It can generate signals with Buy/Sell Arrows and Pop-Up/Sound Alerts. Each signal has clear Entry and Stop Loss levels, which should be automatically flagged on the chart, as well as potential Targets 1, 2, and 3. The Entry and TP levels are fixed after the trade is taken. The exit level is dynamic. If there are signs of a potential short-term trend reversal, the
    Meravith Scanner
    Ivan Stefanov
    5 (1)
    MERAVITH SCANNER, MetaTrader 5 için profesyonel bir finansal piyasa göstergesidir ve birden fazla analiz aracını tek bir entegre sistemde birleştirir. Tüm hesaplamaları, özel hacim ağırlıklı ortalama fiyat (VWAP) metodolojisini kullanarak otomatik olarak gerçekleştirir ve subjektif yorumları tamamen ortadan kaldırır. Bu gösterge, tüm varlık sınıflarında (Forex, Hisseler, Endeksler, Emtialar, Kripto Paralar) ve M1’den Aylık’a kadar tüm zaman dilimlerinde çalışır. Temel prensip, fiyatın hacmi taki
    Blahtech Supply Demand MT5
    Blahtech Limited
    4.54 (13)
    Was: $299  Now: $99  Supply Demand uses previous price action to identify potential imbalances between buyers and sellers. The key is to identify the better odds zones, not just the untouched ones. Blahtech Supply Demand indicator delivers functionality previously unavailable on any trading platform. This 4-in-1 indicator not only highlights the higher probability zones using a multi-criteria strength engine, but also combines it with multi-timeframe trend analysis, previously confirmed swings a
    Master Edition, piyasa yapısını hacim ve para akışı merceğinden görselleştirmek için tasarlanmış profesyonel kalitede bir analiz aracıdır. Standart hacim göstergelerinin aksine, bu araç doğrudan grafiğinizde bir Günlük Hacim Profili görüntüleyerek, fiyat keşfinin tam olarak nerede gerçekleştiğini ve "akıllı paranın" nerede konumlandığını görmenizi sağlar. Bu Master Edition, netlik ve hız için tasarlanmıştır ve yüklendiğinde grafik düzeninizi anında güzelleştiren benzersiz bir Otomatik Tema Senkr
    Yazarın diğer ürünleri
    Fakeouts
    TECHAURORA - FZCO
    Advanced Fakeout Detection Indicator   Professional Liquidity Sweep & Market Structure Analysis for MetaTrader 5 The Advanced Fakeout Detection Indicator is a sophisticated technical analysis tool designed to identify high-probability market reversal opportunities by detecting liquidity sweeps and structural breaks in price action. What This Indicator Does This indicator automatically identifies and visualizes potential fakeout scenarios where price temporarily breaks through significant level
    The Candle Smoother is an indicator for MetaTrader 5 that helps you see price movements more calmly and clearly. It removes unnecessary "market noise" and displays the true trend more effectively. What does the "Candle Smoother Indicator" do? It smooths the classic candlestick data (Open, High, Low, Close). This filters out chaotic, hectic candles. Additionally, an EMA line (Exponential Moving Average) is calculated based on the smoothed prices. This helps you better recognize where the market
    FREE
    Let us introduce the Heikin Ashi RSI Oscillator! This indicator combines the concepts of Heikin Ashi candles with the RSI (Relative Strength Index) to produce an oscillator-like format that can be used to filter out some of the noise associated with standard RSI readings. This provides traders with a smoother representation of market conditions. Here are some articles to read more about the RSI and Heikin Ashi candles: https://www.investopedia.com/terms/r/rsi.asp https://www.investopedia.com/ter
    ApexVol Grid EA
    TECHAURORA - FZCO
    5 (1)
    ATTENTION This is NOT a normal Grid / Martingale EA. Here are the setfiles: https://mega.nz/folder/fQF0hbRR#oIvhJcOVZXGRZMLYHr9_vw ApexVol Grid EA is a fully automated trading algorithm for MetaTrader 5. It is built on a volatility-filtered grid trading system and operates using dynamic moving average channels. The EA is designed to detect optimal entry zones during stable market conditions and execute trades in both directions based on predefined grid levels. The first 5 copies are availa
    Multi-Indicator Trend Engine with Weighted Consensus Five professional trend indicators fused into one signal. Configurable weighting. Three aggregation modes. One regime per bar. The Aurora Trend Suite combines five independent trend-detection methods into a single, unified directional engine. Instead of cluttering your chart with five separate indicators that constantly disagree with each other, the Suite votes them into one clean regime — so you always know exactly where the consensus stands
    Filtrele:
    Değerlendirme yok
    Değerlendirmeye yanıt