Combo OsMA
- Göstergeler
-
Illia Zhavarankau
 I program in MQL4 trading robots. I am looking for interesting people who are interested in this direction.
I run my blog https://botrader.org. - Sürüm: 1.0
- Etkinleştirmeler: 5
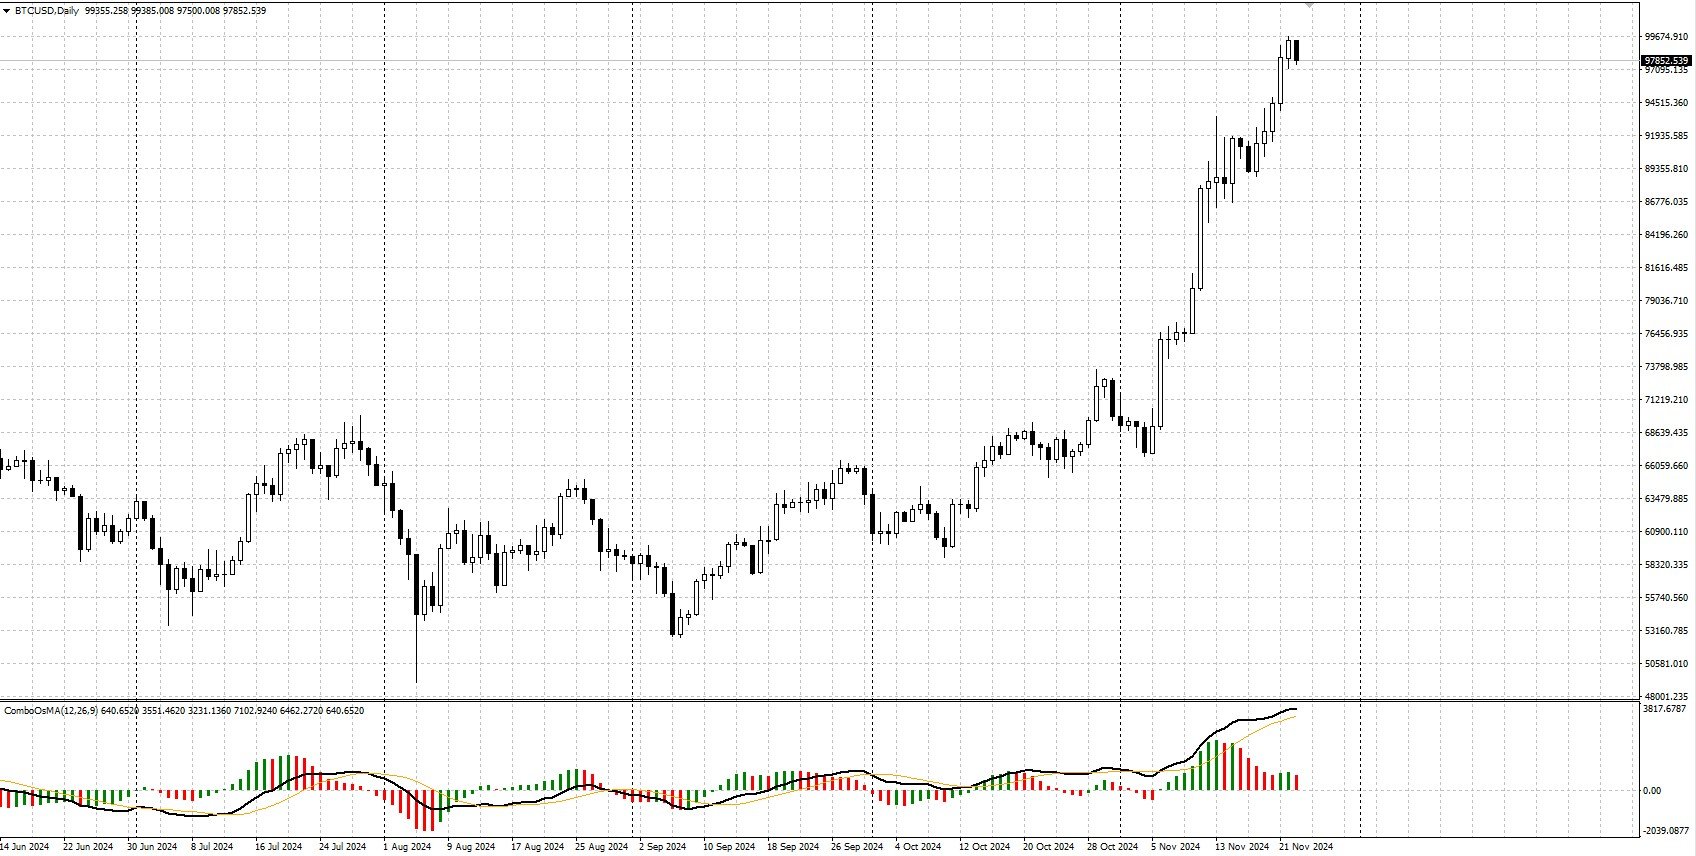
This indicator combines two tools: MACD and OsMA.
-
MACD is displayed as two lines:
- The black line represents the main MACD line.
- The orange line represents the MACD signal line.
-
OsMA Histogram is shown in two colors:
- Green bars indicate growth.
- Red bars indicate decline.
You can customize the line colors and thickness in the settings.
This indicator serves as an addition to the Combo View Impulse System indicator but can also be used independently.
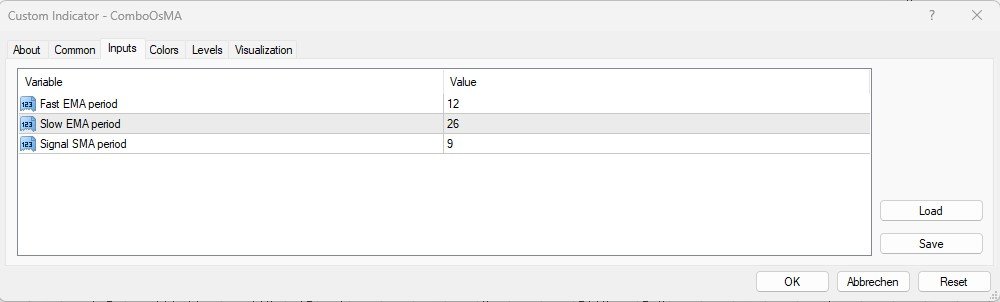
Parameters:
- Fast EMA period (12) – The short EMA for the MACD calculation;
- Slow EMA period (26) – The long EMA for the MACD calculation;
- Signal SMA period (9) – The smoothing value for the Signal line;