Volume Break Oscillator
- Göstergeler
- Sürüm: 1.1
- Güncellendi: 19 Temmuz 2024
- Etkinleştirmeler: 10

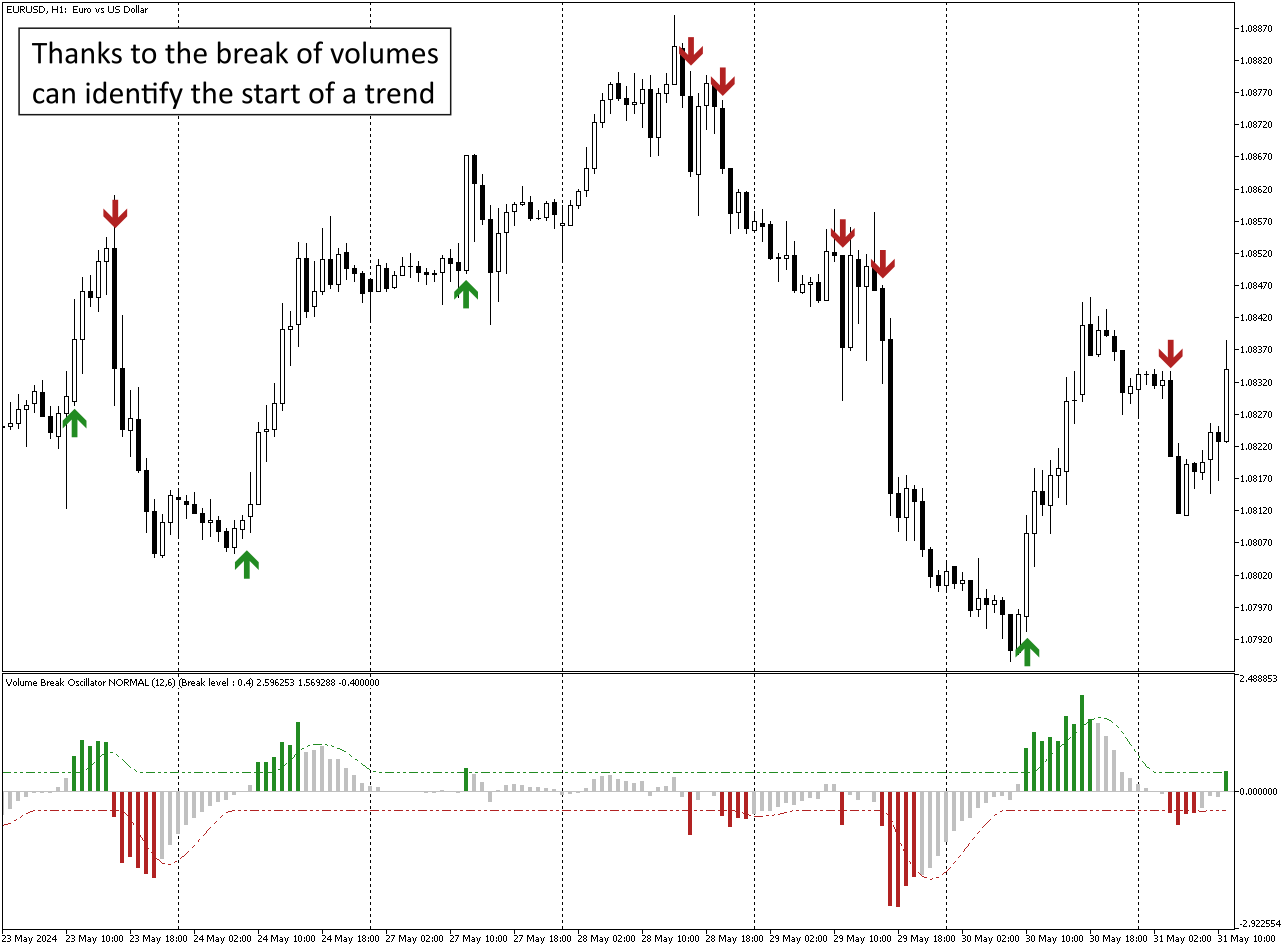
Volume Break Oscillator, fiyat hareketini osilatör biçiminde hacim trendleriyle eşleştiren bir göstergedir.
Stratejilerime hacim analizini entegre etmek istedim ancak OBV, Money Flow Index, A/D ve ayrıca Volume Weighted Macd ve diğerleri gibi çoğu hacim göstergesinden her zaman hayal kırıklığına uğradım.
Bu nedenle bu göstergeyi kendim için yazdım, ne kadar kullanışlı olduğundan memnunum ve bu nedenle piyasada yayınlamaya karar verdim.
Başlıca özellikleri:
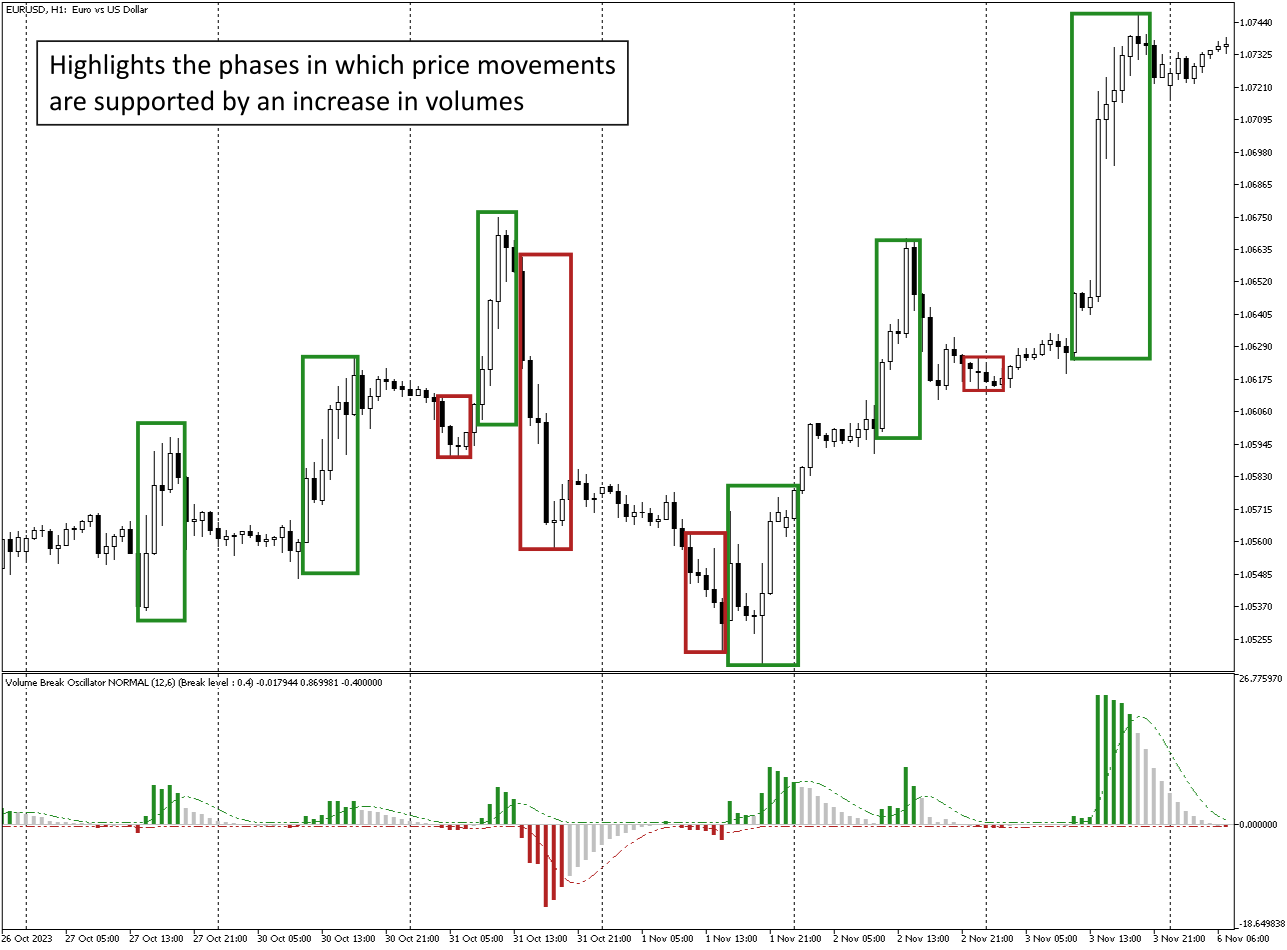
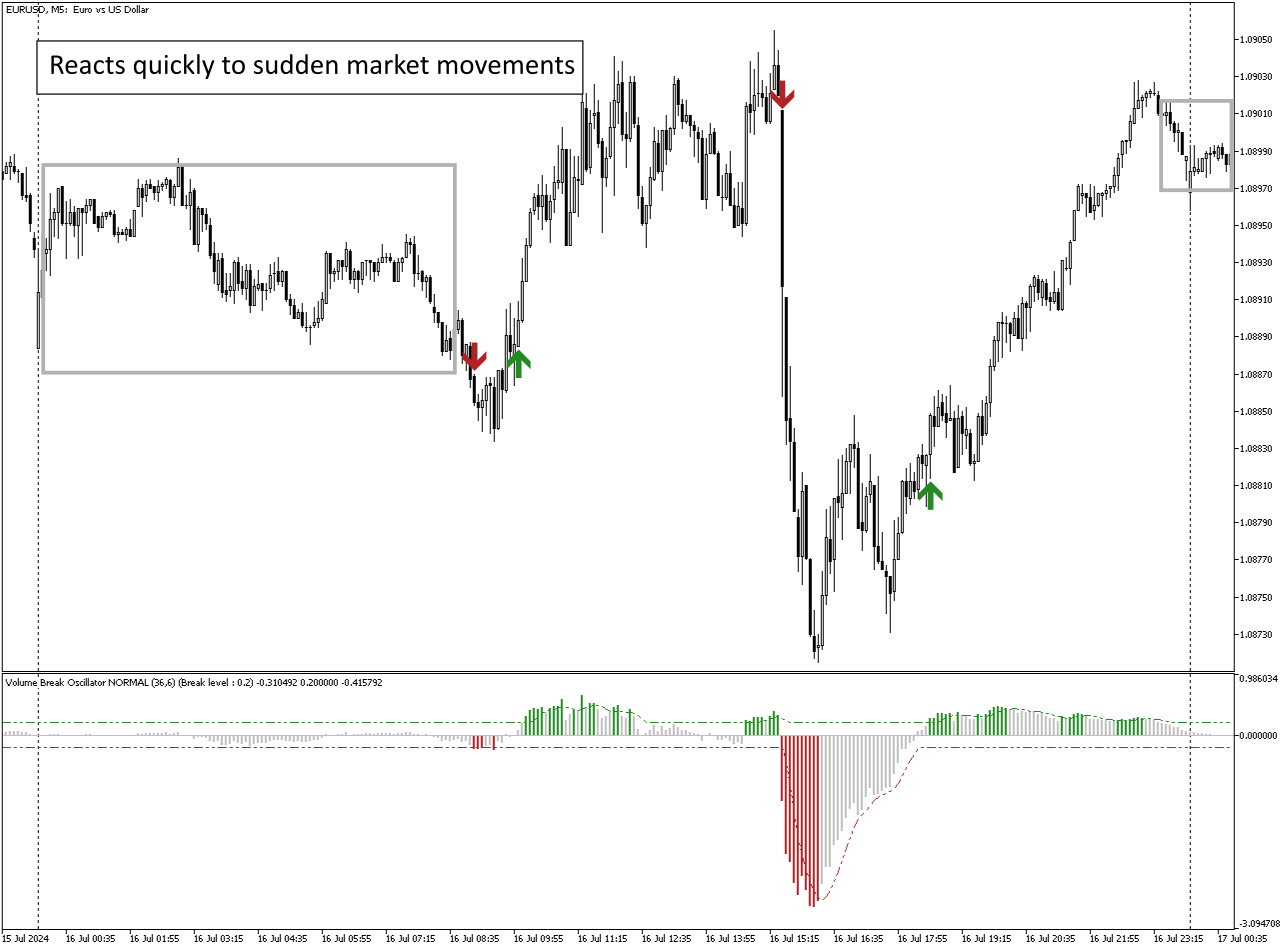
Fiyatın hacimlerdeki bir artış (kırılma) tarafından desteklenen bir yönde hareket ettiği aşamaları vurgular.
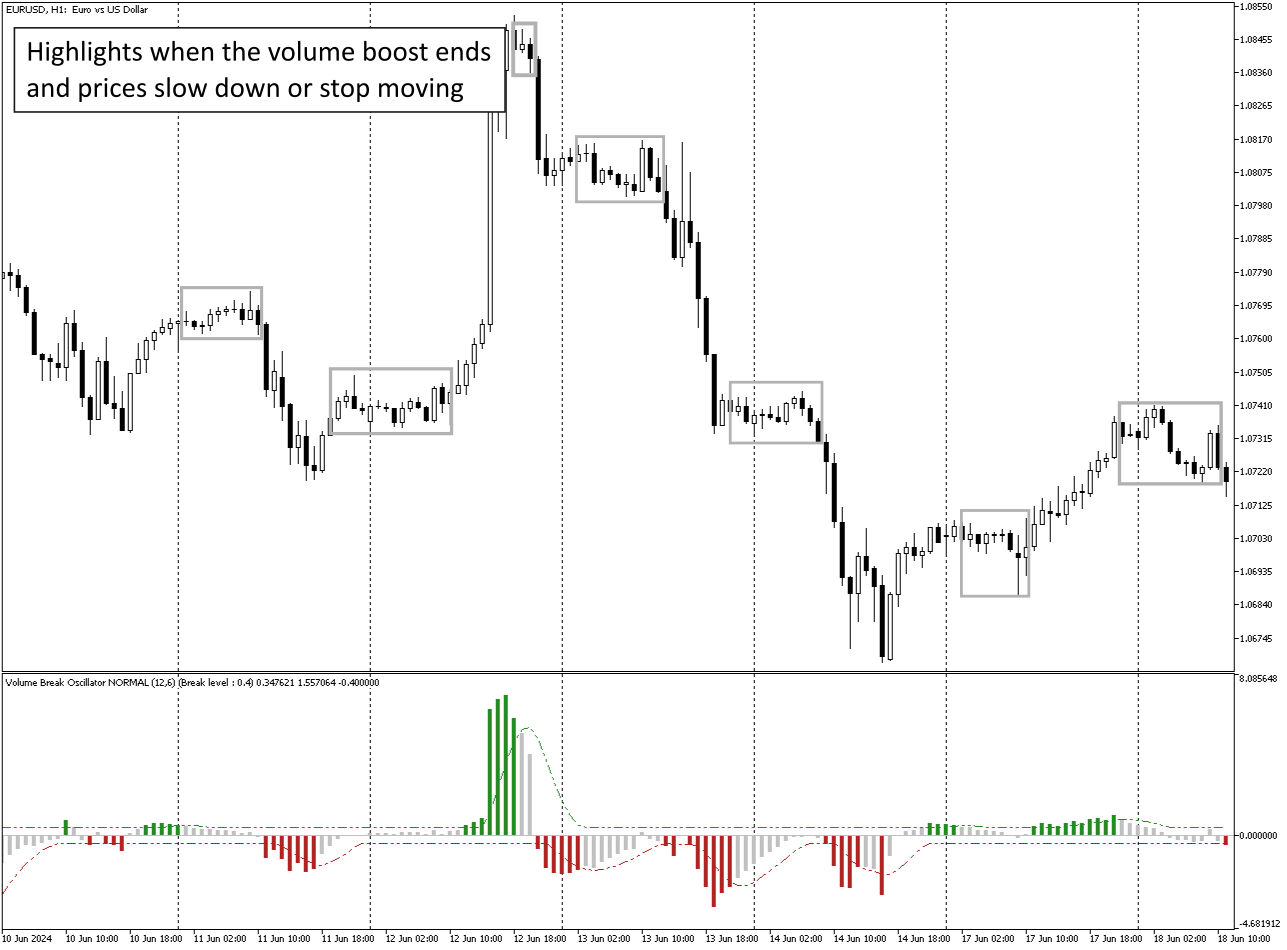
Hacim artışının durduğu ve dolayısıyla piyasanın daraldığı aşamaları vurgular.
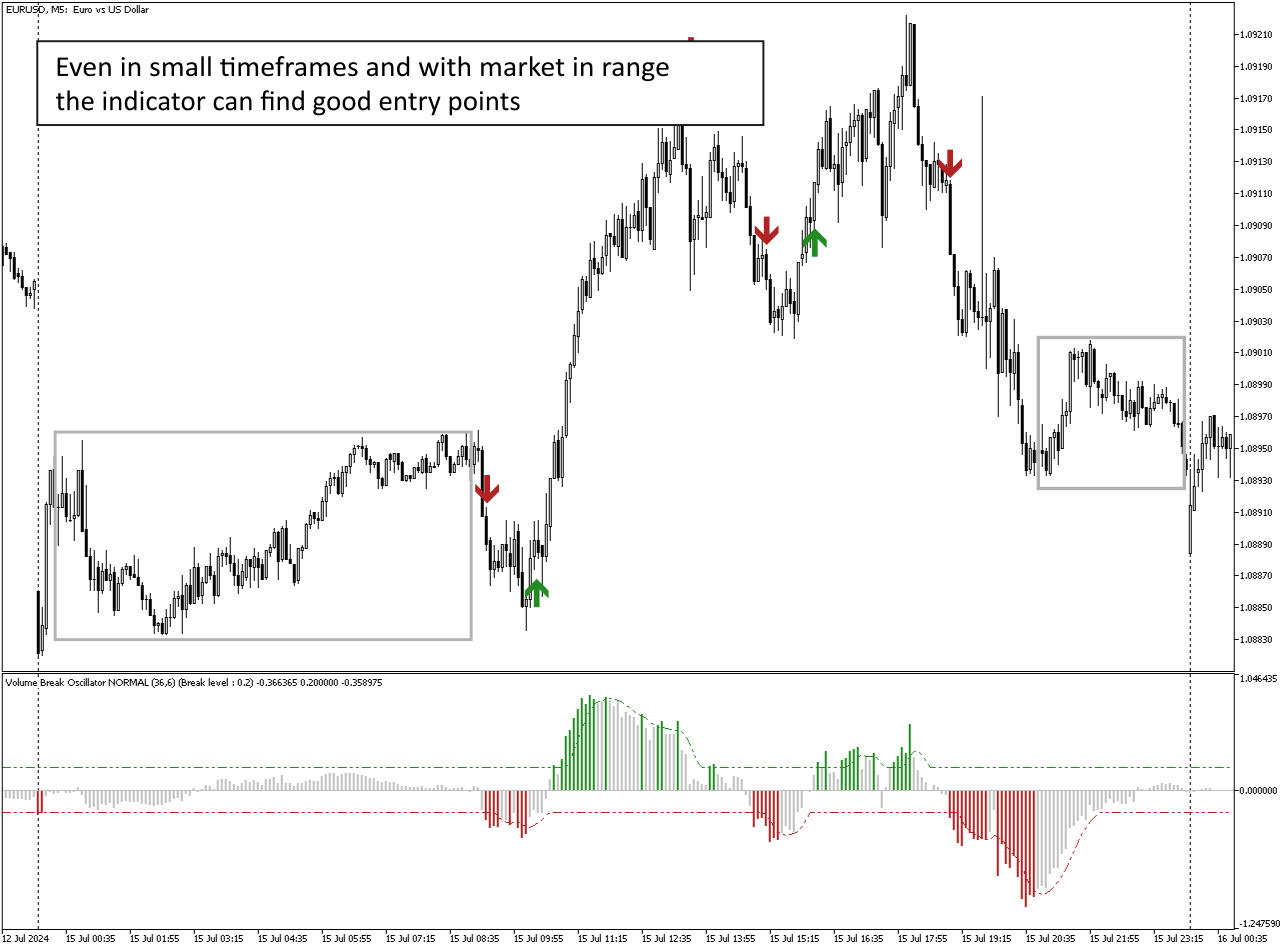
Özellikle zaman dilimleri (<=15 dakika) olan günlük işlemde ne fiyatların ne de hacimlerin hareket etmediği ve böylece piyasanın gelecekteki bir koşuya hazır olduğu aşamaları vurgular. Hacim artışıyla desteklenmediklerinde diğer Uzman Danışmanlardan gelen yanlış sinyalleri filtreler.
Trend ve aralık aşamalarını görselleştirmeyi çok kolaylaştırır
Giriş parametreleri:
Hesaplama ayarları:
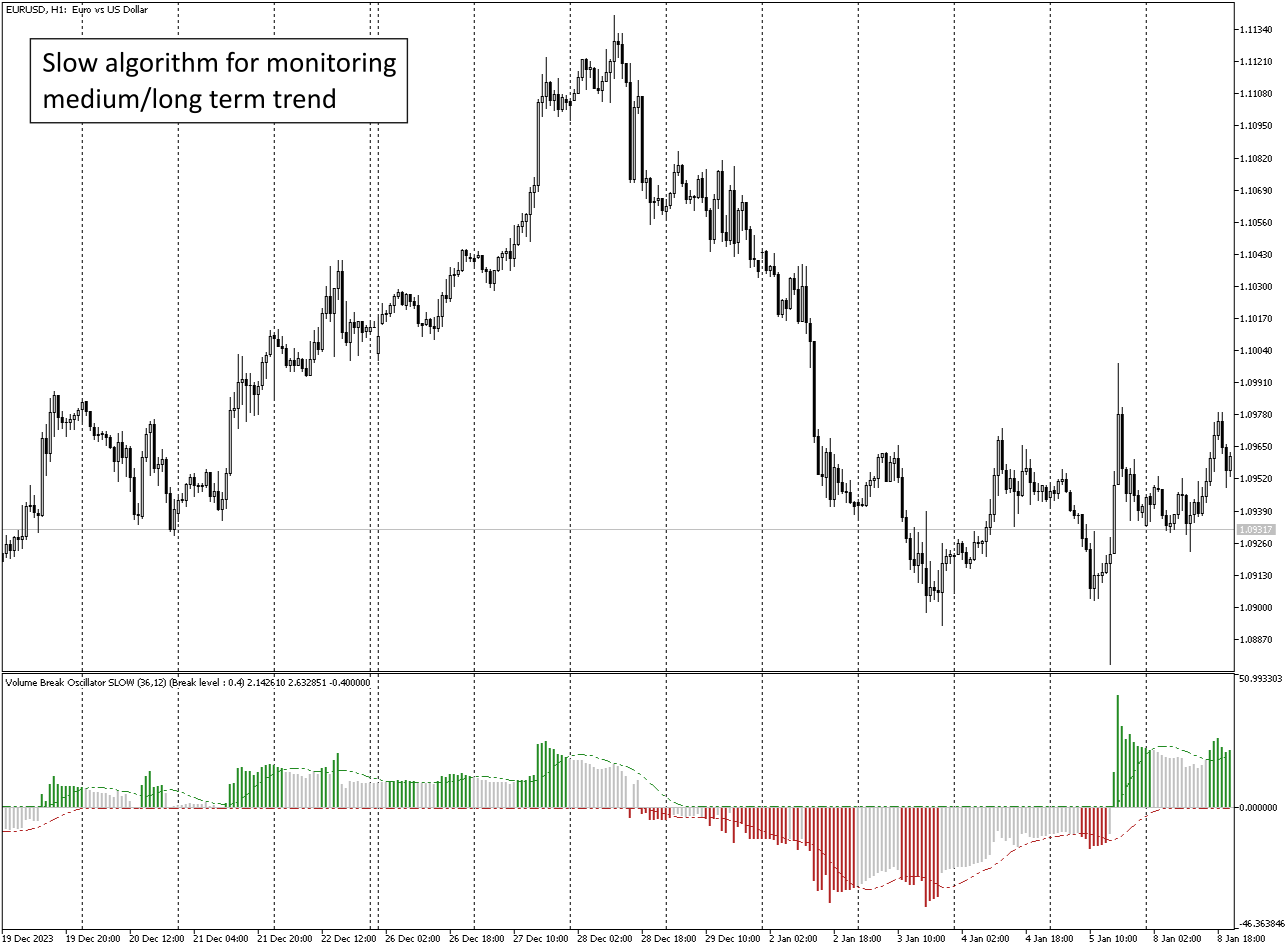
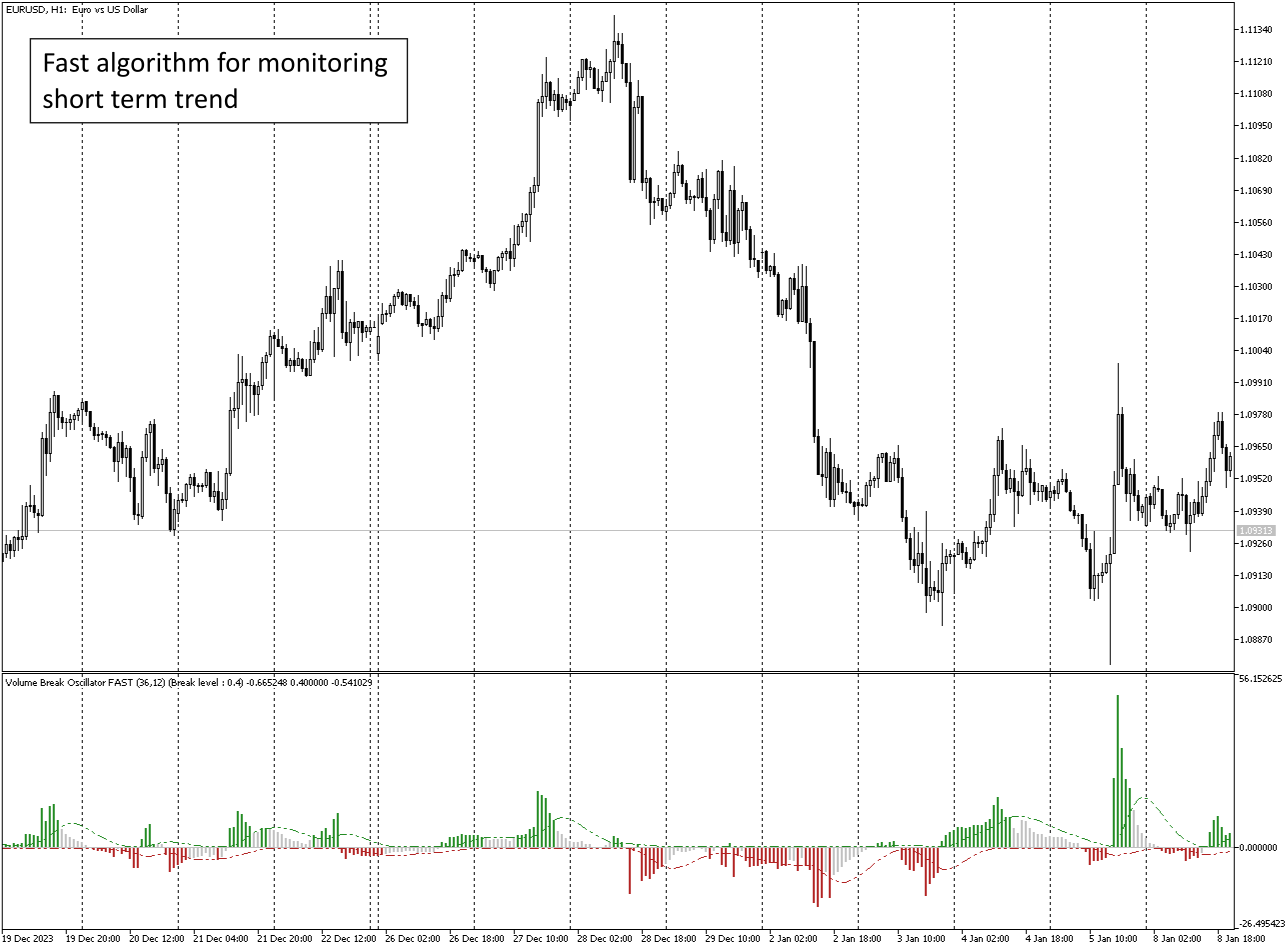
Hesaplama Türü: HIZLI, NORMAL, YAVAŞ, aynı zaman diliminde kalarak kısa, orta ve uzun vadeli izleme.
Hesaplama Dönemi: Hesaplama Dönemi
Hacim Ayarları:
Hacim Türü:TickVolume (çoğunlukla Forex için) ve RealVolume (hisse senedi piyasası için)
Sinyal Ayarları:
Sinyal Dönemi: Sinyal Çizgisi Dönemi
Kırılma Seviyesi: Kırılma sinyali için eşik seviyesi
Uyarı ayarları
Uyarı Türü: Kapanış çubuğunda veya Anında
Uyarı
Posta
Bildirimi
EA'da geri çağrılacak tampon numarası:
0 - Histogram
1 - Kırılma Çizgisi Yukarı
2 - Kırılma Çizgisi Aşağı
Herkese mutlu ticaretler!

Works super accurate , author very responsive , highly recommend it