Volume Break Oscillator
- Indicatori
- Versione: 1.1
- Aggiornato: 19 luglio 2024
- Attivazioni: 10

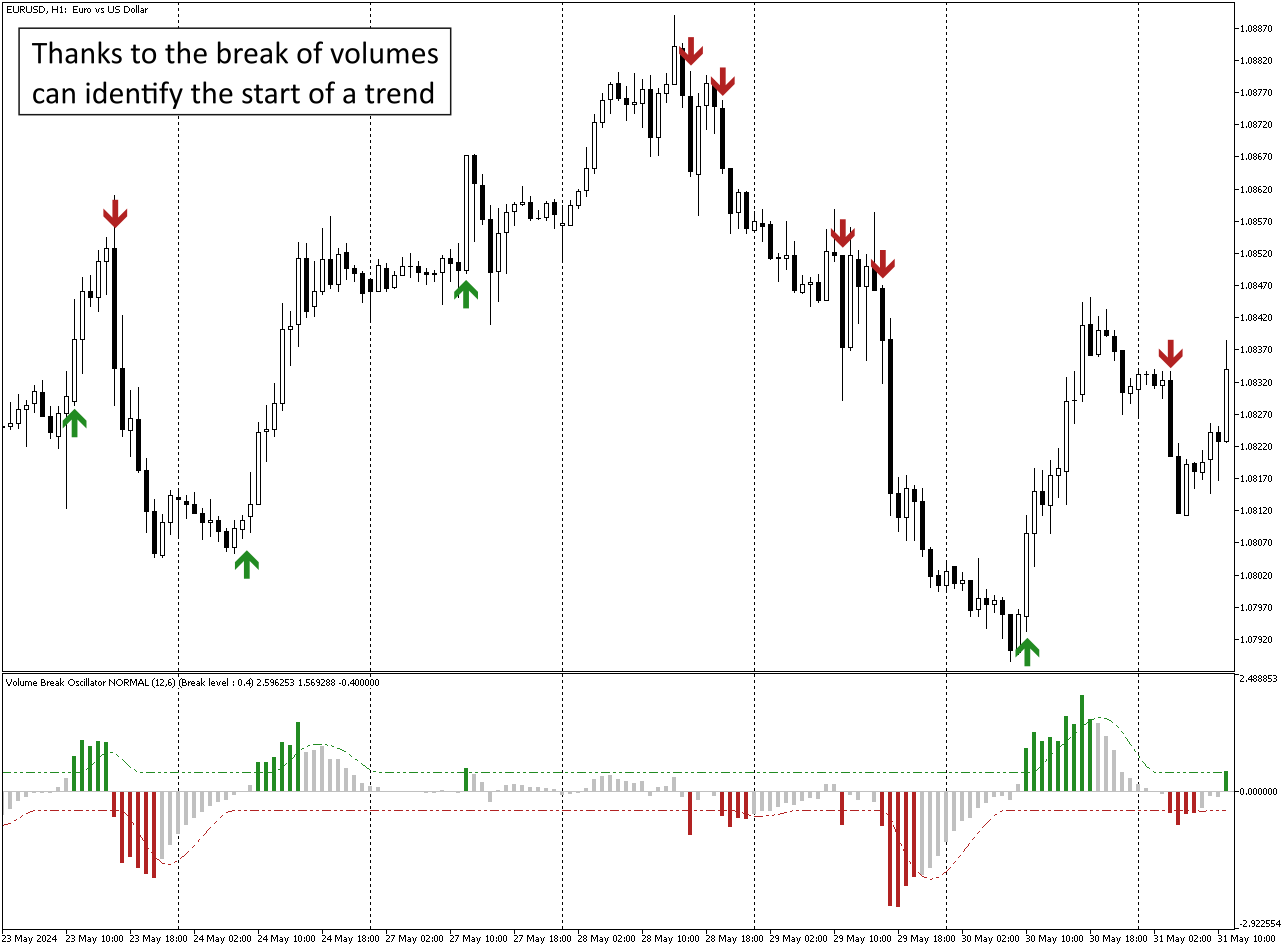
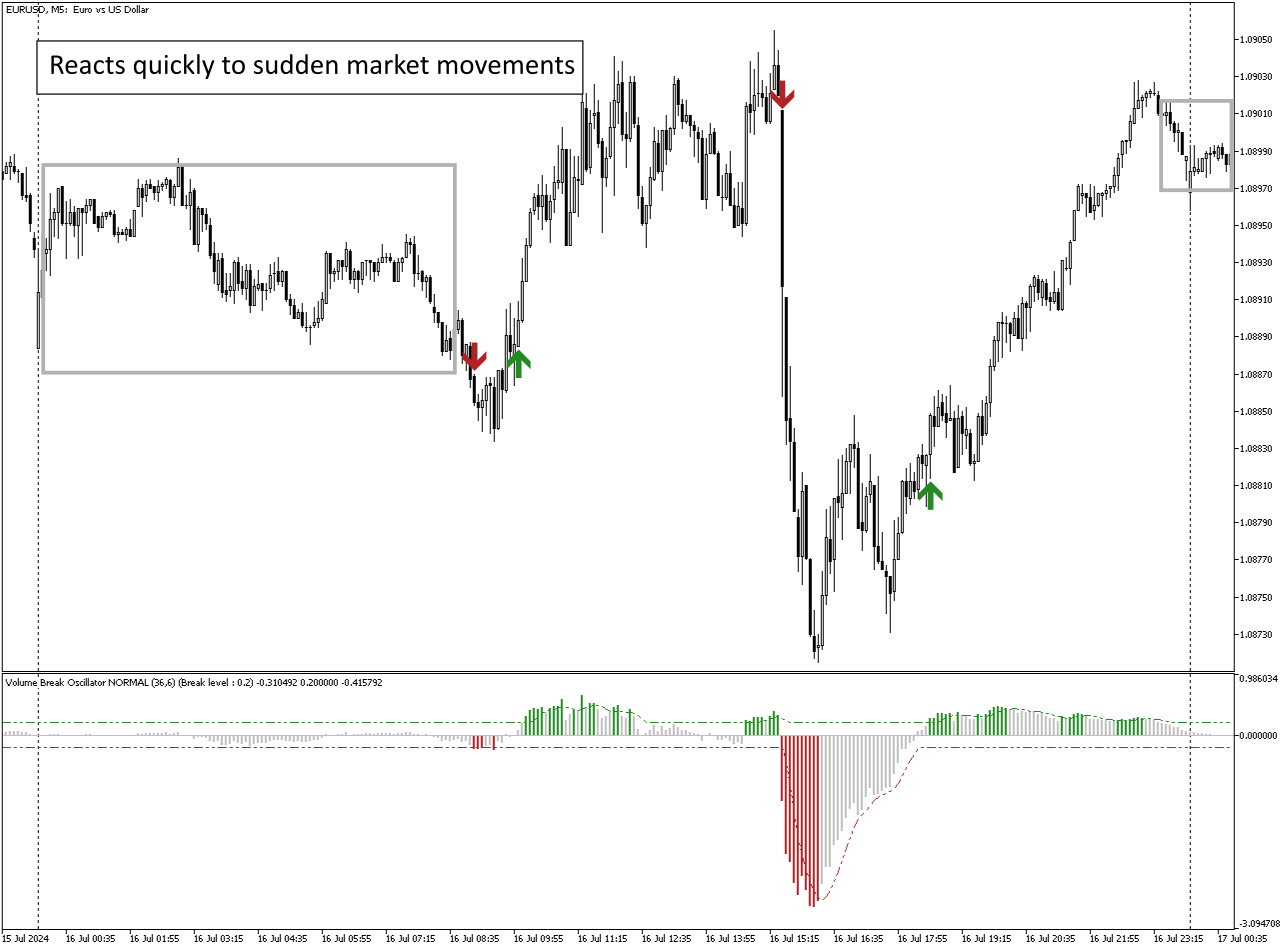
Volume Break Oscillator è un indicatore che abbina il movimento dei prezzi con le tendenze del volume sotto forma di oscillatore.
Volevo integrare l'analisi del volume nelle mie strategie, ma sono sempre stato deluso dalla maggior parte degli indicatori di volume,
come OBV, Money Flow Index, A/D ma anche come Volume Weighted Macd e molti altri.
Ho quindi scritto questo indicatore per me stesso, sono soddisfatto di quanto sia utile e quindi ho deciso di pubblicarlo sul mercato.
Caratteristiche principali:
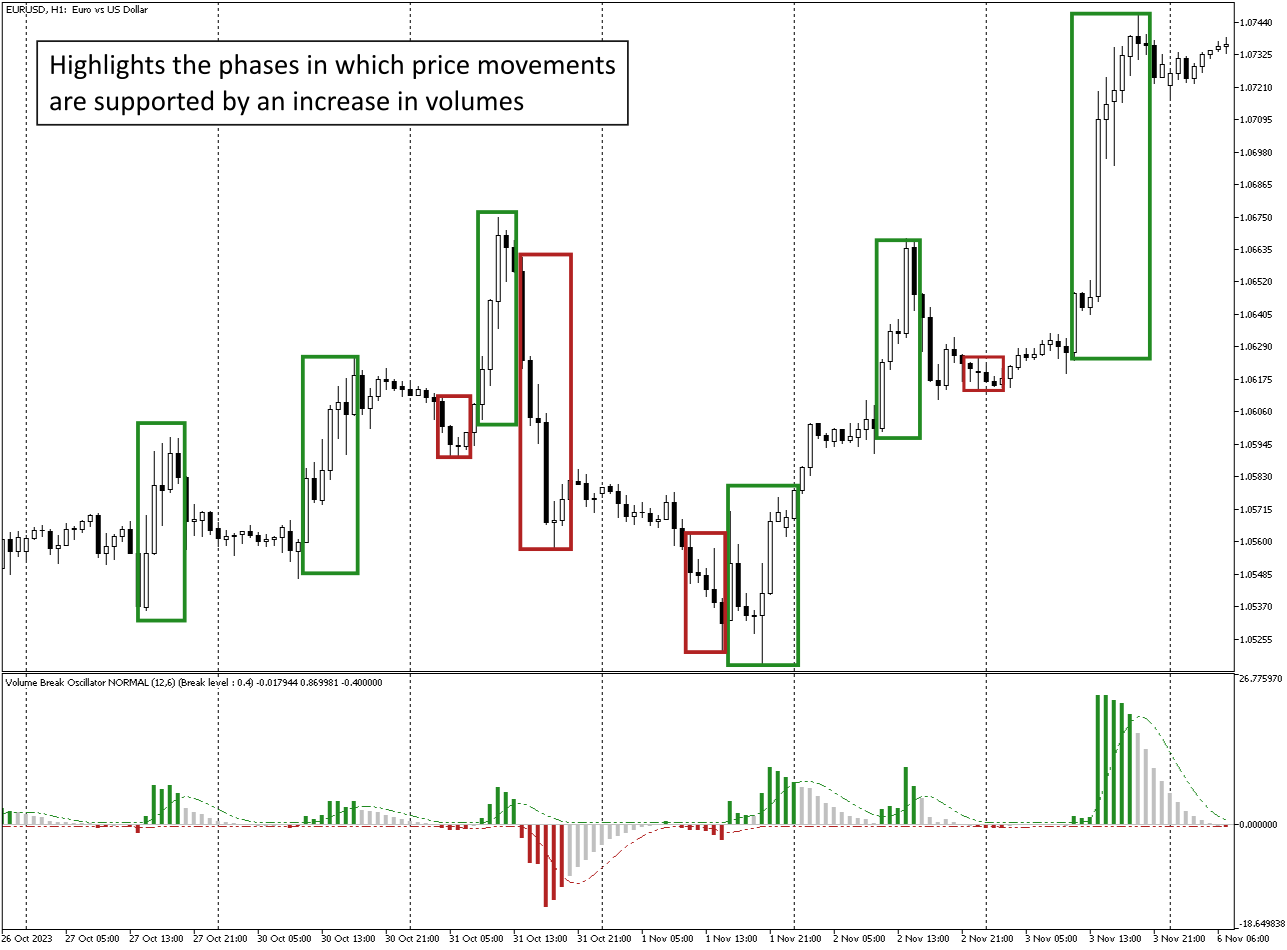
Evidenzia le fasi in cui il prezzo si muove in una direzione supportata da un aumento (break) dei volumi.
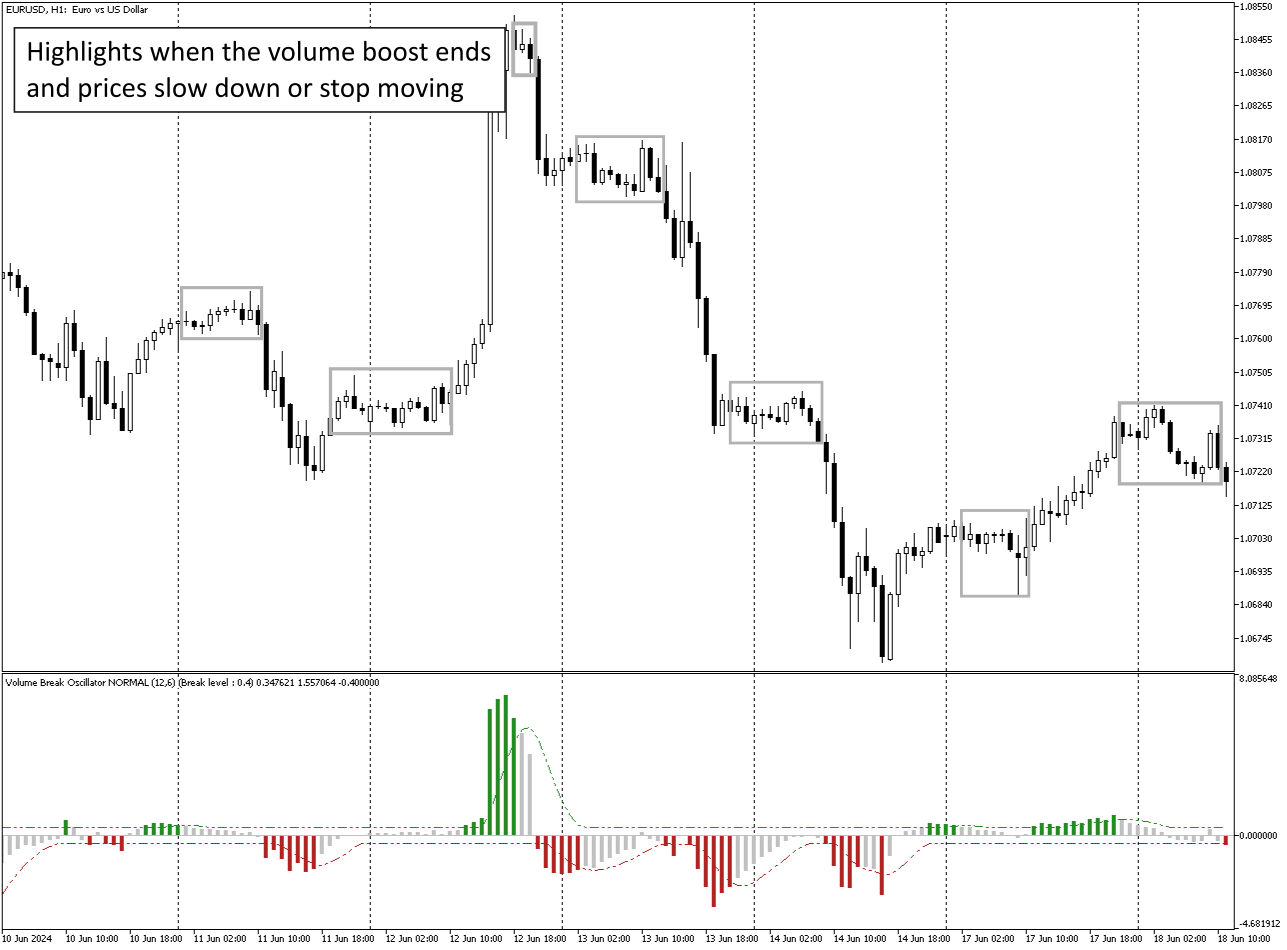
Evidenzia le fasi in cui l'aumento del volume si ferma e quindi il mercato si contrae.
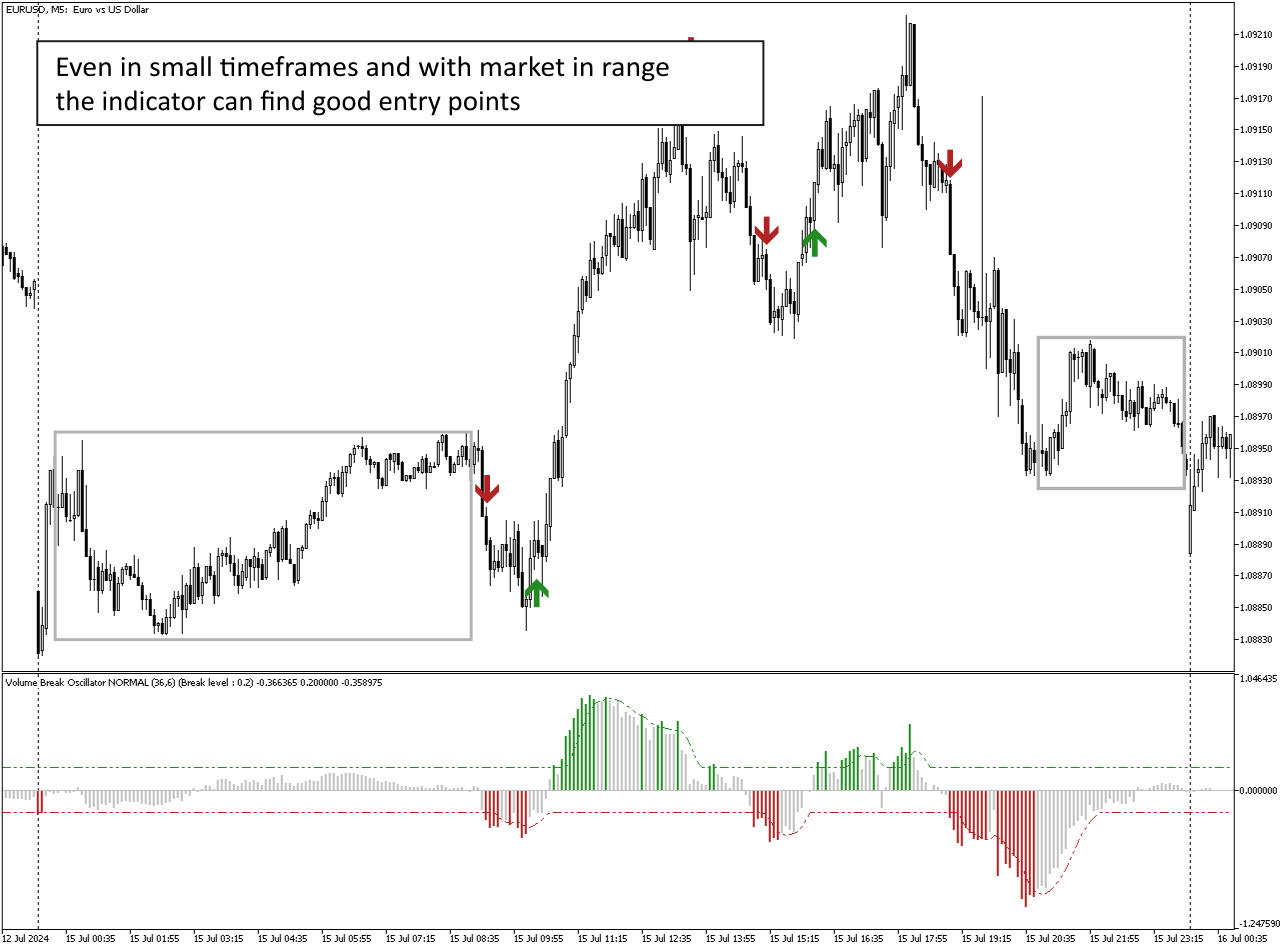
Evidenzia le fasi in cui, soprattutto nel trading intraday con timeframe (<=15 minuti), né i prezzi né i volumi si muovono, quindi il mercato è pronto per una corsa futura. Filtra i falsi segnali da altri Expert Advisor quando non sono supportati da un aumento dei volumi.
Rende molto facile visualizzare le fasi di trend e range
Parametri di input:
Impostazioni di calcolo:
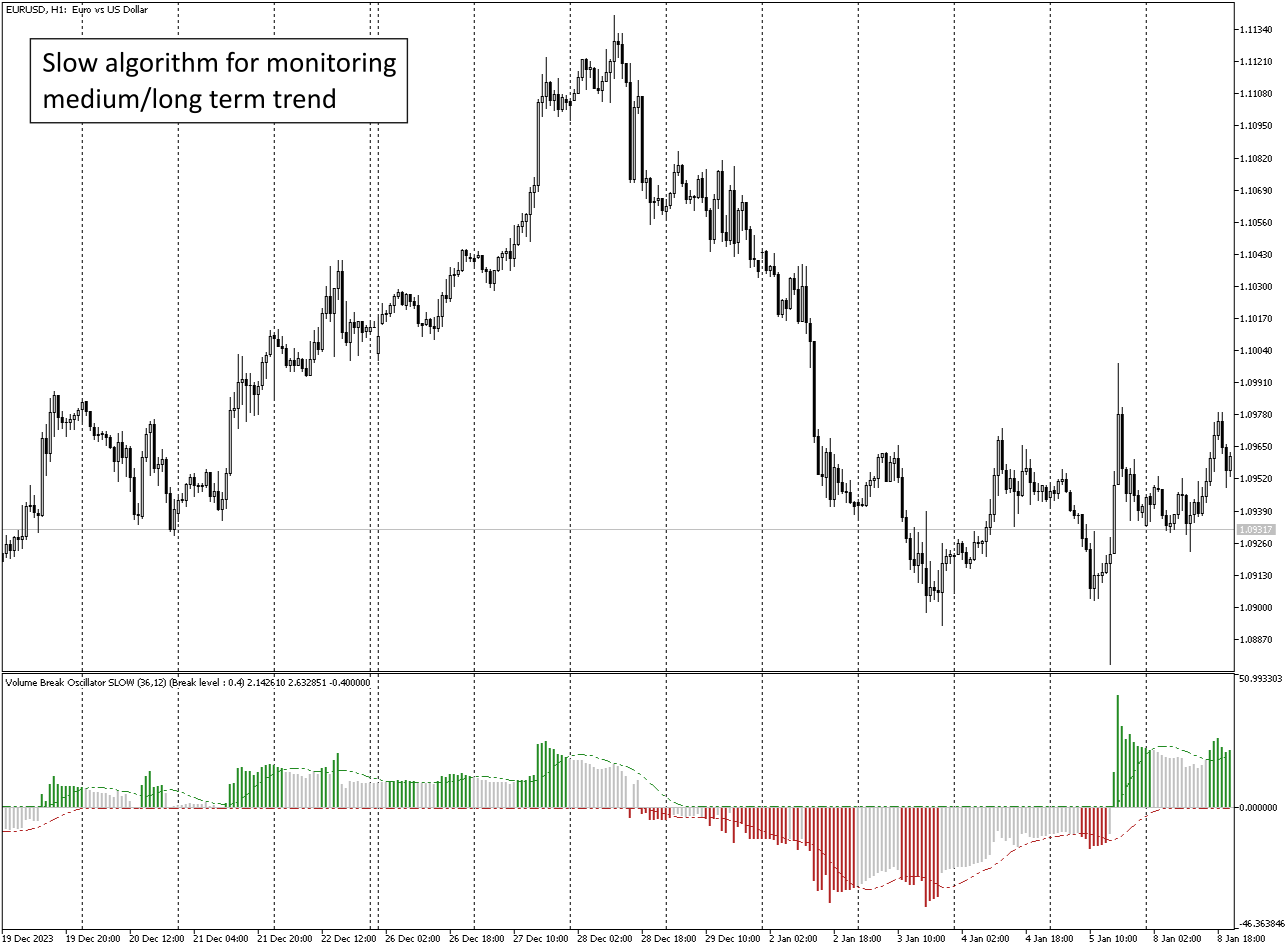
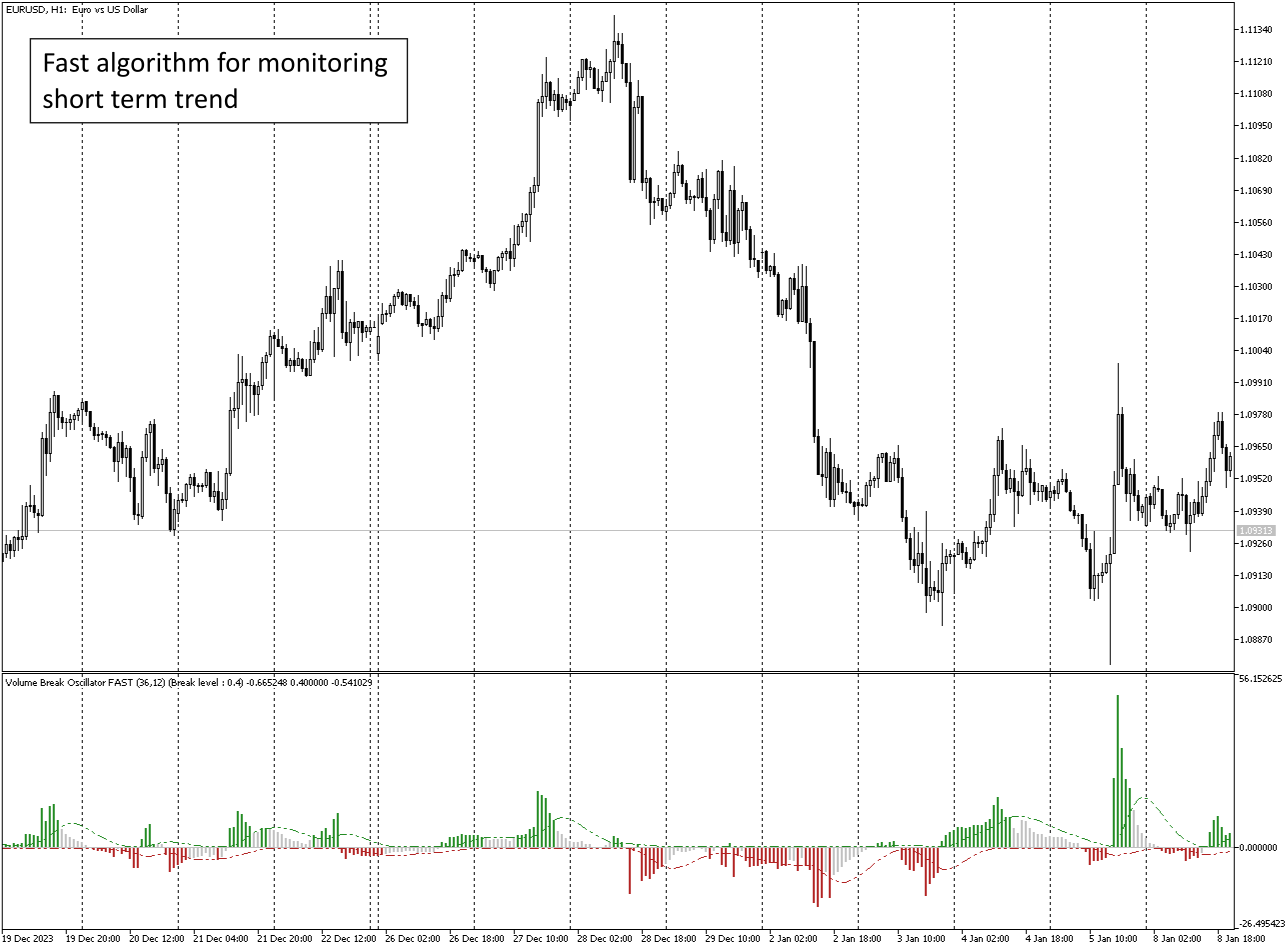
Tipo di calcolo: VELOCE, NORMALE, LENTO, per monitorare il breve, medio e lungo termine, rimanendo nello stesso intervallo di tempo.
Periodo di calcolo: Periodo di calcolo
Impostazioni volume:
Tipo di volume: TickVolume (principalmente per Forex) e RealVolume (per il mercato azionario)
Impostazioni segnale:
Periodo segnale: Periodo della linea di segnale
Livello di interruzione: Livello di soglia per il segnale di breakout
Impostazioni avviso
Tipo di avviso: Alla barra di chiusura o istantaneo
Avviso
Posta
Notifica
Numero di buffer da richiamare nell'EA:
0 - Istogramma
1 -Signal line verso l'alto
2 - Signal line verso il basso
Buon trading a tutti!

Works super accurate , author very responsive , highly recommend it