VIDYA Enhanced

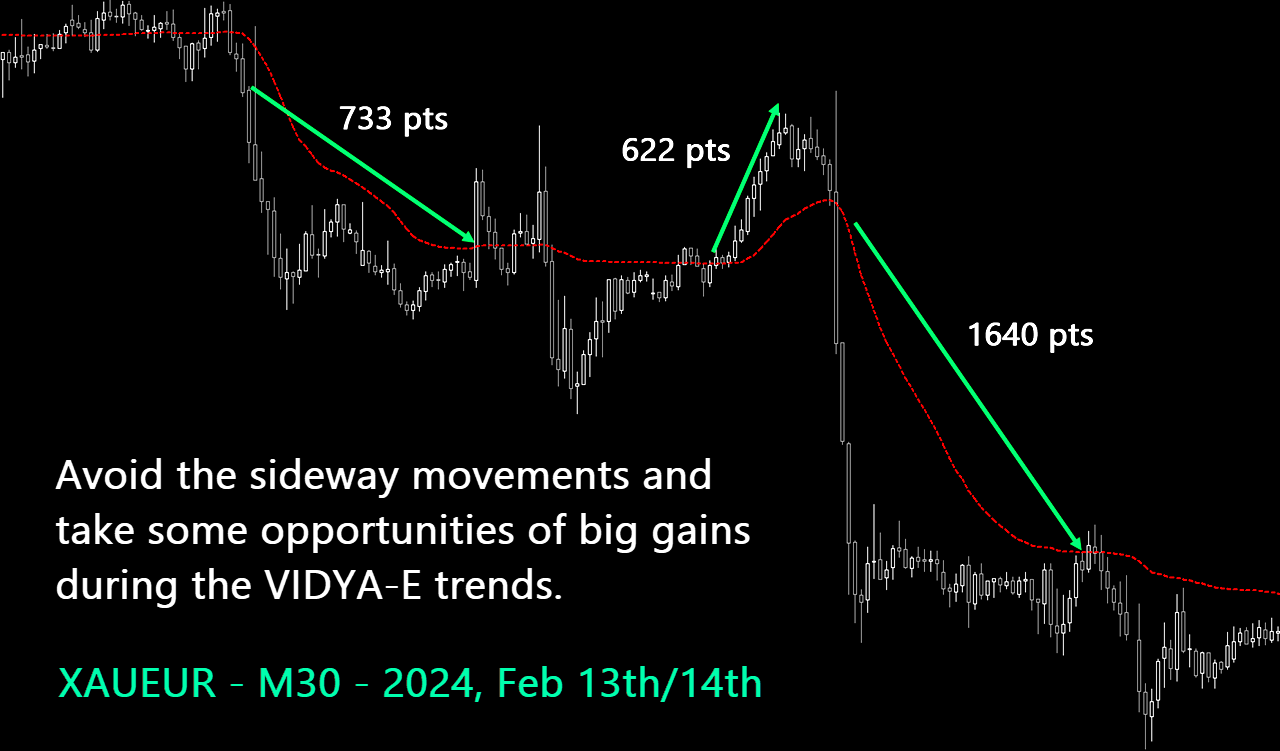
VIDYA-ENHANCED göstergesi (Değişken Endeks Dinamik Ortalama) trendleri ve yatay hareketleri belirlemek için kullanılan bir teknik analiz aracıdır.

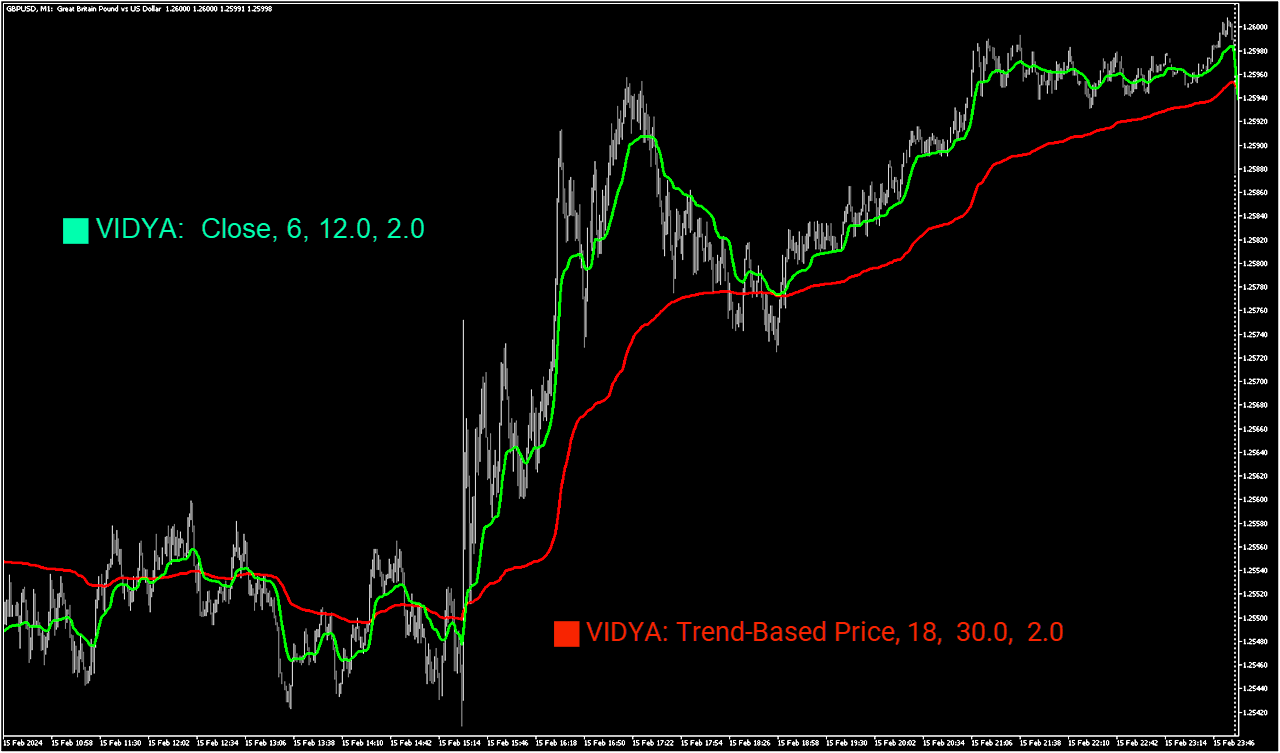
Chande Momentum Osilatörünü bir volatilite endeksi olarak kullanarak hassasiyetini piyasa volatilitesine göre dinamik olarak ayarlar. Bu özellik, VIDYA-ENHANCED'in önemli fiyat hareketleri dönemlerinde daha çevik olmasını sağlarken, daha az değişken aşamalarda daha istikrarlı kalmasını sağlar. 
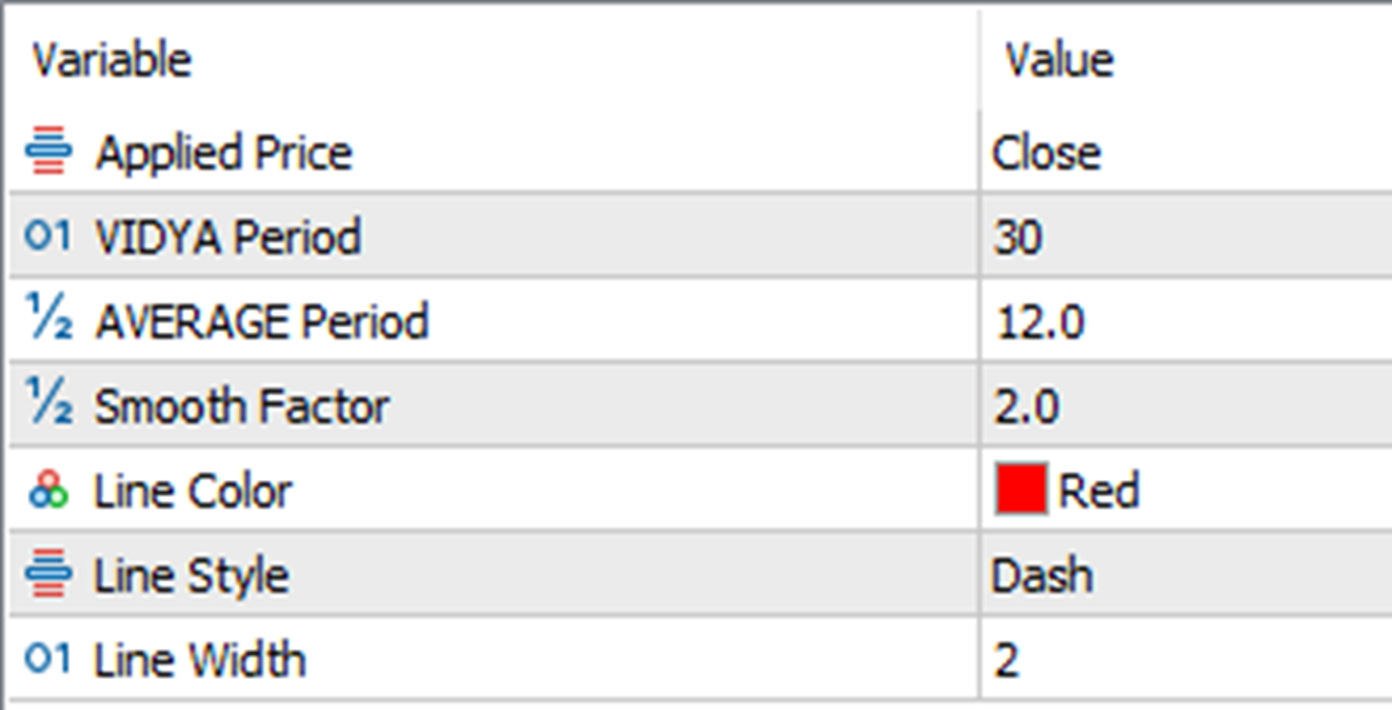
Özellikler:

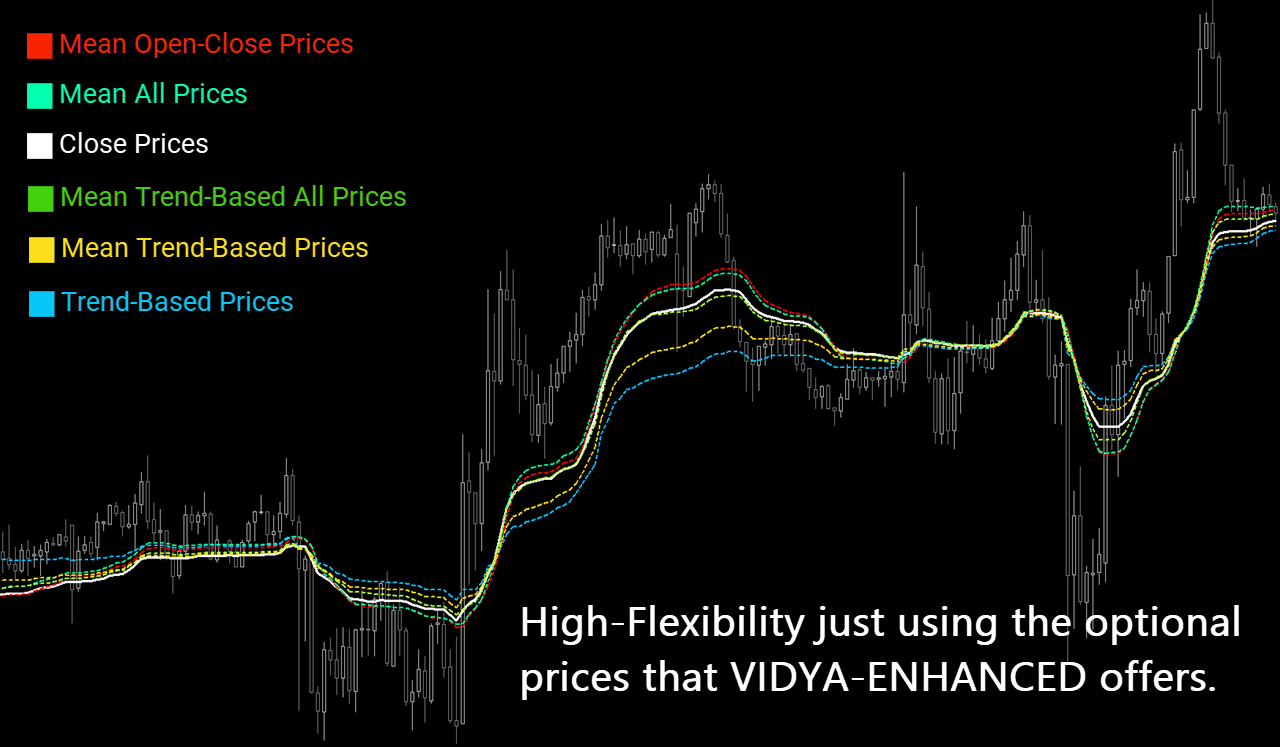
- Fiyatı 12 seçenek arasından seçin - Metatrader standardından 5 daha fazla!
- VIDYA ve EMA dönemlerini seçin.
- VIDYA çizgisinin rengini, türünü ve genişliğini değiştirin.
Önerilen ürünler
I recommend you to read the  product's blog  (manual) from start to end so that it is clear from the beginning what the indicator offers. This multi time frame and multi symbol supply and demand zone dashboard indicator sends alerts when the price has reached a supply/demand zone. It is also possible to use it to be alerted about regular double tops/bottoms instead of zones. It can be used with all time frames from M1 to MN. Maximum 9 time frames can be shown in the dashboard at the same time. 
If you are unsure how to use this indicator, please feel free to reach out to me. I will explain it to you and provide reading materials to help you make the most of it. TD Sequential Scanner: An Overview The TD Sequential scanner is a powerful technical analysis tool designed to identify potential price exhaustion points and trend reversals in financial markets. Developed by Tom DeMark, this method is widely used by traders to gauge market cycles and potential turning points with precision. Ho
Teklif Fiyatı Zamanlayıcı Göstergesi — Hassas Zamanlama ve Akıllı Fiyat Takibi! Teklif Fiyatı Zamanlayıcı Göstergesi ile işlem hassasiyetinizi bir üst seviyeye taşıyın — her hareketinde zamanlamayı, hassasiyeti ve netliği önemseyen trader’lar için tasarlanmış güçlü bir araç. Öne Çıkan Özellikler: Sabit Zamanlayıcı Ekranı – Grafiğinizin sağ tarafında her zaman görünür (özelleştirilebilir X_Offset). Dinamik Fiyat Takibi – Zamanlayıcı, teklif fiyatını gerçek zamanlı olarak takip e
Bu gösterge, pratik ticaret için mükemmel olan otomatik dalga analizine yönelik bir göstergedir! Dava... Not:   Dalga sınıflandırması için Batılı isimleri kullanmaya alışkın değilim. Tang Lun'un (Tang Zhong Shuo Zen) adlandırma kuralının etkisiyle, temel dalgayı   kalem   , ikincil dalga bandını ise   segment   olarak adlandırdım. aynı zamanda segmentin trend yönü vardır. Adlandırma   esas olarak trend segmentidir   (bu adlandırma yöntemi gelecekteki notlarda kullanılacaktır, öncelikle söyleyey
Introducing RSIScalperPro - the revolutionary RSI-based indicator for Metatrader 5, specifically designed for scalping in the one-minute chart. With RSIScalperPro, you'll have a powerful toolkit for precise entry and exit signals to take your trading to the next level. RSIScalperPro utilizes two different RSI indicators that provide clear signals for overbought and oversold areas. You can customize the time periods and limit values of the two RSIs according to your preferences to achieve the be
Optimized Spike Detector Pro for MT5 is a professional-grade technical indicator designed to identify and capitalize on sharp, impulsive price movements (spikes) in any financial instrument. Utilizing a sophisticated, multi-algorithmic core, it distinguishes significant volatility expansions from market noise with exceptional accuracy. The tool dynamically adapts to changing market conditions, filtering out false signals and highlighting only high-probability spike setups in real-time. Featuring
Market session with fibonacci
Batsukh Sumchin Khuyagbaatar
Bu gösterge, her gün en sık kullandığımız gösterge olup, en çok kullandığımız stratejilerimiz, ICT ve SMC, borsaların açılış ve kapanış saatlerinde oluşan Stop loss limitleri ve likidite limitleri, ayrıca Fibonacci ile borsaların hacimleri ve yakınlaştırma-uzaklaştırma, görmek istediğiniz borsa hareketini seçip Fibonacci çekme gibi en sık görmek istediğiniz hareketleri görmenizi sağlayan tam otomatik göstergelerdir. Bu göstergeyi kullanarak her türlü ticareti analiz etmeyi öğrendiğinizde, bir da
ATTENTION!!!Get this product at a discounted price NOW!!! Description of the Directional Strength Index mt5 I present to you this awesome indicator that concludes the trading armor of a trader seeking for a strong affirmative and insightful entries and exits confluences.The core idea that runs behind the indicator is generated from the famous children game " TUG OF WAR ".The market is depicted as being influenced by two forces :  buying and selling force. The indicator's work is to determine wh
ROC acceleration-deceleration is the manual system for medium-term scalping. Indicator based on custom ROC system which defines bullish/bearish market and especially  acceleration-deceleration of tendention in the market's main direction. Buy arrow is plotted during bearish market when current trend decelerates and sell  arrow is plotted during bullish market when current trend decelerates. Main Indicator's Features Signals are not repaint,non-late or disappear(exept cases when system recalculat
ON MARKETPLACE FOR ONE MONTH ONLY!! EVERY DAY YOU MISS IS ONE LESS DAY OF PROFIT. VLTL High Frequency Trader PRO VLTL High Frequency Trader PRO is an HFT bot designed for exceptionally high returns. It is built around trading volatile times on XAUUSD (Gold) using tick-based strategies that dominate the market. This bot is the first in the VLTL lineup, with even better and more advanced EAs coming in the future. The EA includes three built-in strategies , each tailored for a different purpose: La
Turpial Pullback
Arlos Elias Rivas Romero
Indicator Type Strategy (Pullback) for all Symbols and Periodicity, Preferably from 30M periodicity. Can be used for manual trading. Its workspace corresponds to channel of 3 bars of Bill Willians. Also relies on the indicator Rsi and Atr. BUY when: There is a Green Arrow STOPLOSS to buy, below the bottom line of the channel (red line)" SELL when: There is a Red Arrow. STOPLOSS to sell, above the upper line of the channel (blue line)
Smart Money Structure & Precision Trading Indicator (MT5) Smart Money Structure & Precision Trading Indicator  is a powerful Smart Money Concepts (SMC) indicator for MetaTrader 5, designed to help traders identify high-probability entries with institutional logic . This indicator automatically detects market structure in real time , highlights key liquidity levels , and provides clear, non-repainting signals so you can trade with confidence and precision. Whether you are a scalper, day trader, o
Linear Trend Predictor - Giriş noktalarını ve yön destek çizgilerini birleştiren bir trend göstergesi. Yüksek/Düşük fiyat kanalını kırma prensibiyle çalışır. Gösterge algoritması piyasa gürültüsünü filtreler, oynaklığı ve piyasa dinamiklerini dikkate alır. Gösterge yetenekleri  Düzeltme yöntemleri kullanılarak piyasa trendi ve ALIM veya SATIŞ emirlerinin açılabileceği giriş noktaları gösterilir.  Herhangi bir zaman dilimindeki grafikleri analiz ederek kısa ve uzun vadeli piyasa hareketlerini
IS PRO Estructura Institucional
Medina Cortez Edison Armando
INSTITUTIONAL STRUCTURE PRO Market Structure + Swings + Fair Value Gaps with SOR Priority Institutional Structure Pro is an advanced market structure indicator based on institutional analysis. The system automatically identifies: Structural highs and lows Structure breakouts (SOR – Structure Override / priority breakout) Bullish and bearish fair value gaps (FVG) Real inefficiency zones with precise rectangles All directly on the chart, with no delay and no repainting. What Does the
Liquidity Map
Alex Amuyunzu Raymond
Liquidity Map  Overview The Liquidity Map indicator is an advanced visualization tool based on ICT Smart Money Concepts . It automatically identifies daily Buy Zones , Sell Zones , and Liquidity Levels , showing where price is likely to reverse or continue based on institutional order flow. It calculates key levels from the daily session — such as the previous day’s high, low, and midpoint — then derives a premium (sell bias) and discount (buy bias) structure. When price trades into these mapped
Glider
Vitalii Zakharuk
The Glider indicator gives accurate and timely signals to enter and exit the transaction that appear on the current candle. Using the indicator is very simple. When a dot and a blue line appear, open a buy deal. When a dot and a red line appear, open a sell deal. The main purpose of this indicator is to determine the moments of entry and exit from transactions, therefore the Glider indicator will display only the trend line and entry points, i.e. displays displays the entry points to the marke
Smart Structure Concepts MT5
Cristhian Alexander Gaibor Cuasquer
Smart Structure Concepts MT5 is an all-in-one Smart Money Concepts indicator created to help traders visually read institutional structure and understand why each movement occurs. Unlike most indicators on the Market, this system does not only draw patterns or zones. It teaches. Every visual element (BOS, CHoCH, OB, FVG, EQH, EQL, PDH, PDL, etc.) includes educational tooltips that explain the concept and the suggested trader action (buy, sell, or wait). These on-chart explanations make it perfe
FREE
Quantum VWAP Pro for MT5
QUANTUM TRADING SOFTWARE LIMITED
The VWAP indicator is another of our suite of volume indicators and one which was first referred to in 1988 when it appeared in an article entitled “The Total Cost Of Transactions On The NYSE” in the March edition of the Journal Of Finance from that year, which went on to explain its importance, particularly from an institutional perspective, which underpins its significance in appreciating the power and importance of this indicator. In many ways, it is akin to the volume price analysis methodol
SmartTrendMA
Jhones Jorente Garcia
A SmartTrendMA foi projetada para identificar melhor zonas de alta, baixa e consolidação, azul alta, vermelho baixa e branco consolidação, vai te auxiliar a identificar melhor a tendência. Em parâmetro regule melhor conforme sua preferência em grau pois cada par de moeda se adequa diferentemente a cor,mude também o período e se quiser mude exponencial ou simples. 
Alpha Trades — Adaptive Professional Trading System Author: Andrii Sydoruk Version: 1.0 Release Date: 31.10.2025 Support: andriisydoruk@gmail.com Description Alpha Trades is a next-generation universal trading expert, designed for stable and controlled operation under any market conditions. The system uses an adaptive analytical approach that automatically adjusts to the current market structure while maintaining a high level of accuracy and safety. The algorithm is built as a multi-layer
TB EA  – Trendline Breakout Expert Advisor Overview TB EA 1.0 is a professional-grade automated trading system that detects and executes trades based on trendline breakouts using a "body break" confirmation methodology. The EA intelligently distinguishes between support and resistance trendlines, executing BUY orders on resistance breakouts and SELL orders on support breakouts. It works seamlessly on Forex pairs and CFD Indices. Key Features Trendline Breakout Detection Automatically detects
The Golden Surgeon MT5 — mas apenas para sistemas desenvolvidos para lidar com ela. O Cirurgião Dourado MT5 O Golden Surgeon é um sistema de negociação automatizado desenvolvido para o MetaTrader 5. EA desenvolvido para traders que buscam crescimento de capital estruturado Ele foi projetado para operar no XAUUSD (Ouro) usando um modelo de execução estruturado e parâmetros de risco predefinidos. O sistema segue uma abordagem baseada em regras, com frequência de negociação controlada e geren
Automated Supply and Demand Tracker MT5. The following videos demonstrate how we use the system for trade setups and analysis.US PPI, Fed Interest Rates, and FOMC Trade Setup Time Lapse: U.S. dollar(DXY) and Australian dollar vs U.S. dollar(AUD/USD)  https://youtu.be/XVJqdEWfv6s  The EUR/USD Trade Setup time lapse 8/6/23.  https://youtu.be/UDrBAbOqkMY . US 500 Cash Trade Setup time lapse 8/6/23  https://youtu.be/jpQ6h9qjVcU .  https://youtu.be/JJanqcNzLGM ,  https://youtu.be/MnuStQGjMyg,&nbsp ;
DYNAMIC SR TREND CHANNEL Dynamic SR Trend Channel is a simple indicator for trend detection as well as resistance/support levels on the current timeframe. It shows you areas where to expect possible change in trend direction and trend continuation. It works with any trading system (both price action and other trading system that use indicators) and is also very good for renko charting system as well. In an uptrend, the red line (main line) serves as the support and the blue line serves as the r
Xau Marti MT5
BILLY ARANDUQUE ABCEDE
Get the EA for FREE Just sign up and use my broker. Broker Link :  https://fbs.partners?ibl=684451&ibp=26113188 Setfile Here :  https://drive.google.com/file/d/1ZKvGf5KaUTZvrt2YE98a18sp7nzGUpVf/view?usp=sharing MT4 Version Here :  https://www.mql5.com/en/market/product/136465 XAU Marti The Smart Choice for Gold & Forex Traders -  Profit Potential! Why This EA Stands Out: RSI-POWERED ENTRIES   - Combines the reliability of RSI indicators with advanced money management for high-probabi
QUANTUM TREND SCANNER Professional Multi-Timeframe Trend Analysis Dashboard Quantum Trend Scanner is an advanced technical indicator designed to analyze market trends across multiple timeframes and currency pairs simultaneously. The indicator provides traders with comprehensive market insights through three integrated analytical panels. LAUNCH PRICE: $30.99 | FINAL PRICE: $80 NEXT PRICE  $53 Quantum Trend Scanner Guide is Here  What It Does The indicator monitors 30 currency pairs across 9 tim
The Rocket Trend indicator is trending. The indicator draws two-color points connected by lines along the chart. This is a trend indicator, it is an algorithmic indicator. It is easy to work and understand when a blue circle appears, you need to buy, when a red one appears, sell. The indicator is used for scalping and pipsing, and has proven itself well. Rocket Trend is available for analyzing the direction of the trend for a specific period of time. Ideal for novice traders learning the laws o
VWAP-ATR Range Indicator Professional Volatility-Adaptive VWAP Bands for Precision Trading The VWAP-ATR Range indicator is a powerful, adaptive volatility framework built around Volume-Weighted Average Price (VWAP). It combines statistical deviation (sigma) with Average True Range (ATR) to create dynamic, market-responsive trading zones that adjust in real time to changing market conditions. Unlike fixed-width VWAP bands, VWAP-ATR Range expands and contracts intelligently based on actual market
Hrum
Yvan Musatov
The Hrum indicator was created to neutralize temporary pauses and rollbacks. It analyzes price behavior and, if there is a temporary weakness in the trend, you can notice this from the indicator readings, as in the case of a pronounced change in trend direction. Entering the market is not difficult, but staying in it is much more difficult. With the Giordano Bruno indicator and its unique trend line, staying on trend will become much easier! Every rise and every fall is reflected in your emoti
SMC Market Blueprint
Alex Amuyunzu Raymond
SMC Market Blueprint Institutional Market Structure Analyzer Based on Smart Money and ICT Concepts Overview SMC Market Blueprint is a comprehensive institutional-grade indicator designed to decode the true structure of the market using Smart Money Concepts (SMC) and ICT (Inner Circle Trader) methodology. It maps the internal market framework — identifying structure shifts, liquidity zones, and order flow transitions across multiple timeframes — giving traders a clear blueprint of how institution
Bu ürünün alıcıları ayrıca şunları da satın alıyor
Divergence Bomber
Ihor Otkydach
4.89 (83)
Bu göstergeyi satın alan herkese aşağıdaki ekstra içerikler ücretsiz olarak sunulmaktadır: Her işlemi otomatik olarak yöneten, Stop Loss ve Take Profit seviyelerini ayarlayan ve işlemleri strateji kurallarına göre kapatan özel yardımcı araç: "Bomber Utility" Göstergenin farklı varlıklar üzerinde kullanılmasına yönelik ayar dosyaları (set dosyaları) Bomber Utility için 3 farklı modda kullanım sunan ayar dosyaları: "Minimum Risk", "Dengeli Risk" ve "Bekle-Gör Stratejisi" Bu ticaret stratejisini hı
RFI levels PRO MT5
Roman Podpora
3.67 (3)
Bu gösterge, fiyat dönüş noktalarını ve fiyat geri dönüş bölgelerini doğru bir şekilde gösterir.       Başlıca oyuncular   . Yeni trendlerin nerede oluştuğunu görüyorsunuz ve her işlem üzerinde kontrolü elinizde tutarak, azami hassasiyetle kararlar alıyorsunuz. TREND LINES PRO   göstergesiyle birlikte kullanıldığında maksimum potansiyelini ortaya koyar.  VERSION MT4 Göstergenin gösterdiği şey: Yeni bir trendin başlangıcında aktivasyonla birlikte tersine dönüş yapıları ve tersine dönüş seviyeler
Azimuth Pro
Ottaviano De Cicco
5 (4)
LAUNCH PROMO Azimuth Pro price is initially set at 299$ for the first 100 buyers. Final price will be 499$ . THE DIFFERENCE BETWEEN RETAIL AND INSTITUTIONAL ENTRIES ISN'T THE INDICATOR — IT'S THE LOCATION. Most traders enter at arbitrary price levels, chasing momentum or reacting to lagging signals. Institutions wait for price to reach structured levels where supply and demand actually shift. Azimuth Pro maps these levels automatically: swing-anchored VWAP, multi-timeframe structure lines, an
TREND ÇİZGİLERİ PRO       Piyasanın gerçek yön değiştirdiği noktayı anlamaya yardımcı olur. Gösterge, gerçek trend dönüşlerini ve büyük oyuncuların piyasaya yeniden girdiği noktaları gösterir. Anlıyorsun   BOS hatları   Daha yüksek zaman dilimlerindeki trend değişiklikleri ve önemli seviyeler, karmaşık ayarlar veya gereksiz gürültü olmadan gösterilir. Sinyaller yeniden çizilmez ve çubuk kapandıktan sonra grafikte kalır. MT4 SÜRÜMÜ   -   RFI LEVELS PRO   göstergesiyle   birlikte kullanıldığında m
ARIPoint
Temirlan Kdyrkhan
ARIPoint is a powerful trading companion designed to generate high-probability entry signals with dynamic TP/SL/DP levels based on volatility. Built-in performance tracking shows win/loss stats, PP1/PP2 hits, and success rates all updated live. Key Features: Buy/Sell signals with adaptive volatility bands Real-time TP/SL/DP levels based on ATR Built-in MA Filter with optional ATR/StdDev volatility Performance stats panel (Success, Profit/Loss, PP1/PP2) Alerts via popup, sound, push, or email Cu
Grabber System MT5
Ihor Otkydach
4.82 (22)
Size mükemmel bir teknik gösterge olan Grabber’ı tanıtıyorum. Bu araç, kullanıma hazır bir “her şey dahil” işlem stratejisi olarak çalışır. Tek bir yazılım kodu içinde güçlü piyasa teknik analiz araçları, işlem sinyalleri (oklar), uyarı işlevleri ve push bildirimleri entegre edilmiştir. Bu göstergeyi satın alan herkes aşağıdaki hediyeleri ücretsiz olarak alır: Açık emirleri otomatik yönetmek için Grabber Yardımcı Aracı Kurulum, yapılandırma ve nasıl işlem yapılacağını adım adım anlatan video kıl
Quantum TrendPulse
Bogdan Ion Puscasu
5 (20)
SuperTrend   ,   RSI   ve   Stochastic'in   gücünü tek bir kapsamlı göstergede birleştirerek işlem potansiyelinizi en üst düzeye çıkaran nihai işlem aracı olan   Quantum TrendPulse'u   tanıtıyoruz. Hassasiyet ve verimlilik arayan yatırımcılar için tasarlanan bu gösterge, piyasa trendlerini, momentum değişimlerini ve en uygun giriş ve çıkış noktalarını güvenle belirlemenize yardımcı olur. Temel Özellikler: SuperTrend Entegrasyonu:   Güncel piyasa trendlerini kolayca takip edin ve karlılık dalgası
Öncelikle, bu Ticaret Aracının Non-Repainting, Non-Redrawing ve Non-Lagging Gösterge olduğunu vurgulamakta fayda var, bu da onu profesyonel ticaret için ideal hale getiriyor. Çevrimiçi kurs, kullanıcı kılavuzu ve demo. Akıllı Fiyat Hareketi Kavramları Göstergesi, hem yeni hem de deneyimli tüccarlar için çok güçlü bir araçtır. İleri ticaret fikirlerini, Inner Circle Trader Analizi ve Smart Money Concepts Ticaret Stratejileri gibi 20'den fazla kullanışlı göstergeyi bir araya getirerek bir araya
Top indicator for MT5   providing accurate signals to enter a trade without repainting! It can be applied to any financial assets:   forex, cryptocurrencies, metals, stocks, indices .  Watch  the video  (6:22) with an example of processing only one signal that paid off the indicator! MT4 version is here It will provide pretty accurate trading signals and tell you when it's best to open a trade and close it. Most traders improve their trading results during the first trading week with the help of
Tanıtım       Quantum Breakout PRO   , Breakout Bölgeleri ile ticaret yapma şeklinizi değiştiren çığır açan MQL5 Göstergesi! 13 yılı aşkın ticaret tecrübesine sahip deneyimli tüccarlardan oluşan bir ekip tarafından geliştirilmiştir.       Kuantum Breakout PRO       yenilikçi ve dinamik koparma bölgesi stratejisiyle ticaret yolculuğunuzu yeni zirvelere taşımak için tasarlanmıştır. Kuantum Breakout Göstergesi, size 5 kar hedefi bölgesi ile kırılma bölgelerinde sinyal okları ve kırılma kutusuna da
Trend Forecaster
Alexey Minkov
5 (7)
The Trend Forecaster indicator utilizes a unique proprietary algorithm to determine entry points for a breakout trading strategy. The indicator identifies price clusters, analyzes price movement near levels, and provides a signal when the price breaks through a level. The Trend Forecaster indicator is suitable for all financial assets, including currencies (Forex), metals, stocks, indices, and cryptocurrencies. You can also adjust the indicator to work on any time frames, although it is recommen
Berma Bands
Muhammad Elbermawi
5 (8)
Berma Bantları (BB'ler) göstergesi, piyasa trendlerini belirlemeyi ve bunlardan yararlanmayı amaçlayan yatırımcılar için değerli bir araçtır. Fiyat ile BB'ler arasındaki ilişkiyi analiz ederek, yatırımcılar bir piyasanın trend veya aralıklı fazda olup olmadığını ayırt edebilir. Daha fazla bilgi edinmek için [ Berma Home Blog ] adresini ziyaret edin. Berma Bantları üç belirgin çizgiden oluşur: Üst Berma Bandı, Orta Berma Bandı ve Alt Berma Bandı. Bu çizgiler fiyatın etrafına çizilir ve genel tren
Göstergemiz, piyasada ilgi gösterilen bölgeleri vurgular ve ardından emir birikim bölgelerini gösterir. Büyük ölçekli bir emir defteri (order book) gibi çalışır. Bu, büyük sermaye için geliştirilmiş bir göstergedir. Performansı olağanüstüdür. Piyasada ne tür bir ilgi olursa olsun, onu görürsünüz . (Bu, tamamen yeniden yazılmış ve otomatikleştirilmiş bir versiyondur – artık manuel analiz gerekmez.) İşlem Hızı (Transaction Speed) , piyasada büyük emirlerin nerede ve ne zaman biriktiğini gösteren v
Advanced Supply Demand MT5
Bernhard Schweigert
4.53 (15)
Herhangi bir Acemi veya Uzman Tüccar için En İyi Çözüm! Bu gösterge benzersiz, yüksek kaliteli ve uygun fiyatlı bir ticaret aracıdır çünkü bir dizi tescilli özelliği ve yeni bir formülü bir araya getirdik. Bu güncelleme ile çift zaman dilimi dilimlerini gösterebileceksiniz. Yalnızca daha yüksek bir TF gösteremeyeceksiniz, aynı zamanda TF grafiğini ve ARTIK daha yüksek TF'yi de gösterebileceksiniz: YUVARLAK BÖLGELERİ GÖSTERMEK. Tüm Arz Talebi tüccarları buna bayılacak. :) Önemli Bilgiler Açıkland
Protect against whipsaws: revolutionize your swing trading approach Swing Trading is the first indicator designed to detect swings in the direction of the trend and possible reversal swings. It uses the baseline swing trading approach, widely described in trading literature. The indicator studies several price and time vectors to track the aggregate trend direction and detects situations in which the market is oversold or overbought and ready to correct. [ Installation Guide | Update Guide | Tro
TrendMaestro5
Stefano Frisetti
note: this indicator is for METATRADER4, if you want the version for METATRADER5 this is the link:  https://www.mql5.com/it/market/product/108106 TRENDMAESTRO ver 2.5 TRENDMAESTRO recognizes a new TREND from the start, he never makes mistakes. The certainty of identifying a new TREND is priceless. DESCRIPTION TRENDMAESTRO identifies a new TREND in the bud, this indicator examines the volatility, volumes and momentum to identify the moment in which there is an explosion of one or more of these da
Unlock hidden profits: accurate divergence trading for all markets Tricky to find and scarce in frequency, divergences are one of the most reliable trading scenarios. This indicator finds and scans for regular and hidden divergences automatically using your favourite oscillator. [ Installation Guide | Update Guide | Troubleshooting | FAQ | All Products ] Easy to trade Finds regular and hidden divergences Supports many well known oscillators Implements trading signals based on breakouts Displays
PZ Trend Trading MT5
PZ TRADING SLU
3.8 (5)
Capture every opportunity: your go-to indicator for profitable trend trading Trend Trading is an indicator designed to profit as much as possible from trends taking place in the market, by timing pullbacks and breakouts. It finds trading opportunities by analyzing what the price is doing during established trends. [ Installation Guide | Update Guide | Troubleshooting | FAQ | All Products ] Trade financial markets with confidence and efficiency Profit from established trends without getting whip
Scalping Lines System MT5 , özellikle M1-H1 zaman dilimlerinde Altın (XAUUSD) varlığıyla işlem yapmak için tasarlanmış bir scalping işlem sistemidir. Kısa vadeli sinyalleri belirlemek için trend, volatilite ve aşırı alım/aşırı satım piyasa analizi göstergelerini tek bir osilatörde birleştirir. Sinyal çizgileri için ana dahili parametreler önceden yapılandırılmıştır. Bazı parametreler manuel olarak ayarlanabilir: MA trendini kullanarak trend yönündeki bir dizi sinyalin süresini düzenleyen "Tre
" Dynamic Scalper System MT5 " göstergesi, trend dalgaları içinde işlem yapmak için scalping yöntemi için tasarlanmıştır. Başlıca döviz çiftleri ve altın üzerinde test edilmiştir, diğer işlem araçlarıyla uyumluluğu mümkündür. Ek fiyat hareketi desteğiyle trend boyunca pozisyonların kısa vadeli açılması için sinyaller sağlar. Göstergenin prensibi. Büyük oklar trend yönünü belirler. Küçük oklar şeklinde scalping için sinyaller üreten bir algoritma trend dalgaları içinde çalışır. Kırmızı oklar yü
Matreshka
Dimitr Trifonov
5 (2)
Matreshka self-testing and self-optimizing indicator: 1. Is an interpretation of the Elliott Wave Analysis Theory. 2. Based on the principle of the indicator type ZigZag, and the waves are based on the principle of interpretation of the theory of DeMark. 3. Filters waves in length and height. 4. Draws up to six levels of ZigZag at the same time, tracking waves of different orders. 5. Marks Pulsed and Recoil Waves. 6. Draws arrows to open positions 7. Draws three channels. 8. Notes support and re
Gartley Hunter Multi
Siarhei Vashchylka
5 (11)
Gartley Hunter Multi - An indicator for searching for harmonic patterns simultaneously on dozens of trading instruments and on all possible timeframes. Manual (Be sure to read before purchasing) | Version for MT4 Advantages 1. Patterns: Gartley, Butterfly, Shark, Crab. Bat, Alternate Bat, Deep Crab, Cypher 2. Simultaneous search for patterns on dozens of trading instruments and on all possible timeframes 3. Search for patterns of all possible sizes. From the smallest to the largest 4. All fou
RelicusRoad Pro: Kantitatif Piyasa İşletim Sistemi ÖMÜR BOYU ERİŞİMDE %70 İNDİRİM (SINIRLI SÜRE) - 2.000+ TRADER'A KATILIN Neden çoğu trader "mükemmel" indikatörlere rağmen başarısız olur? Çünkü tekil kavramları boşlukta trade ederler. Bağlamı olmayan bir sinyal kumardır. Sürekli kazanmak için KONFLÜANS (UYUM) gerekir. RelicusRoad Pro basit bir ok indikatörü değildir. Tam bir Kantitatif Piyasa Ekosistemi dir. Tescilli volatilite modellemesini kullanarak fiyatın ilerlediği "Adil Değer Yolu"nu har
The Institutional Secret Method  represents a paradigm shift in market analysis, moving away from lagging indicators and into the realm of Topological Finance . It is engineered to decode the hidden geometry of price movement by calculating the most efficient path—the Geodesic —between current price action and institutional liquidity targets. The system views the market as a physical landscape where price is naturally drawn toward massive pools of liquidity (Stops). It uses two primary calculati
Allows multiple indicators to be combined into a single indicator, both visually and in terms of an alert. Indicators can include standard indicators, e.g. RSI, CCI, etc., and also Custom Indicators, even those purchased through Market, or where just have the ex4 file. An early alert is provided, say when 4 out 5 indicators have lined up, and a confirmed alert when all are in agreement. A‌lso features a statistics panel reporting the success of the combined indicator by examining the current cha
BTMM State Engine Pro — the   all-in-one Banks   & Institutions Market Maker indicator for Meta Trader 5. Built for   BTMM traders who follow the Asian   session breakout methodology with Kill Zone timing , level stacking, peak formation detection , and multi-pair scanning — all   from a single chart. Combines   a full BTMM State Engine   with a built-in multi-pair Scanner dashboard, eliminating the need to flip between charts or run multiple indicators. WHAT IT DOES Automatically detec
UZFX {SSS} Scalping Smart Signals MT5, hızlı hareket eden piyasalarda doğru, gerçek zamanlı sinyaller talep eden Scalper'lar, Günlük Yatırımcılar ve Swing Yatırımcılar için tasarlanmış, Yeniden Boyama Yapmayan yüksek performanslı bir ticaret göstergesidir. (UZFX-LABS) tarafından geliştirilen bu gösterge, fiyat hareket analizi, trend onayı ve akıllı filtrelemeyi bir araya getirerek tüm döviz çiftleri ve zaman dilimlerinde yüksek olasılıklı alım ve satım sinyalleri üretir. Temel Özellikler Akıllı
DETECT THE TREND AND THE BEST PRICE TO ENTER A TRADE Trend Detection for perfect entry - Distinguish the direction of thetrend and its strength, showing a line of different colors depending on whether the trend is strong bullish, weak bullish, strong bearish or weak bearish.- Best Entry point for perfect entry - Shows an area with the best entry in favor of trend. Never trade against the trend again. Entry signals and alerts - When the price is in a valid zone, it sends pop up alerts, telephon
Bill Williams Advanced
Siarhei Vashchylka
5 (10)
Bill Williams Advanced is designed for automatic chart analysis using Bill Williams' "Profitunity" system. The indicator analyzes four timeframes at once. Manual (Be sure to read before purchasing) Advantages 1. Analyzes the chart using Bill Williams' "Profitunity" system. Signals are displayed in a table in the corner of the screen and on the price chart. 2. Finds all known AO and AC signals, as well as zone signals. Equipped with a trend filter based on the Alligator. 3. Finds "Divergence Bar
Ultimate SMC Indicator
Hicham Mahmoud Almoustafa
1 (1)
ULTIMATE SMC INDICATOR — PRO EDITION     Trade Like Institutional Traders Are you tired of losing trades because you don't  know WHERE the big money is positioned? The Ultimate SMC Indicator reveals the hidden  footprints of banks and institutions directly on  your chart — giving you the edge that professional  traders use every day. WHAT IS SMC
Yazarın diğer ürünleri
Keltner-Enhanced, Keltner Kanallarının doğruluğunu ve okunabilirliğini, bunları ayarlamak için birçok seçenek ve META varsayılanının ötesinde daha fazla beş fiyat hesaplaması ile geliştirir. Keltner-E göstergesi, Bollinger Bantları ve Hareketli Ortalama Zarflarına benzer bantlı bir göstergedir. Bir orta çizginin üzerinde bir üst zarf ve orta çizginin altında bir alt zarftan oluşurlar.  Keltner Kanallarını kullanırken dikkat edilmesi gereken ana olaylar, Üst Zarfın üstünde veya Alt Zarfın altı
FREE
Her gün belirli bir mum üzerinde çalışan bir PIVOT'u kaç kez aradınız? Birçok tüccar, piyasa açıldıktan 30 dakika sonra veya öğlen 12 gibi her gün belirli bir saate göre günün trendinin yönünü tahmin etmeyi sever. Bu gösterge belirli bir zaman (saat ve dakika) belirlemenize olanak tanır ve o zamandan bir sonraki güne aynı anda bir pivot çizer. Söz konusu mum/saate göre beş çizgi gösterir: medyan, maksimum, minimum, destek ve direnç. Seçilen zaman PERIOD sınırlarının dışındaysa (M5 zaman dili
FREE
Jurik Gelişmiş MA (JurMA), Mark Jurik tarafından tasarlanan orijinal JMA üzerinde geliştirilmiş, yeniden boyanmayan bir teknik göstergedir.  Geleneksel hareketli ortalamalarda mevcut olan gecikmeyi azaltmak, pürüzsüzlüğü iyileştirmek ve gürültüyü azaltmak için tasarlanmıştır. JurMA piyasa oynaklığına uyum sağlar ve kullanıcı tarafından hassasiyet için ince ayar yapılabilir, bu da onu finansal piyasalardaki eğilimleri ve tersine dönüşleri belirlemek için yararlı hale getirir. Bu uyarlanabilirli
Trend On Close
David Ben Svaiter
TrendOnClose, İkili piyasa yatırımcıları için tasarlanmış, belirli mum döngüleri içindeki trendlerin ve karşı trendlerin istatistiksel analizine odaklanan sofistike bir göstergedir. Her döngü, bir sonraki döngünün başlangıcına kadar sonraki istatistiksel analiz için trend yönünü (YUKARI / AŞAĞI - BOĞA / AYI) belirleyen mum KAPANIŞ fiyatı ile tanımlanır. İstatistiksel analiz iki konfigürasyonla çalışır: ⦁ SONRAKİ MUM OLARAK İSTATİSTİKSEL HEDEF: Algoritma, döngü içindeki sonraki muma odaklanır.
HAshi-E is an enhanced way to analyze Heiken-Ashi signals. Briefing: Heiken-Ashi is particularly valued for its ability to filter out short-term volatility, making it a preferred tool for identifying and following trends, helps in decision-making regarding entry and exit points, and assists in distinguishing between false signals and genuine trend reversals. Unlike traditional candlestick charts, Heiken-Ashi candles are calculated using average values of previous bars, creating a smoother, mo
Designed by Welles Wilder for daily commodity charts, the ADXW is now used in various markets by technical traders to assess the strength of a trend or even a trend for short- or long-term trades. The ADXW uses a positive (DI+) and negative (DI-) directional indicator in addition to its trend line (ADX). According to Wilder, a trend has strength when the ADX signal is above 25; the trend is weak (or the price has no trend) when the ADX is below 20. The absence of a trend does not mean that th
On-Balance Volume (OBV) is a technical indicator that relates volume and price to identify price movements. The basic idea behind OBV is that changes in volume generally precede price changes. The indicator accumulates volumes for periods when the price closes higher and subtracts volumes for periods when the price closes lower. This results in a value used to identify the direction of the asset's trend. The interpretation of the OBV is simple: a rising OBV suggests that buyers are willing to
In the realm of technical analysis, ParbMA emerges as a highly intuitive tool for examining the Parabolic SAR trend . This innovative approach leverages a customizable line, distinguished by its versatility in color, shape, and width options. Such flexibility enhances visual analysis and significantly aids in strategizing and decision-making. The ParbMA (Parabolic Moving Average) is a custom technical indicator that combines the concepts of J. Welles Wilder's Parabolic SAR (Stop and Reverse) a
Slow AMA
David Ben Svaiter
Compared to simple or exponential moving averages, slow adaptive trend lines might offer a more nuanced view of the trend by adjusting their sensitivity based on market conditions. However, their slow nature might also mean they are late in signaling reversals when market conditions change rapidly - and that is the difference between them and our SlowAMA . SlowAMA was designed to be a better long-term trend indicator than EMA and other Moving Averages. It uses our JurMA calculations, reducing
HAshi-E, Heiken-Ashi sinyallerini analiz etmenin gelişmiş bir yoludur. Brifing: Heiken-Ashi özellikle kısa vadeli dalgalanmaları filtreleme kabiliyeti nedeniyle değerlidir, bu da onu trendleri belirlemek ve takip etmek için tercih edilen bir araç haline getirir, giriş ve çıkış noktalarına ilişkin karar vermeye yardımcı olur ve yanlış sinyaller ile gerçek trend dönüşlerini ayırt etmeye yardımcı olur. Geleneksel mum grafiklerinin aksine, Heiken-Ashi mumları önceki çubukların ortalama değerleri
Her gün belirli bir zaman diliminde çalışan bir PIVOT'u kaç kez aradınız? Birçok yatırımcı, NYSE açılmadan 2 saat öncesinden 1 saat sonrasına veya NYSE açılışından 30 dakika sonrasına kadar her gün belirli bir zaman aralığına dayalı olarak günün trendinin yönünü tahmin etmek ister. Bu gösterge, belirli bir zaman aralığı (saat ve dakika) belirlemenize olanak tanır ve bu aralıktan aynı zaman aralığındaki bir sonraki güne kadar bir pivot çizer. Buna dayalı olarak beş çizgi gösterir: medyan, yüks
Filtrele:
İnceleme yok
İncelemeye yanıt